Review Special Issues

Role of nitric oxide in psychostimulant-induced neurotoxicity

  • In recent decades, consumption of psychostimulants has been significantly increased all over the world, while exact mechanisms of neurochemical effects of psychomotor stimulants remained unclear. It is assumed that the neuronal messenger nitric oxide (NO) may be involved in mechanisms of neurotoxicity evoked by psychomotor stimulants. However, possible participation of NO in various pathological states is supported mainly by indirect evidence because of its short half- life in tissues. Aim of this review is to describe the involvement of NO and the contribution of lipid peroxidation (LPO) and acetylcholine (ACH) release in neurotoxic effects of psychostimulant drugs. NO was directly determined in brain structures by electron paramagnetic resonance (EPR). Both NO generation and LPO products as well as release of ACH were increased in brain structures following four injections of amphetamine (AMPH). Pretreatment of rats with the non-selective inhibitor of NO- synthase (NOS) N-nitro-L-arginine or the neuronal NOS inhibitor 7-nitroindazole significantly reduced increase of NO generation as well as the rise of ACH release induced by AMPH. Both NOS inhibitors injected prior to AMPH had no effect on enhanced levels of LPO products. Administration of the noncompetitive NMDA receptor antagonist dizocilpine abolished increase of both NO content and concentration of LPO products induced by of the psychostimulant drug. Dizocilpine also eliminated the influence of AMPH on the ACH release. Moreover, the neurochemical and neurotoxic effects of the psychostimulant drug sydnocarb were compared with those of AMPH. Single injection of AMPH showed a more pronounced increase in NO and TBARS levels than after an equimolar concentration of sydnocarb. The findings demonstrate the crucial role of NO in the development of neurotoxicity elicited by psychostimulants and underline the key role of NOS in AMPH-induced neurotoxicity.

    Citation: Valentina Bashkatova, Athineos Philippu. Role of nitric oxide in psychostimulant-induced neurotoxicity[J]. AIMS Neuroscience, 2019, 6(3): 191-203. doi: 10.3934/Neuroscience.2019.3.191

    Related Papers:

    [1] Dong Qiu, Dongju Li . Paradox in deviation measure and trap in method improvement—take international comparison as an example. Quantitative Finance and Economics, 2021, 5(4): 591-603. doi: 10.3934/QFE.2021026
    [2] Korhan Gokmenoglu, Baris Memduh Eren, Siamand Hesami . Exchange rates and stock markets in emerging economies: new evidence using the Quantile-on-Quantile approach. Quantitative Finance and Economics, 2021, 5(1): 94-110. doi: 10.3934/QFE.2021005
    [3] Lennart Ante . Bitcoin transactions, information asymmetry and trading volume. Quantitative Finance and Economics, 2020, 4(3): 365-381. doi: 10.3934/QFE.2020017
    [4] Haryo Kuncoro, Fafurida Fafurida, Izaan Azyan Bin Abdul Jamil . Growth volatility in the inflation-targeting regime: Evidence from Indonesia. Quantitative Finance and Economics, 2024, 8(2): 235-254. doi: 10.3934/QFE.2024009
    [5] Yuan-Ming Lee, Kuan-Min Wang . How do Economic Growth Asymmetry and Inflation Expectations Affect Fisher Hypothesis and Fama’s Proxy Hypothesis?. Quantitative Finance and Economics, 2017, 1(4): 428-453. doi: 10.3934/QFE.2017.4.428
    [6] Hongxuan Huang, Zhengjun Zhang . An intrinsic robust rank-one-approximation approach for currency portfolio optimization. Quantitative Finance and Economics, 2018, 2(1): 160-189. doi: 10.3934/QFE.2018.1.160
    [7] Elvira Caloiero, Massimo Guidolin . Volatility as an Alternative Asset Class: Does It Improve Portfolio Performance?. Quantitative Finance and Economics, 2017, 1(4): 334-362. doi: 10.3934/QFE.2017.4.334
    [8] Mustafa Tevfik Kartal, Özer Depren, Serpil Kılıç Depren . The determinants of main stock exchange index changes in emerging countries: evidence from Turkey in COVID-19 pandemic age. Quantitative Finance and Economics, 2020, 4(4): 526-541. doi: 10.3934/QFE.2020025
    [9] Yonghong Zhong, Richard I.D. Harris, Shuhong Deng . The spillover effects among offshore and onshore RMB exchange rate markets, RMB Hibor market. Quantitative Finance and Economics, 2020, 4(2): 294-309. doi: 10.3934/QFE.2020014
    [10] Tolga Tuzcuoğlu . The impact of financial fragility on firm performance: an analysis of BIST companies. Quantitative Finance and Economics, 2020, 4(2): 310-342. doi: 10.3934/QFE.2020015
  • In recent decades, consumption of psychostimulants has been significantly increased all over the world, while exact mechanisms of neurochemical effects of psychomotor stimulants remained unclear. It is assumed that the neuronal messenger nitric oxide (NO) may be involved in mechanisms of neurotoxicity evoked by psychomotor stimulants. However, possible participation of NO in various pathological states is supported mainly by indirect evidence because of its short half- life in tissues. Aim of this review is to describe the involvement of NO and the contribution of lipid peroxidation (LPO) and acetylcholine (ACH) release in neurotoxic effects of psychostimulant drugs. NO was directly determined in brain structures by electron paramagnetic resonance (EPR). Both NO generation and LPO products as well as release of ACH were increased in brain structures following four injections of amphetamine (AMPH). Pretreatment of rats with the non-selective inhibitor of NO- synthase (NOS) N-nitro-L-arginine or the neuronal NOS inhibitor 7-nitroindazole significantly reduced increase of NO generation as well as the rise of ACH release induced by AMPH. Both NOS inhibitors injected prior to AMPH had no effect on enhanced levels of LPO products. Administration of the noncompetitive NMDA receptor antagonist dizocilpine abolished increase of both NO content and concentration of LPO products induced by of the psychostimulant drug. Dizocilpine also eliminated the influence of AMPH on the ACH release. Moreover, the neurochemical and neurotoxic effects of the psychostimulant drug sydnocarb were compared with those of AMPH. Single injection of AMPH showed a more pronounced increase in NO and TBARS levels than after an equimolar concentration of sydnocarb. The findings demonstrate the crucial role of NO in the development of neurotoxicity elicited by psychostimulants and underline the key role of NOS in AMPH-induced neurotoxicity.


    Transparent photoelastic materials represent an exciting alternative to the experimental study of stress and strain distributions induced in solids by carges. When subjected to carges, these materials present the double refraction phenomenon, or birefringence, changing the polarization state of the transmitted light through the solids, which can be used to analyze the stress distribution [1]. The effect of double refraction, first described by Bartholinus [2,3,4] and related with the stress state by Brewster in the early 19th century [5], advanced throughout the 20th century with a non-destructive set of techniques and methods which associates the study of material stresses with optics, the photoelasticity [6,7,8]. Since the pioneering work of Coker and Filon [9,10,11], photoelasticity became a fundamental base for determining stress and strain distributions in photoelastic materials. Thus, great interest was generated in several fields, such as Engineering and Odontology [12,13,14], which validated and contributed to developing the theoretical method of finite elements [15,16].

    Despite advances, most studies are qualitative or indirectly quantitative [13,14] due to the difficulties in obtaining direct optical information. Improvements in qualitative data and quantitative analysis methods are needed so that non-destructive, fast, and reliable optical methods become a reference for determining stress distribution in materials. Although holographic techniques have advanced significantly in recent years, the various works have invested very little in the stresses distribution analysis in photoelasticity using holography. The dynamics of holography allow the results to be more precise, as they are based on optical properties such as intensity, phase, refractive index, etc., which are provided directly or almost directly, thus offering a great perspective in the more quantitative treatment of problems involving elasticity mechanics [17].

    We present an alternative approach to determine the stress distribution profile through a non-destructive procedure based on digital holography (DH) [18,19], allowing us to obtain quantitative intensity and phase information from light transmitted through a photoelastic material. The DH produces remarkably accurate results when combined with appropriate statistical processing of optical data, facilitating the quantitative treatment of the specific problem as outlined in the proposed methods [20]. An off-axis holographic setup was used to obtain two cross-holograms with two orthogonally polarized reference waves and a birefringent system with photoelastic samples under static loads [21,22,23,24,25]. After digitally reconstructed with DH, the received data generates the phase differences used to calculate the distributions of elastic stresses. The validation of the method was carried out with the methods finite elements and RGB (red, green, and blue) photoelasticity [14,16,26,27].

    Four standard rectangular blocks, composed of mixtures of epoxy resin solutions, were prepared according to the traditional procedures [28] of the photoelastic technique, constituting the samples used in this work. The preparation of the samples involved two stages: making the silicone molds, from curing in a liquid solution and catalyst, and the photoelastic samples, from curing, in silicone molds, a liquid solution of epoxy resin and hardener. Details are presented in the work [17]. For the determinations of the mechanical and holographic parameters, two samples with different thicknesses were made, one more flexible and one less flexible. Two other samples with different thicknesses, one more and one less flexible, were also made to determine the stress distributions. Details of the procedures are presented in [17]. The more or less flexible samples were intended to help verify the order of magnitude of the stress-optical coefficient (C) and to provide a greater range of comparison with the photoelastic methodology.

    The utilized holographic technique is shown in Figure 1.

    Figure 1.  The holographic system measures the phase differences between the orthogonal components of the light transmitted in a birefringent system. OW: object wave; W0º: reference wave with horizontal polarization at 0º; W90º: reference wave with vertical polarization at 90º. P are polarizers. WS the wave splitters; λ/2 are half-wave plates, and M are mirrors.

    A laser light source (1) was used to generate three independent waves: one object wave (OW), with the direction of polarization at 45º concerning two orthogonal reference waves, one with the direction of polarization at 0º (W0º), and another with the direction of polarization at 90º (W90º). Two distinct holograms were produced from the resulting interference patterns among OW, W0º, and W90º, propagating with different angles to the digital camera, as shown in Figure 1: θ(0º) between the OW and W0º, and θ (90º) between OW and W90º, as limited by the N-quest Theorem [29,30,31]. Two sets of holograms were recorded from each sample for compression and decompression in the birefringent system. The compression occurs by the progressive addition of load on the samples, and the decompression occurs by progressive removal of these loads.

    The photoelastic images were obtained by blocking both reference waves, removing the wave splitter (WS), near the digital camera, and exchanging the polarizer, P45º, of the object wave for two polarizers with orthogonal polarizations, one before and another after the photoelastic sample. Figure 2 presents an experimental configuration scheme used in photoelasticity.

    Figure 2.  Schematic of the transmission brightfield elliptical polariscope. Light source with reduced intensity encounters a polarizer and a quarter-wave sheet λ/4, before interacting with the sample. It then passes through another quarter-wave blade and another analyzing polarizer. The quarter-wave blades were positioned to eliminate isoclinic fringes, which are not important for this study. Between the wave blades, a load device allows carges to be applied to the sample, changing the polarization state. The result for the observer, int the digital camera, is a pattern of isochromatic fringes.

    The optical information obtained through photoelasticity is related to the difference between the stresses considered in the components longitudinal ($ {\mathsf{σ}}_{\parallel } $) and transverse ($ {\mathsf{σ}}_{\perp } $) to the applied load, defined by Eq 1, as given by the stress-optic law [6,17,28]:

    $ {\mathrm{n}}_{\parallel }-{\mathrm{n}}_{\perp } = {\rm{C}} \left({\mathsf{σ}}_{\parallel }-{\mathsf{σ}}_{\perp }\right) $ (1)

    where $ {\rm{C}} $ is the stress-optical coefficient, and $ {(\mathrm{n}}_{\parallel }-{\mathrm{n}}_{\perp }) $ is the difference between the refraction indexes in the components longitudinal ($ {\mathrm{n}}_{\parallel } $) and transverse ($ {\mathrm{n}}_{\perp } $) to the effort. For a material with thickness e, the refractive index difference is also associated with the phase difference Δϕ, so Eq 1 can be rewritten as Eq 2:

    $ \left({\mathsf{σ}}_{\parallel }-{\mathsf{σ}}_{\perp }\right) = \frac{{\mathrm{f}}_{\mathsf{σ}}\mathrm{N}}{\mathrm{e}} $ (2)

    where $ \mathrm{N} = \frac{\mathrm{\Delta }{\mathsf{ϕ}}}{2{\mathsf{π}}} $ is defined as the relative retardation, $ {\mathrm{f}}_{\mathsf{σ}} = \frac{{\mathsf{λ}}}{{\rm{C}} } $ is the fringe value that indicates the degree of rigidity of the material, and λ is the wavelength of the light source. Using the matrix of stress-strain $ ({\mathsf{σ}}-\mathsf{ε} $) of the material in the stress state plane [26], the difference between the stresses in the orthogonal components, defined by Eq 3, is [17]:

    $ \left[σσ
    \right] = \frac{\mathrm{E}}{1-{\rm{\nu }}^{2}}\left[1ν
    ν1
    \right]\left[εε
    \right]\Rightarrow \left({\mathsf{σ}}_{\parallel }-{\mathsf{σ}}_{\perp }\right) = \frac{\mathrm{E}}{1+{\rm{\nu }}}\left({\mathsf{ε}}_{\parallel }-{\mathsf{ε}}_{\perp }\right) $
    (3)

    $ \mathrm{E} $ is the mechanical elasticity modulus, and ν is the Poisson's coefficient. Therefore, comparing Eqs 2 and 3, with $ \mathrm{N} = \left({\mathsf{ε}}_{\parallel }-{\mathsf{ε}}_{\perp }\right) $, the material fringes value can be determined by their intrinsic properties through Eq 4 [17]:

    $ {\mathrm{f}}_{\mathsf{σ}} = \frac{\mathrm{e}\mathrm{E}}{1+{\rm{\nu }}} = \frac{{\mathsf{λ}}}{{\rm{C}} \left({\mathsf{λ}}\right)} $ (4)

    The holographic method was empirically inferred and correlated with the stress-optic law. The stress difference $ \left({\mathsf{σ}}_{\parallel }-{\mathsf{σ}}_{\perp }\right) $ occurs in the plane normal to the passage of light [26]. Due to angular displacements, the shear stresses were not considered to limit the boundary conditions and obtain the desired equation. In analogy with photoelasticity, the stress-strain matrix for the holographic parameters is given by Eq 5 [17]:

    $ \left[σσ
    \right] = \frac{\mathfrak{E}}{\mathrm{a}\left(1-{\rm{\nu }}^{2}\right)}\left[1νν1
    \right]\left[aεHaεH
    \right]\Rightarrow {\left({\mathsf{σ}}_{\parallel }-{\mathsf{σ}}_{\perp }\right)}_{\mathrm{h}\mathrm{o}\mathrm{l}\mathrm{o}\mathrm{g}\mathrm{r}\mathrm{a}\mathrm{p}\mathrm{h}\mathrm{i}\mathrm{c}} = \frac{\mathfrak{E}}{\left(1+{\rm{\nu }}\right)}\mathrm{\aleph } $
    (5)

    considering, by Eq 6, that

    $ \mathfrak{E} = \mathrm{a}\mathrm{E} $ (6)

    $ \mathfrak{E} $ is defined as the holographic elasticity modulus, and $ \mathrm{a} $ is a dimensionless constant that relates the holography elasticity with the mechanical elasticity. $ {\mathsf{ε}}_{\mathrm{H}} = \frac{1}{\mathrm{a}}\mathsf{ε} $ is defined as the relative holographic deformation and $ \mathrm{\aleph } = \frac{{\left({\mathsf{ϕ}}_{\parallel }-{\mathsf{ϕ}}_{\perp }\right)}_{\mathrm{h}\mathrm{o}\mathrm{l}\mathrm{o}\mathrm{g}\mathrm{r}\mathrm{a}\mathrm{p}\mathrm{h}\mathrm{i}\mathrm{c}}}{2{\mathsf{π}}} = \left({{\mathsf{ε}}_{\mathrm{H}}}_{\parallel }-{{\mathsf{ε}}_{\mathrm{H}}}_{\perp }\right) $ as the relative holographic retardation. Thus, the holographic dispersion can be written as the Eq 7 [17]:

    $ \mathrm{H}\left({\mathsf{λ}}\right)\equiv \frac{{\mathsf{λ}}}{{\mathrm{f}}_{\mathsf{σ}}} = \frac{\mathrm{a}\left(1+{\rm{\nu }}\right)}{\mathrm{e}\mathfrak{E}}{\mathsf{λ}} $ (7)

    where, by Eq 8,

    (8)

    and $ {\mathrm{f}}_{\mathsf{σ}} $ are the fringe values ​​obtained in holography and photoelasticity, respectively. The photoelastic fringe value is related to the wavelength of light ($ {\mathsf{λ}} $) and the photoelastic stress-optical coefficient ($ {\rm{C}} $). Then, analogously to what occurs with photoelasticity, there comes the holographic dispersion term, $ \mathrm{H}\left({\mathsf{λ}}\right), $ an intrinsic property of the material whose value depends on the light wavelength, resultant from the relation between the component differences in refractive indexes, $ {\left({\mathrm{n}}_{\parallel }-{\mathrm{n}}_{\perp }\right)}_{\mathrm{h}\mathrm{o}\mathrm{l}\mathrm{o}\mathrm{g}\mathrm{r}\mathrm{a}\mathrm{p}\mathrm{h}\mathrm{i}\mathrm{c}} $ and the plane stresses $ {\left({\mathsf{σ}}_{\parallel }-{\mathsf{σ}}_{\perp }\right)}_{\mathrm{h}\mathrm{o}\mathrm{l}\mathrm{o}\mathrm{g}\mathrm{r}\mathrm{a}\mathrm{p}\mathrm{h}\mathrm{i}\mathrm{c}} $. For a given wavelength, the stress-holographic law is given by Eq 9 [17]:

    $ {\left({\mathrm{n}}_{\parallel }-{\mathrm{n}}_{\perp }\right)}_{\mathrm{h}\mathrm{o}\mathrm{l}\mathrm{o}\mathrm{g}\mathrm{r}\mathrm{a}\mathrm{p}\mathrm{h}\mathrm{i}\mathrm{c}} = \mathrm{H}{\left({\mathsf{σ}}_{\parallel }-{\mathsf{σ}}_{\perp }\right)}_{\mathrm{h}\mathrm{o}\mathrm{l}\mathrm{o}\mathrm{g}\mathrm{r}\mathrm{a}\mathrm{p}\mathrm{h}\mathrm{i}\mathrm{c}} $ (9)

    We have experimentally confirmed these equations in [21,22].

    The off-axis configuration separates the diffraction orders during the digital reconstruction performed with FTM's fresnel transform method [17,32,33]. The image field (ψmn) and phase (ϕmn) were calculated using Eqs 10 and 11, and the corresponding maps were reconstructed.

    $ {\mathsf{ψ}}_{\mathrm{m}\mathrm{n}} = \frac{{\mathrm{e}}^{\mathrm{i}\mathrm{k}\mathrm{z}}\bullet {\mathrm{e}}^{\frac{\mathrm{i}\mathrm{k}\mathrm{z}{\mathsf{λ}}}{2}\left(\frac{{\mathrm{n}}^{2}}{{\mathrm{N}}^{2}{\mathrm{\Delta }{\mathsf{ξ}}}^{2}}+\frac{{\mathrm{m}}^{2}}{{\mathrm{M}}^{2}{\mathrm{\Delta }\mathrm{\eta }}^{2}}\right)}}{\mathrm{i}\mathrm{z}{\mathsf{λ}}}\bullet \mathrm{F}\left[\mathrm{\Delta }{\mathrm{k}}_{{\mathsf{ξ}}}, \mathrm{\Delta }{\mathrm{k}}_{\mathsf{η}}\right] $ (10)
    $ {\mathsf{ϕ}}_{\mathrm{m}\mathrm{n}} = \mathrm{a}\mathrm{r}\mathrm{c}\mathrm{t}\mathrm{g}\left\{\frac{\mathrm{I}\mathrm{m}\left[{\mathsf{ψ}}_{\mathrm{m}\mathrm{n}}\right]}{\mathrm{R}\mathrm{e}\left[{\mathsf{ψ}}_{\mathrm{m}\mathrm{n}}\right]}\right\} $ (11)

    where $ {\rm{F}}\left[\rm{\Delta }{\rm{k}}_{{\mathsf{ξ}}}, \rm{\Delta }{\rm{k}}_{{\mathsf{η}}}\right] = \rm{F}\left[{\rm{I}}_{\rm{H}}\left({\mathsf{ξ}}, {\mathsf{η}}\right)\bullet {{\mathsf{ψ}}}_{\rm{R}}\left({\mathsf{ξ}}, {\mathsf{η}}\right)\bullet {\rm{e}}^{\frac{{\mathsf{π}}\rm{i}}{\rm{z}\rm{\lambda }}\left[{\left(\rm{n}\bullet \rm{\Delta }{\mathsf{ξ}}\right)}^{2}+{\left(\rm{m}\bullet \rm{\Delta }{\mathsf{η}}\right)}^{2}\right]}\right] $ is the Fourier Transform of the discretized field, $ \rm{\Delta }{\rm{k}}_{{\mathsf{ξ}}} = -\frac{\rm{k}\rm{\lambda }}{\rm{N}\rm{\Delta }{\mathsf{ξ}}}$, $\rm{\Delta }{\rm{k}}_{{\mathsf{η}}} = -\frac{\rm{k}\rm{\lambda }}{\rm{M}\rm{\Delta }{\mathsf{η}}}$, $\rm{\Delta }{\mathsf{ξ}} = \frac{\rm{z}\rm{\lambda }}{\rm{N}\rm{\Delta }\rm{h}}$, $\rm{\Delta }{\mathsf{η}} = \frac{\rm{z}\rm{\lambda }}{\rm{M}\rm{\Delta }\rm{v}}$, $\rm{\Delta }\rm{h} $ and $ \rm{\Delta }\rm{v} $ are the horizontal and vertical pixel dimensions, respectively. All the phase maps were demodulated with the Volkov Method [34].

    The calibration of the setup followed the work of Colomb et al. [24] and was carried out using a quarter-wave plate as a sample. Two-phase maps reconstructed by FTM, one for each polarization, were subtracted to obtain the maps of phase differences in the function of the angle of orientation of the quarter-wave plate. The general expression for the phase difference (Δφ) as a function of the orientation of the quarter-wave, by Eq 12:

    $ \mathrm{\Delta }{\mathsf{ϕ}} = \mathrm{a}\mathrm{r}\mathrm{c}\mathrm{t}\mathrm{a}\mathrm{n}\left[\frac{\mathrm{s}\mathrm{i}\mathrm{n}\left(2{\mathsf{δ}}\right)}{{\mathrm{c}\mathrm{o}\mathrm{s}}^{2}\left(2{\mathsf{δ}}\right)}\right] $ (12)

    The process to obtain the demodulated phase maps for compression and decompression. The area selected (the rectangle on the hologram) of the hologram was processed with the FTM to obtain the frequency spectrum [17]. The chosen area (the rectangle on the frequency spectrum) of the frequency spectrum was obtained from the modulated phase map, and the Volkov method [34] was obtained from the demodulated phase map. The mean phase was determined from the phases of the pixels in the area selected from the demodulated phase map. To reduce the noise, in each phase map, a region of the phase map with no object was chosen, and the mean phase value of this region was subtracted from the phase map [17].

    From the vertical phase maps of each stress applied, the load, $ {\mathsf{σ}}_{\mathrm{i}} $, was calculated in the vertical holographic deformations, $ {{\mathsf{ε}}_{\mathrm{H}}}_{\mathrm{v}-\mathrm{i}} $, in both processes: compression and decompression. In the same way, with the phase values of the horizontal phase maps, the horizontal holographic deformations, $ {{\mathsf{ε}}_{\mathrm{H}}}_{\mathrm{h}-\mathrm{i}} $, were calculated. The mean value $ \langle \mathfrak{E}\rangle $ was calculated from various values $ \mathrm{E} $ by fitting the linear function, by Eq 13:

    $ {\mathsf{σ}}_{\mathrm{i}} = \left\langle{\mathfrak{E}}\right\rangle{\mathsf{ε}_{\mathrm{H}}}_{\mathrm{v}-\mathrm{i}} $ (13)

    The mean value of the Poisson's coefficient, $ \langle {\rm{\nu }}\rangle $, was calculated from various values ν by fitting the linear function, by Eq 14:

    $ {{\mathsf{ε}}_{\mathrm{H}}}_{\mathrm{h}-\mathrm{i}} = \langle {\rm{\nu }}\rangle {{\mathsf{ε}}_{\mathrm{H}}}_{\mathrm{v}-\mathrm{i}} $ (14)

    In both cases, the Least Squares Method [34] was utilized.

    For each horizontal line j, the phase differences, $ {\left({\mathsf{ϕ}}_{\mathrm{v}}-{\mathsf{ϕ}}_{\mathrm{h}}\right)}_{\mathrm{j}} $, were obtained and, from the result, the relative retardation, $ {\mathrm{\aleph }}_{\mathrm{j}} = {\left({\mathsf{ϕ}}_{\mathrm{v}}-{\mathsf{ϕ}}_{\mathrm{h}}\right)}_{\mathrm{j}}/2{\mathsf{π}} $, was calculated between the dark fringes. These results, associated with the holographic parameters $ \left\langle{\mathfrak{E}}\right\rangle $ and$ \langle {\rm{\nu }}\rangle $, allowed us to find the stress differences $ {\left({\mathsf{σ}}_{\mathrm{v}}-{\mathsf{σ}}_{\mathrm{h}}\right)}_{\mathrm{j}-\mathrm{h}\mathrm{o}\mathrm{l}\mathrm{o}\mathrm{g}\mathrm{r}\mathrm{a}\mathrm{p}\mathrm{h}\mathrm{i}\mathrm{c}} $ using Eq 5. The graphic $ {\left({\mathsf{σ}}_{\mathrm{v}}-{\mathsf{σ}}_{\mathrm{h}}\right)}_{\mathrm{j}-\mathrm{h}\mathrm{o}\mathrm{l}\mathrm{o}\mathrm{g}\mathrm{r}\mathrm{a}\mathrm{p}\mathrm{h}\mathrm{i}\mathrm{c}} $ as a function of the number of pixels produced the distributions of stress differences in the selected region.

    A dimensionless constant parameter from Eq 6 gives the relation between holographic and mechanical elasticity. According to Eq 4, using the photoelastic images, mechanical parameters, $ \left\langle{\mathrm{E}}\right\rangle $ and$ \langle {\rm{\nu }}\rangle $, and the thicknesses, e, it is possible to calculate the photoelastic fringes, $ {\mathrm{f}}_{\mathsf{σ}} $, and the photoelastic dispersions, $ {\rm{C}} \left({\mathsf{λ}}\right) $. Using Eq 8, the holographic parameters, $ \mathrm{E} $ and ν, the thickness e, and the constant a, the holographic fringes, , can be calculated using the phase maps. Using Eq 7 and the wavelength, $ {\mathsf{λ}} $, the holographic dispersion, $ \mathrm{H}\left({\mathsf{λ}}\right) $, can be calculated.

    The mechanical parameters were measured with samples sized 4.15, 2.25, and 1.03 cm, and the stress distribution was tested in samples sized 4.15, 2.25, and 4.90 cm, both in holography and photoelasticity.

    Each technique was applied to only one block from each pair of standard blocks, which were prepared with identical flexibilities and labeled as −F low flexibility and +F high flexibility. Stresses were applied to the top surface of the sample blocks via a loading device, as illustrated in Figure 1.

    The modified Mach-Zehnder interferometer apparatus was built with a He-Ne laser (632.8 nm CW, 20 mW, model 1135PUniphase). The photoelastic images and hologram registers were captured with a Thorlabs digital camera, model DCC1240C-HQ color, CMOS sensor, 1280 × 1024 pixels, size pixel 5.3 μm (square).

    The calibration process of the holographic system generated an experimental distribution that, when compared to a theoretical curve, Figure 3, showed the reliability of the system [24].

    Figure 3.  Graphic of the phase differences versus the angle of orientation. Theoretical curve () and the experimental distribution ().

    The continuous line represents the theoretical curve, Eq 12, and the circles of the experimental distribution. The distribution of the point around the curve indicates that the adjustment of the polarization of waves is correct.

    Two sets of holograms were recorded for each sample for compression and decompression. The stresses, applied to the upper central phase of the sample, ranged from 0.3 to 1.5 MPa. In holography, the mean phases were obtained from the statistics of ten selected areas in each demodulated phase map. The final mean was calculated using the values of compression and decompression.

    The photoelasticity RGB method, in transmission mode, was associated with the finite elements method to determine the distributions of the stress differences in the same selected regions as those used with the holographic method. These results were used to evaluate the proposed method by comparing holography and photoelasticity by stress-optic and stress-holographic law, given by Eqs 1 and 9, respectively.

    All the fitted functions used the least square method [27]. A third-degree polynomial function was fitted to the points, but all the results showed that they were linear functions.

    Figure 4 presents the graphics of the experimental values of the $ {\mathsf{σ}} $ versus $ {\mathsf{ε}}_{\mathrm{v}} $ for the +F sample under compression and decompression. This graphic is used to determine the mechanical and holographic modulus of elasticity.

    Figure 4.  Graphics of external mean stress versus longitudinal mean deformation in the photoelasticity: compression and decompression.

    Figure 5 presents the graphics of the experimental values of $ {\mathsf{σ}} $ versus $ {{\mathsf{ε}}_{\mathrm{H}}}_{\mathrm{v}} $ for the +F samples under compression and decompression, and they are used to obtain the Holographic and Mechanical modulus of elasticity.

    Figure 5.  Graphics of external mean stress versus longitudinal relative phase mean in the holography: compression and decompression.

    Similar graphs were made for the −F samples. Table 1 summarizes the holographic and mechanical modules of elasticity. The values are similar for the samples with different flexibilities in analysis. However, the rate $ \mathfrak{E}/\mathrm{E} $ differed for each method (holographic and mechanical). Considering the uncertainties, the values of $ \langle \mathfrak{E}/\mathrm{E}\rangle $ are practically equal for all samples in both flexibilities.

    Table 1.  Holographic and mechanical modules of elasticity in the –F and +F samples.
    −F sample (modulus of elasticity) +F sample (modulus of elasticity)
    Holography (MPa) 1.589 ± 0.032 1.320 ± 0.024
    Mechanical elasticity (10 MPa) 3.35 ± 0.16 2.86 ± 0.11
    $ \langle \mathrm{a}\rangle =\left\langle{\mathfrak{E}/\mathrm{E}}\right\rangle\left({10}^{-2}\right) $ 4.75 ± 0.26 4.62 ± 0.20

     | Show Table
    DownLoad: CSV

    It was verified, in all graphics, using polynomials up to the third degree, that the best-fit function was a first-degree polynomial, related function, agreeing with Robert Hooke's theory of elasticity for the elastic regime.

    Figure 6 presents the values of the $ {\mathsf{ε}}_{\mathrm{h}}\left(\mathrm{t}\mathrm{r}\mathrm{a}\mathrm{n}\mathrm{s}\mathrm{v}\mathrm{e}\mathrm{r}\mathrm{s}\mathrm{e}\right) $ versus $ {\mathsf{ε}}_{\mathrm{v}} $ (longitudinal), used to calculate the mechanical Poisson's coefficient under the compression and decompression processes, using samples +F.

    Figure 6.  Graphics of transverse versus longitudinal deformation in a photoelasticity: compression and decompression.

    Figure 7 presents the values of the $ {{\mathsf{ε}}_{\mathrm{H}}}_{\mathrm{h}}\left(\mathrm{t}\mathrm{r}\mathrm{a}\mathrm{n}\mathrm{s}\mathrm{v}\mathrm{e}\mathrm{r}\mathrm{s}\mathrm{e}\right) $versus $ {{\mathsf{ε}}_{\mathrm{H}}}_{\mathrm{v}}\left(\mathrm{l}\mathrm{o}\mathrm{n}\mathrm{g}\mathrm{i}\mathrm{t}\mathrm{u}\mathrm{d}\mathrm{i}\mathrm{n}\mathrm{a}\mathrm{l}\right) $ used to determine the holographic Poisson's coefficient under the compression and decompression processes, using samples +F to determine the stress distribution.

    Figure 7.  Graphics of transverse relative phase mean versus longitudinal relative phase mean in holography: compression and decompression.

    Similar graphs were made for the −F samples. Table 2 summarizes the Poisson's coefficients: holographic and mechanical. Considering the uncertainties, the Poisson's coefficients ν are practically equal for the sample with the same flexibility.

    Table 2.  Holographic and mechanical Poisson's coefficients in the –F and +F samples.
    −F sample [Poisson's coefficient (10−1)] +F sample [Poisson's coefficient (10−1)]
    Holography 3.723 ± 0.022 3.735 ± 0.025
    Mechanical elasticity 3.822 ± 0.095 3.90 ± 0.11

     | Show Table
    DownLoad: CSV

    With these parameters, it was possible to determine the mean stress-optical coefficients in photoelasticity and holography, whose values ​​are presented in Table 3.

    Table 3.  Holographic and photoelastic stress-optical coefficients –F and +F samples.
    −F sample [stress-optical coefficient
    (10−12 m2/N)]
    +F sample [stress-optical coefficient
    (10−12 m2/N)]
    Holography 3.921 ± 0.08 4.442 ± 0.09
    Mechanical elasticity 3.95 ± 0.21 4.50 ± 0.22

     | Show Table
    DownLoad: CSV

    The difference between the values of the samples with the same flexibility is due to the dependence of the stress-optical coefficient with sample thickness, e. However, for the same flexibility, the values ​​agree both in holography and in photoelasticity. An important observation is that in holography, the precision of the results is better since the values are of the order of 10−6 N/m2.

    The graphics in Figure 8 show the distribution of stress difference over the vertical lines between two dark fringes obtained using the holographic method (), photoelasticity RGB ($ + $), and analytical method (). The load, in mass, applied was 600 g for all samples.

    Figure 8.  Graphics of the distribution of stress difference as a function of the distance between two dark fringes obtained by holography (), photoelasticity RGB (+), and analytical ().

    The behavior of curves in graphics exhibits similarities, indicating that the theoretical model of the proposed method is correct. The +F samples are less rigid and suffer more significant vertical deformation, reducing the modulus of elasticity under the same load. This behavior is observed graphically due to the smaller and more scattered peaks about the −F sample distribution.

    In photoelasticity, the intensity of the images of the fringes pattern depends on the characteristics of the experimental configuration: transmittance of the materials, anisotropic behavior level, spectral radiation distribution of the light source (white light), the conversion factor of the light-signal control and electric-signal control, and the temporary birefringence effect. In digital holography, these effects are less relevant due to the subtractions performed in the numerical reconstruction process, which eliminate much of this noise, and also due to the optical retardations obtained directly from the phase differences maps.

    We present an alternative method to obtain the stress differences in photoelastic materials, as verified by the experiments. The similar results for the modulus of elasticity obtained through the different methods (photoelasticity, mechanical, and holographical) allowed the assumption of an analogy between Hooke's law and holography. The photoelastic and holographic dispersions are equal, allowing the establishment of the stress-holographic law in analogy with the stress-optic law. The experimental stress distributions in holography presented the same behavior as the analytic and photoelastic distributions. The results of stress distributions in holography were more accurate than in photoelasticity when compared to the theoretical results. Thus, the proposed method presents efficiency and independence in procedures since it uses only the extracted parameters obtained directly from the phase maps.

    The authors declare they have not used Artificial Intelligence (AI) tools in the creation of this article.

    The authors are grateful for the financial support from Fundação de Amparo à Pesquisa do Estado de São Paulo (2012/18162-4, 2019/23700-4, 2022/15276-0); the physical support from Faculdade de Tecnologia de Pompeia (Fatec Pompeia), Faculdade de Tecnologia de Itaquera (Fatec Itaquera), Instituto de Física da Universidade de São Paulo (IFUSP) and Instituto de Pesquisas Energéticas e Nucleares de São Paulo (IPEN-SP).

    The lead author (Sidney Leal da Silva) contributed theory, data, and analysis from his doctoral work [17]. The other co-authors helped with the preparation and first revisions of the article.

    The authors declare no conflict of interest.


    Conflict of interest


    All authors declare no conflicts of interest in this paper.

    [1] Dawson TM, Snyder SH (1994) Gases as biological messengers: nitric oxide and carbon monoxide in the brain. J Neurosci 14: 5147–5159. doi: 10.1523/JNEUROSCI.14-09-05147.1994
    [2] Moncada S, Higgs EA (1991) Endogenous nitric oxide: physiology, pathology and clinical relevance. Eur J Clin Invest 21: 361–374. doi: 10.1111/j.1365-2362.1991.tb01383.x
    [3] Philippu A (2016) Nitric Oxide: A universal modulator of brain function. Curr Med Chem 23: 2643–2652. doi: 10.2174/0929867323666160627120408
    [4] Garthwaite J (2019) NO as a multimodal transmitter in the brain: discovery and current status. Br J Pharmacol 176: 197–211. doi: 10.1111/bph.14532
    [5] Ignarro LJ (1990) Nitric oxide. A novel signal transduction mechanism for transcellular communication. Hypertension 16: 477–483.
    [6] Möller MN, Cuevasanta E, Orrico F, et al. (2019) Diffusion and transport of reactive species across cell membranes. Adv Exp Med Biol 1127: 3–19. doi: 10.1007/978-3-030-11488-6_1
    [7] Li H, Förstermann U (2000) Nitric oxide in the pathogenesis of vascular disease. J Pathol 190: 244–254. doi: 10.1002/(SICI)1096-9896(200002)190:3<244::AID-PATH575>3.0.CO;2-8
    [8] Prast H, Philippu A (2001) Nitric oxide as a modulator of neuronal function. Prog Neurobiol 64: 51–68. doi: 10.1016/S0301-0082(00)00044-7
    [9] Mukherjee P, Cinelli MA, Kang S, et al. (2014) Development of nitric oxide synthase inhibitors for neurodegeneration and neuropathic pain. Chem Soc Rev 43: 6814–6838. doi: 10.1039/C3CS60467E
    [10] Capannolo M, Ciccarelli C, Molteni R, et al. (2014) Nitric oxide synthase inhibition reverts muscarinic receptor down-regulation induced by pilocarpine- and kainic acid-evoked seizures in rat fronto-parietal cortex. Epilepsy Res 108: 11–19. doi: 10.1016/j.eplepsyres.2013.10.011
    [11] Watanabe S, Kumazaki S, Yamamoto S, et al. (2018) Non-alcoholic steatohepatitis aggravates nitric oxide synthase inhibition-induced arteriosclerosis in SHRSP5/Dmcr rat model. Int J Exp Pathol 99: 282–294. doi: 10.1111/iep.12301
    [12] Woodard A, Barbery B, Wilkinson R, et al. (2019) The role of neuronal nitric oxide and its pathways in the protection and recovery from neurotoxin-induced de novo hypokinetic motor behaviors in the embryonic zebrafish (Danio rerio). AIMS Neuroscience 6: 25–42. doi: 10.3934/Neuroscience.2019.1.25
    [13] Bredt DS, Snyder SH (1994) Nitric oxide: A physiologic messenger molecule. Annu Rev Biochem 63: 175–195. doi: 10.1146/annurev.bi.63.070194.001135
    [14] Sorokin A (2016) Nitric oxide synthase and cyclooxygenase pathways: A complex interplay in cellular signaling. Curr Med Chem 23: 2559–2578. doi: 10.2174/0929867323666160729105312
    [15] Balke JE, Zhang L, Percival JM (2019) Neuronal nitric oxide synthase (nNOS) splice variant function: Insights into nitric oxide signaling from skeletal muscle. Nitric Oxide 82: 35–47. doi: 10.1016/j.niox.2018.11.004
    [16] Teixeira-Gomes A, Costa VM, Feio-Azevedo R, et al. (2015) The neurotoxicity of amphetamines during the adolescent period. Int J Dev Neurosci 41: 44–62. doi: 10.1016/j.ijdevneu.2014.12.001
    [17] Jones SR, Joseph JD, Barak LS, et al. (1999) Dopamine neuronal transport kinetics and effects of amphetamine. J Neurochem 73: 2406–2414.
    [18] Gibb JW, Johnson M, Hanson GR (1990) Neurochemical basis of neurotoxicity. Neurotoxicol 11: 317–321.
    [19] Sulzer D, Rayport S (1990) Amphetamine and other psychostimulants reduce pH gradients in midbrain dopaminergic neurons and chromaffin granules: a mechanism of action. Neuron 5: 797–808. doi: 10.1016/0896-6273(90)90339-H
    [20] Siciliano CA, Calipari ES, Ferris MJ, et al. (2014) Biphasic mechanisms of amphetamine action at the dopamine terminal. J Neurosci 34: 5575–5582. doi: 10.1523/JNEUROSCI.4050-13.2014
    [21] O'Dell SJ, Weihmuller FB, Marshall JF (1991) Multiple methamphetamine injections induce marked increases in extracellular striatal dopamine which correlate with subsequent neurotoxicity. Brain Res 564: 256–260. doi: 10.1016/0006-8993(91)91461-9
    [22] Nash JF, Yamamoto BK (1993) Effect of D-amphetamine on the extracellular concentrations of glutamate and dopamine in iprindole-treated rats. Brain Res 627: 1–8. doi: 10.1016/0006-8993(93)90741-5
    [23] Hussain RJ, Taraschenko OD, Glick SD (2008) Effects of nicotine, methamphetamine and cocaine on extracellular levels of acetylcholine in the interpeduncular nucleus of rats. Neurosci Lett 440: 270–274. doi: 10.1016/j.neulet.2008.06.001
    [24] Mabrouk OS, Semaan DZ, Mikelman S, et al. (2014) Amphetamine stimulates movement through thalamocortical glutamate release. J Neurochem 128: 152–161. doi: 10.1111/jnc.12378
    [25] Abekawa T, Ohmori T, Honda M, et al. (2001) Effect of low doses of L-NAME on methamphetamine-induced dopaminergic depletion in the rat striatum. J Neural Transm 108: 1219–1230. doi: 10.1007/s007020100000
    [26] Pereira FC, Macedo TR, Imam SZ, et al. (2004) Lack of hydroxyl radical generation upon central administration of methamphetamine in rat caudate nucleus: A microdialysis study. Neurotox Res 6: 149–152. doi: 10.1007/BF03033217
    [27] Shenouda SK, Varner KJ, Carvalho F, et al. (2009) Metabolites of MDMA induce oxidative stress and contractile dysfunction in adult rat left ventricular myocytes. Cardiovasc Toxicol 9: 30–38. doi: 10.1007/s12012-009-9034-6
    [28] Salum C, Schmidt F, Michel PP, et al. (2016) Signaling mechanisms in the Nitric Oxide donor-and amphetamine-induced dopamine release in mesencephalic primary cultured neurons. Neurotox Res 29: 92–104. doi: 10.1007/s12640-015-9562-8
    [29] Acikgoz O, Gonenc S, Kayatekin BM, et al. (2000) The effects of single dose of methamphetamine on lipid peroxidation levels in the rat striatum and prefrontal cortex. Eur Neuropsychopharmacol 10: 415–418. doi: 10.1016/S0924-977X(00)00103-6
    [30] Wan FJ, Lin HC, Huang KL, et al. (2000) Systemic administration of d-amphetamine induces long-lasting oxidative stress in the rat striatum. Life Sci 66: 205–212. doi: 10.1016/S0024-3205(00)00458-6
    [31] Raevskii KS, Bashkatova VG, Narkevich VB, et al. (1998) Nitric oxide in the rat cerebral cortex in seizure models: potential ways of pharmacological modulation. Ross Fiziol Zh Im I M Sechenova 84: 1093–1099.
    [32] Bashkatova VG, Vitskova GIu, Narkevich VB, et al. (1999) The effect of anticonvulsants on the nitric oxide content and level of lipid peroxidation in the brain of rats in model seizure states. Eksp Klin Farmakol 62: 11–14.
    [33] Fadiukova OE, Alekseev AA, Bashkatova VG, et al. (2001) Semax prevents elevation of nitric oxide generation caused by incomplete global ischemia in the rat brain. Eksp Klin Farmakol 64: 31–34.
    [34] Zheng Y, Laverty R (1998) Role of brain nitric oxide in (+/−)3,4-methylenedioxymethamphetamine (MDMA)-induced neurotoxicity in rats. Brain Res 795: 257–263. doi: 10.1016/S0006-8993(98)00313-8
    [35] Itzhak Y, Martin JL, Ail SF (2000) nNOS inhibitors attenuate methamphetamine-induced dopaminergic neurotoxicity but not hyperthermia in mice. Neuroreport 11: 2943–2946. doi: 10.1097/00001756-200009110-00022
    [36] Liu YP, Tung CS, Lin PJ, et al. (2011) Role of nitric oxide in amphetamine-induced sensitization of schedule-induced polydipsic rats. Psychopharmacology (Berl) 218: 599–608. doi: 10.1007/s00213-011-2354-9
    [37] Morales-Medina JC, Mejorada A, Romero-Curiel A, et al. (2008) Neonatal administration of N-omega-nitro-L-arginine induces permanent decrease in NO levels and hyperresponsiveness to locomotor activity by D-amphetamine in postpubertal rats. Neuropharmacology 55: 1313–1320. doi: 10.1016/j.neuropharm.2008.08.019
    [38] De Silva DJ, French SJ, Cheung NY, et al. (2005) Rat brain serotonin neurones that express neuronal nitric oxide synthase have increased sensitivity to the substituted amphetamine serotonin toxins 3,4-methylenedioxymethamphetamine and p-chloroamphetamine. Neuroscience 134: 1363–1375. doi: 10.1016/j.neuroscience.2005.05.016
    [39] Wang JQ, Lau YS (2001) Dose-related alteration in nitric oxide synthase mRNA expression induced by amphetamine and the full D1 dopamine receptor agonist SKF-82958 in mouse striatum. Neurosci Lett 311: 5–8. doi: 10.1016/S0304-3940(01)02128-0
    [40] Tocharus J, Chongthammakun S, Govitrapong P (2008) Melatonin inhibits amphetamine-induced nitric oxide synthase mRNA overexpression in microglial cell lines. Neurosci Lett 439: 134–137. doi: 10.1016/j.neulet.2008.05.036
    [41] Kleschyov AL, Sedov KR, Mordvintcev PI, et al. (1994) Biotransformation of sodium nitroprusside into dinitrosyl iron complexes in tissue of ascites tumors of mice. Biochem Biophys Res Commun 202: 168–173. doi: 10.1006/bbrc.1994.1908
    [42] Vanin AF, Huisman A, van Faassen EE (2002) Iron dithiocarbamate as spin trap for nitric oxide detection: pitfalls and successes. Methods Enzymol 359: 27–42. doi: 10.1016/S0076-6879(02)59169-2
    [43] Hogg N (2010) Detection of nitric oxide by electron paramagnetic resonance spectroscopy. Free Radic Biol Med 49: 122–129. doi: 10.1016/j.freeradbiomed.2010.03.009
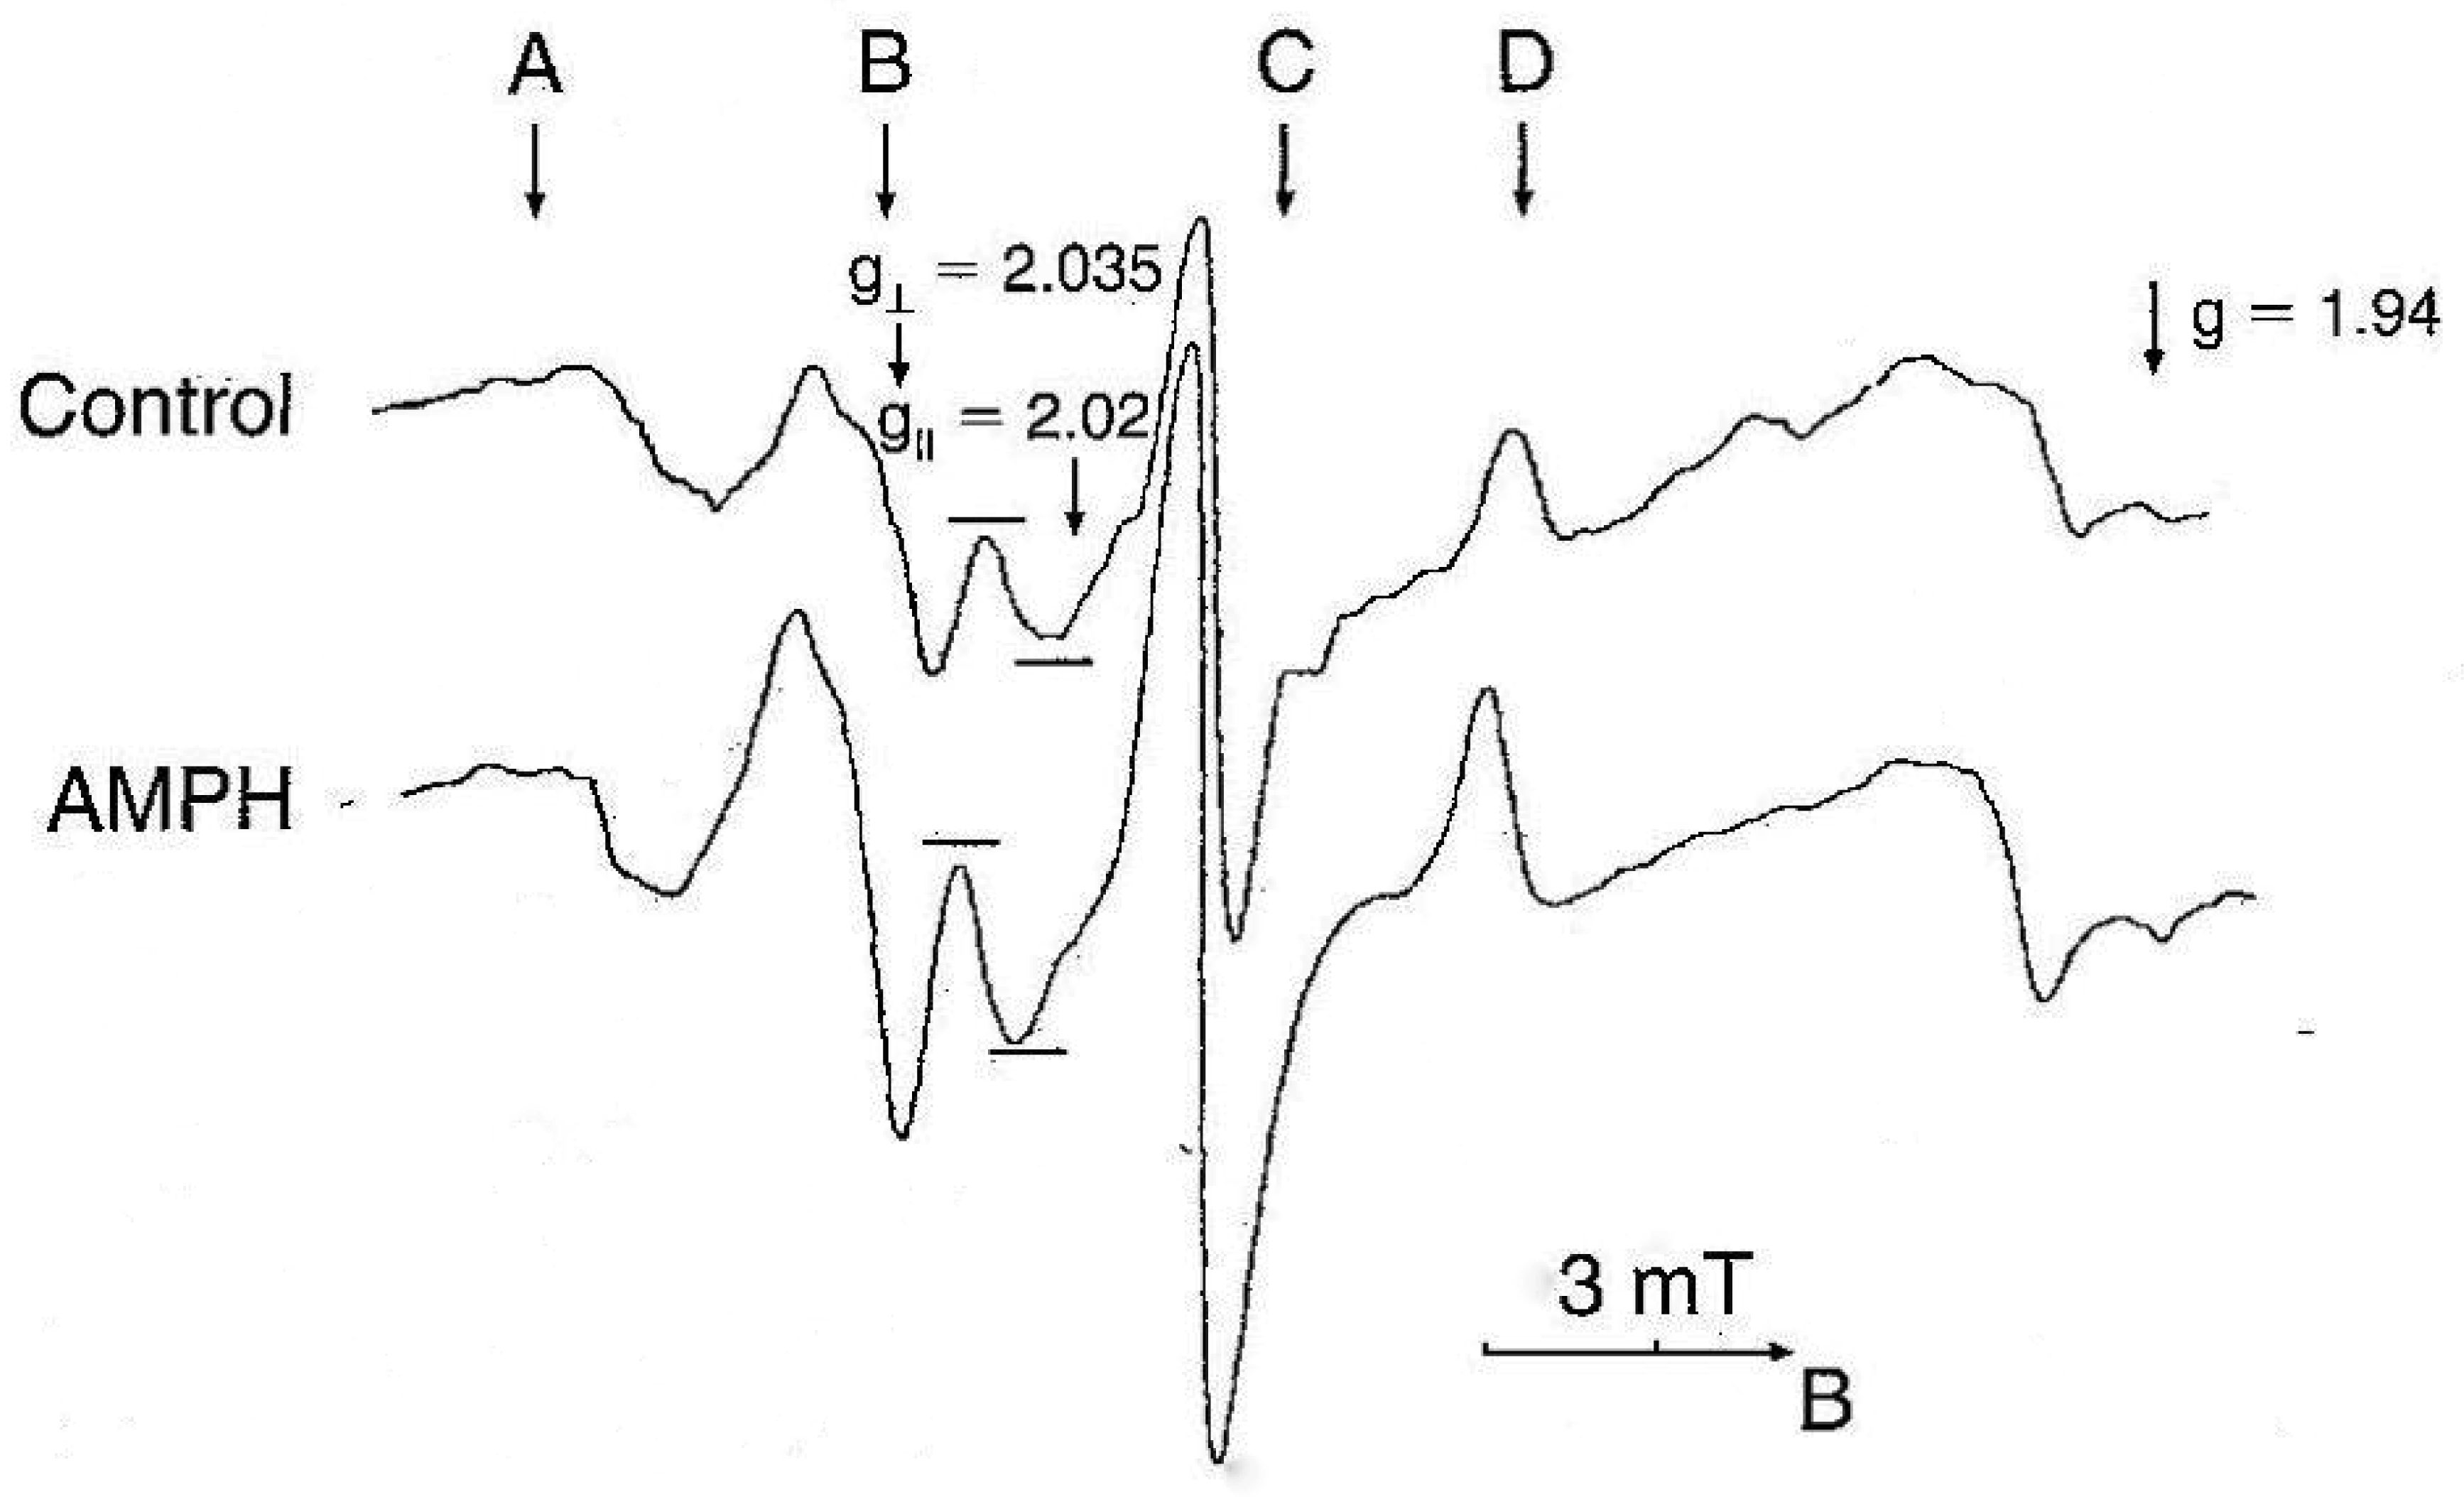
    [44] Bashkatova VG, Mikoian VD, Kosacheva ES, et al. (1996) Direct determination of nitric oxide in rat brain during various types of seizures using ESR. Dokl Akad Nauk 348: 119–121.
    [45] 
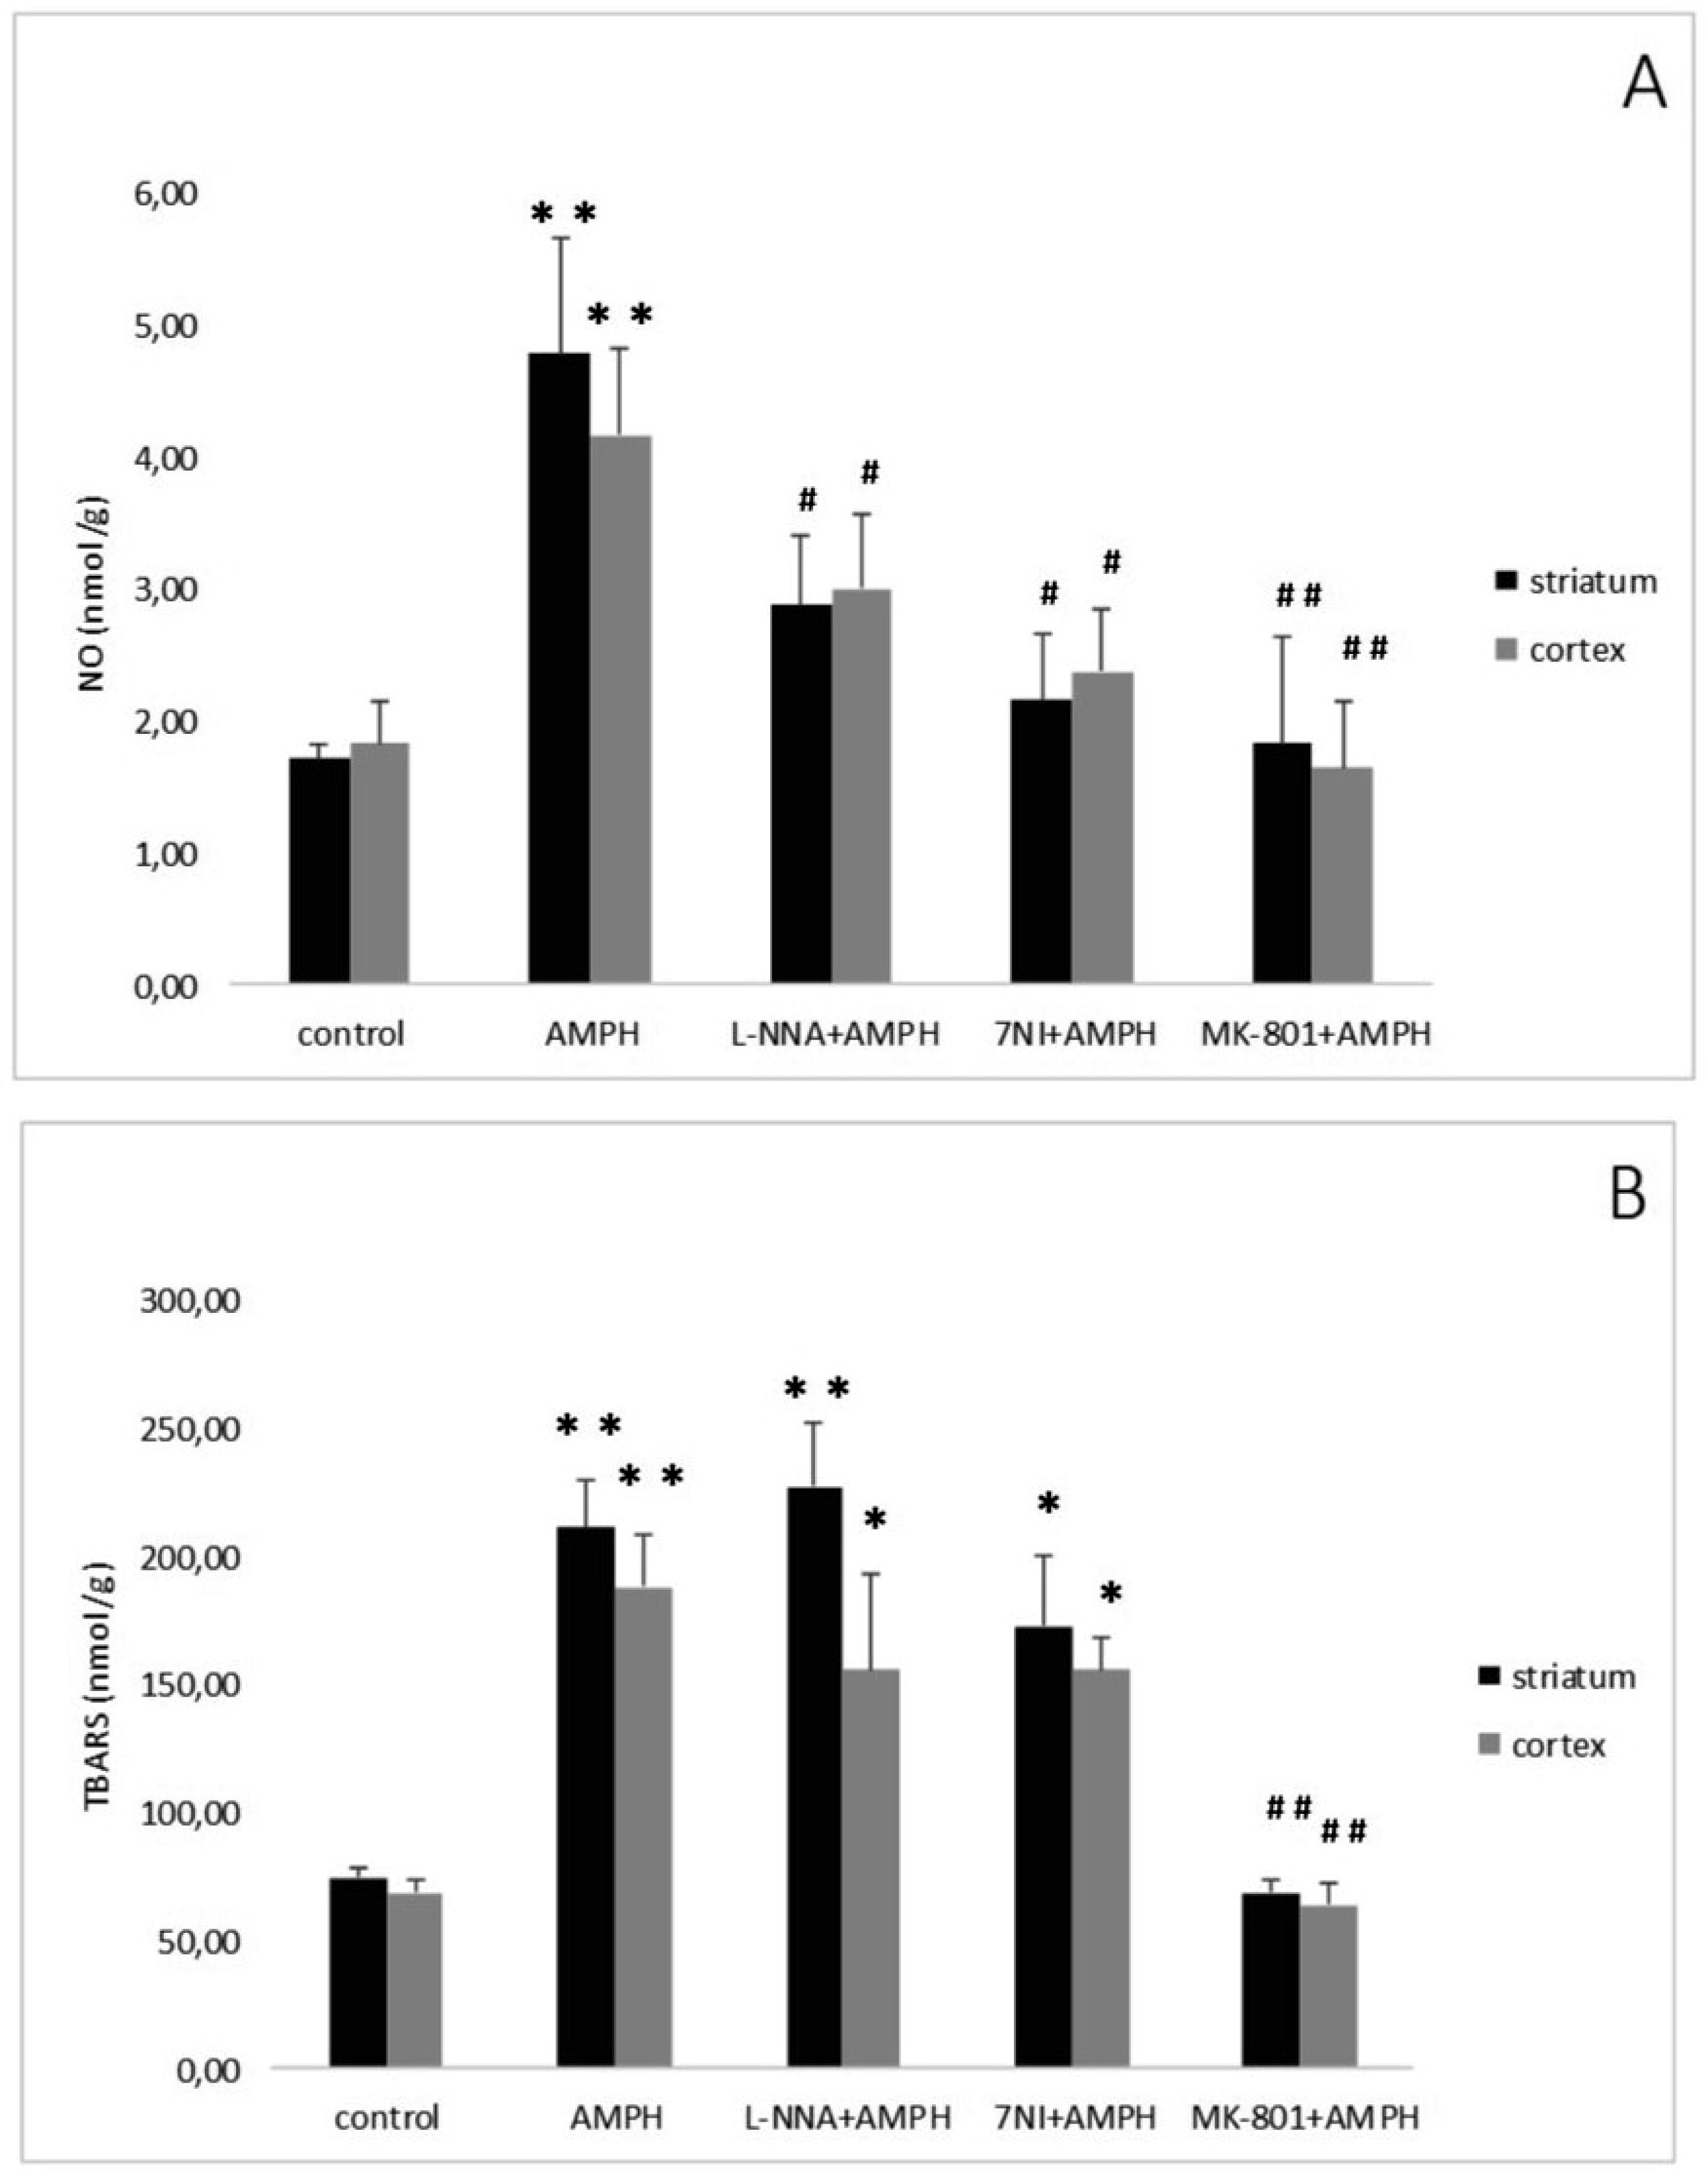
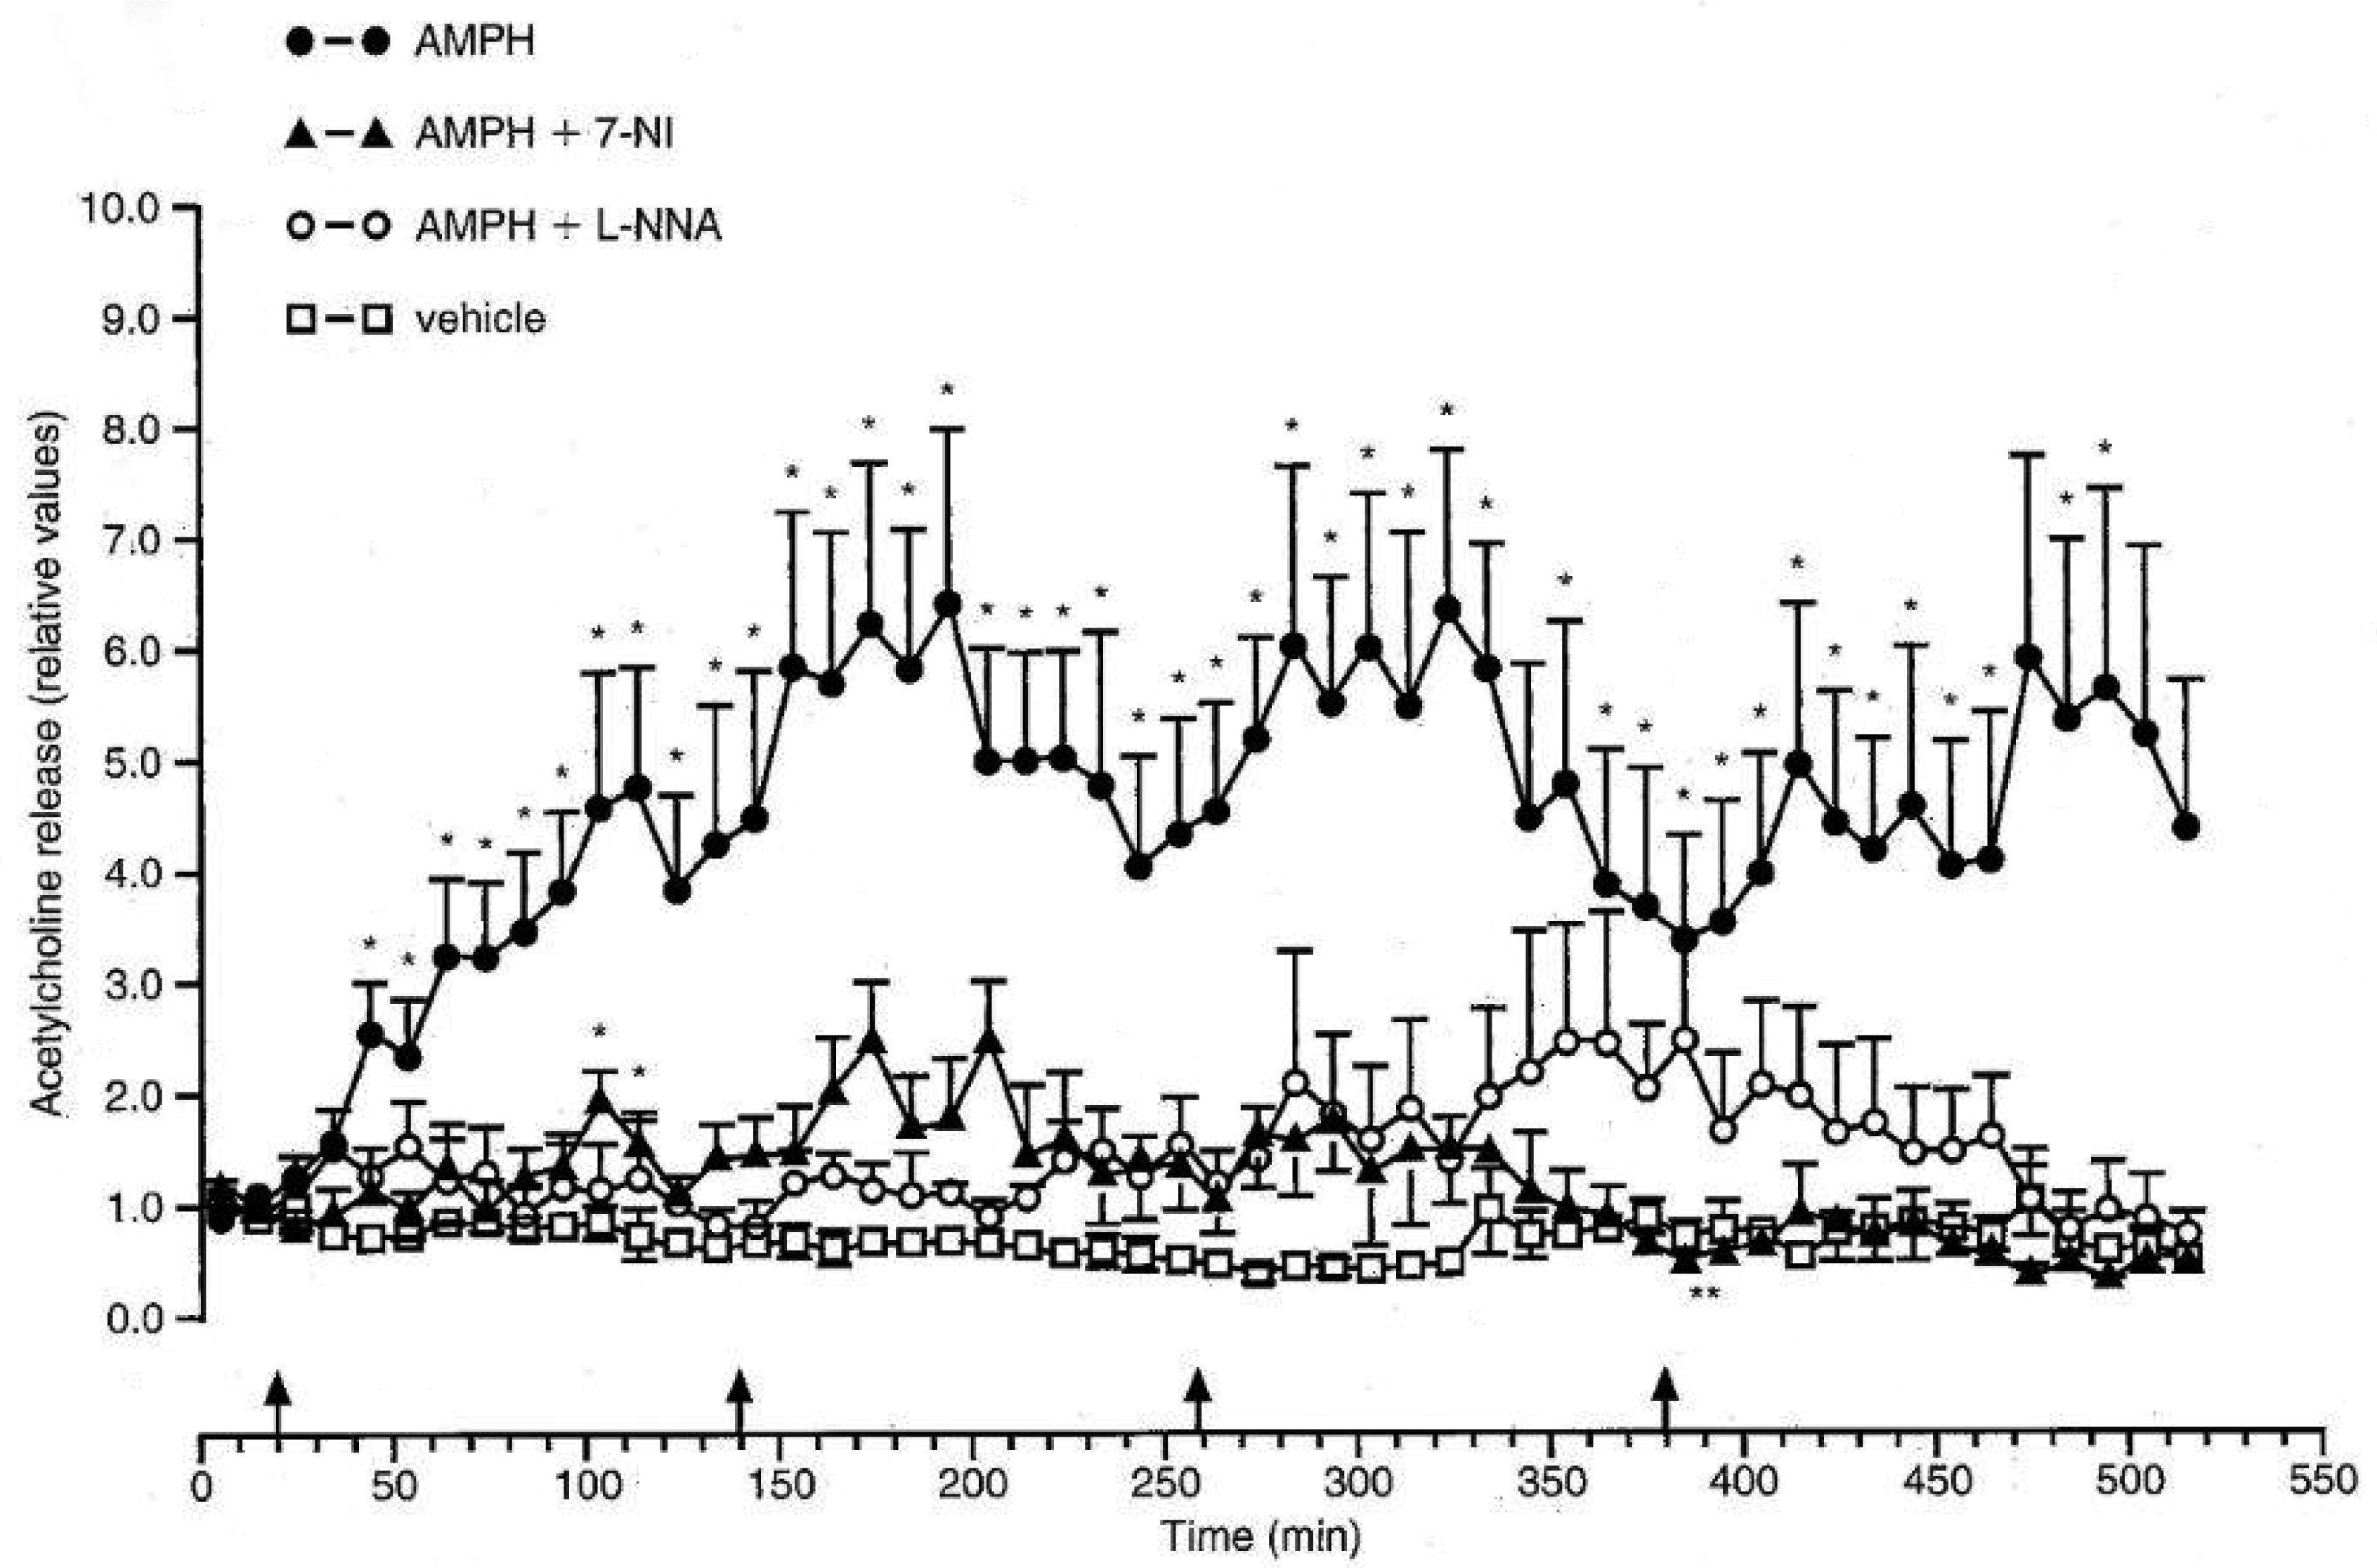
Bashkatova V, Kraus M, Prast H, et al. (1999) Influence of NOS inhibitors on changes in ACH release and NO level in the brain elicited by amphetamine neurotoxicity. Neuroreport 10: 3155–3158. doi: 10.1097/00001756-199910190-00006
    [46] Bashkatova V, Kraus MM, Vanin A, et al. (2005) 7-Nitroindazole, nNOS inhibitor, attenuates amphetamine-induced amino acid release and nitric oxide generation but not lipid peroxidation in the rat brain. J Neural Transm 112: 779–788. doi: 10.1007/s00702-004-0224-x
    [47] 
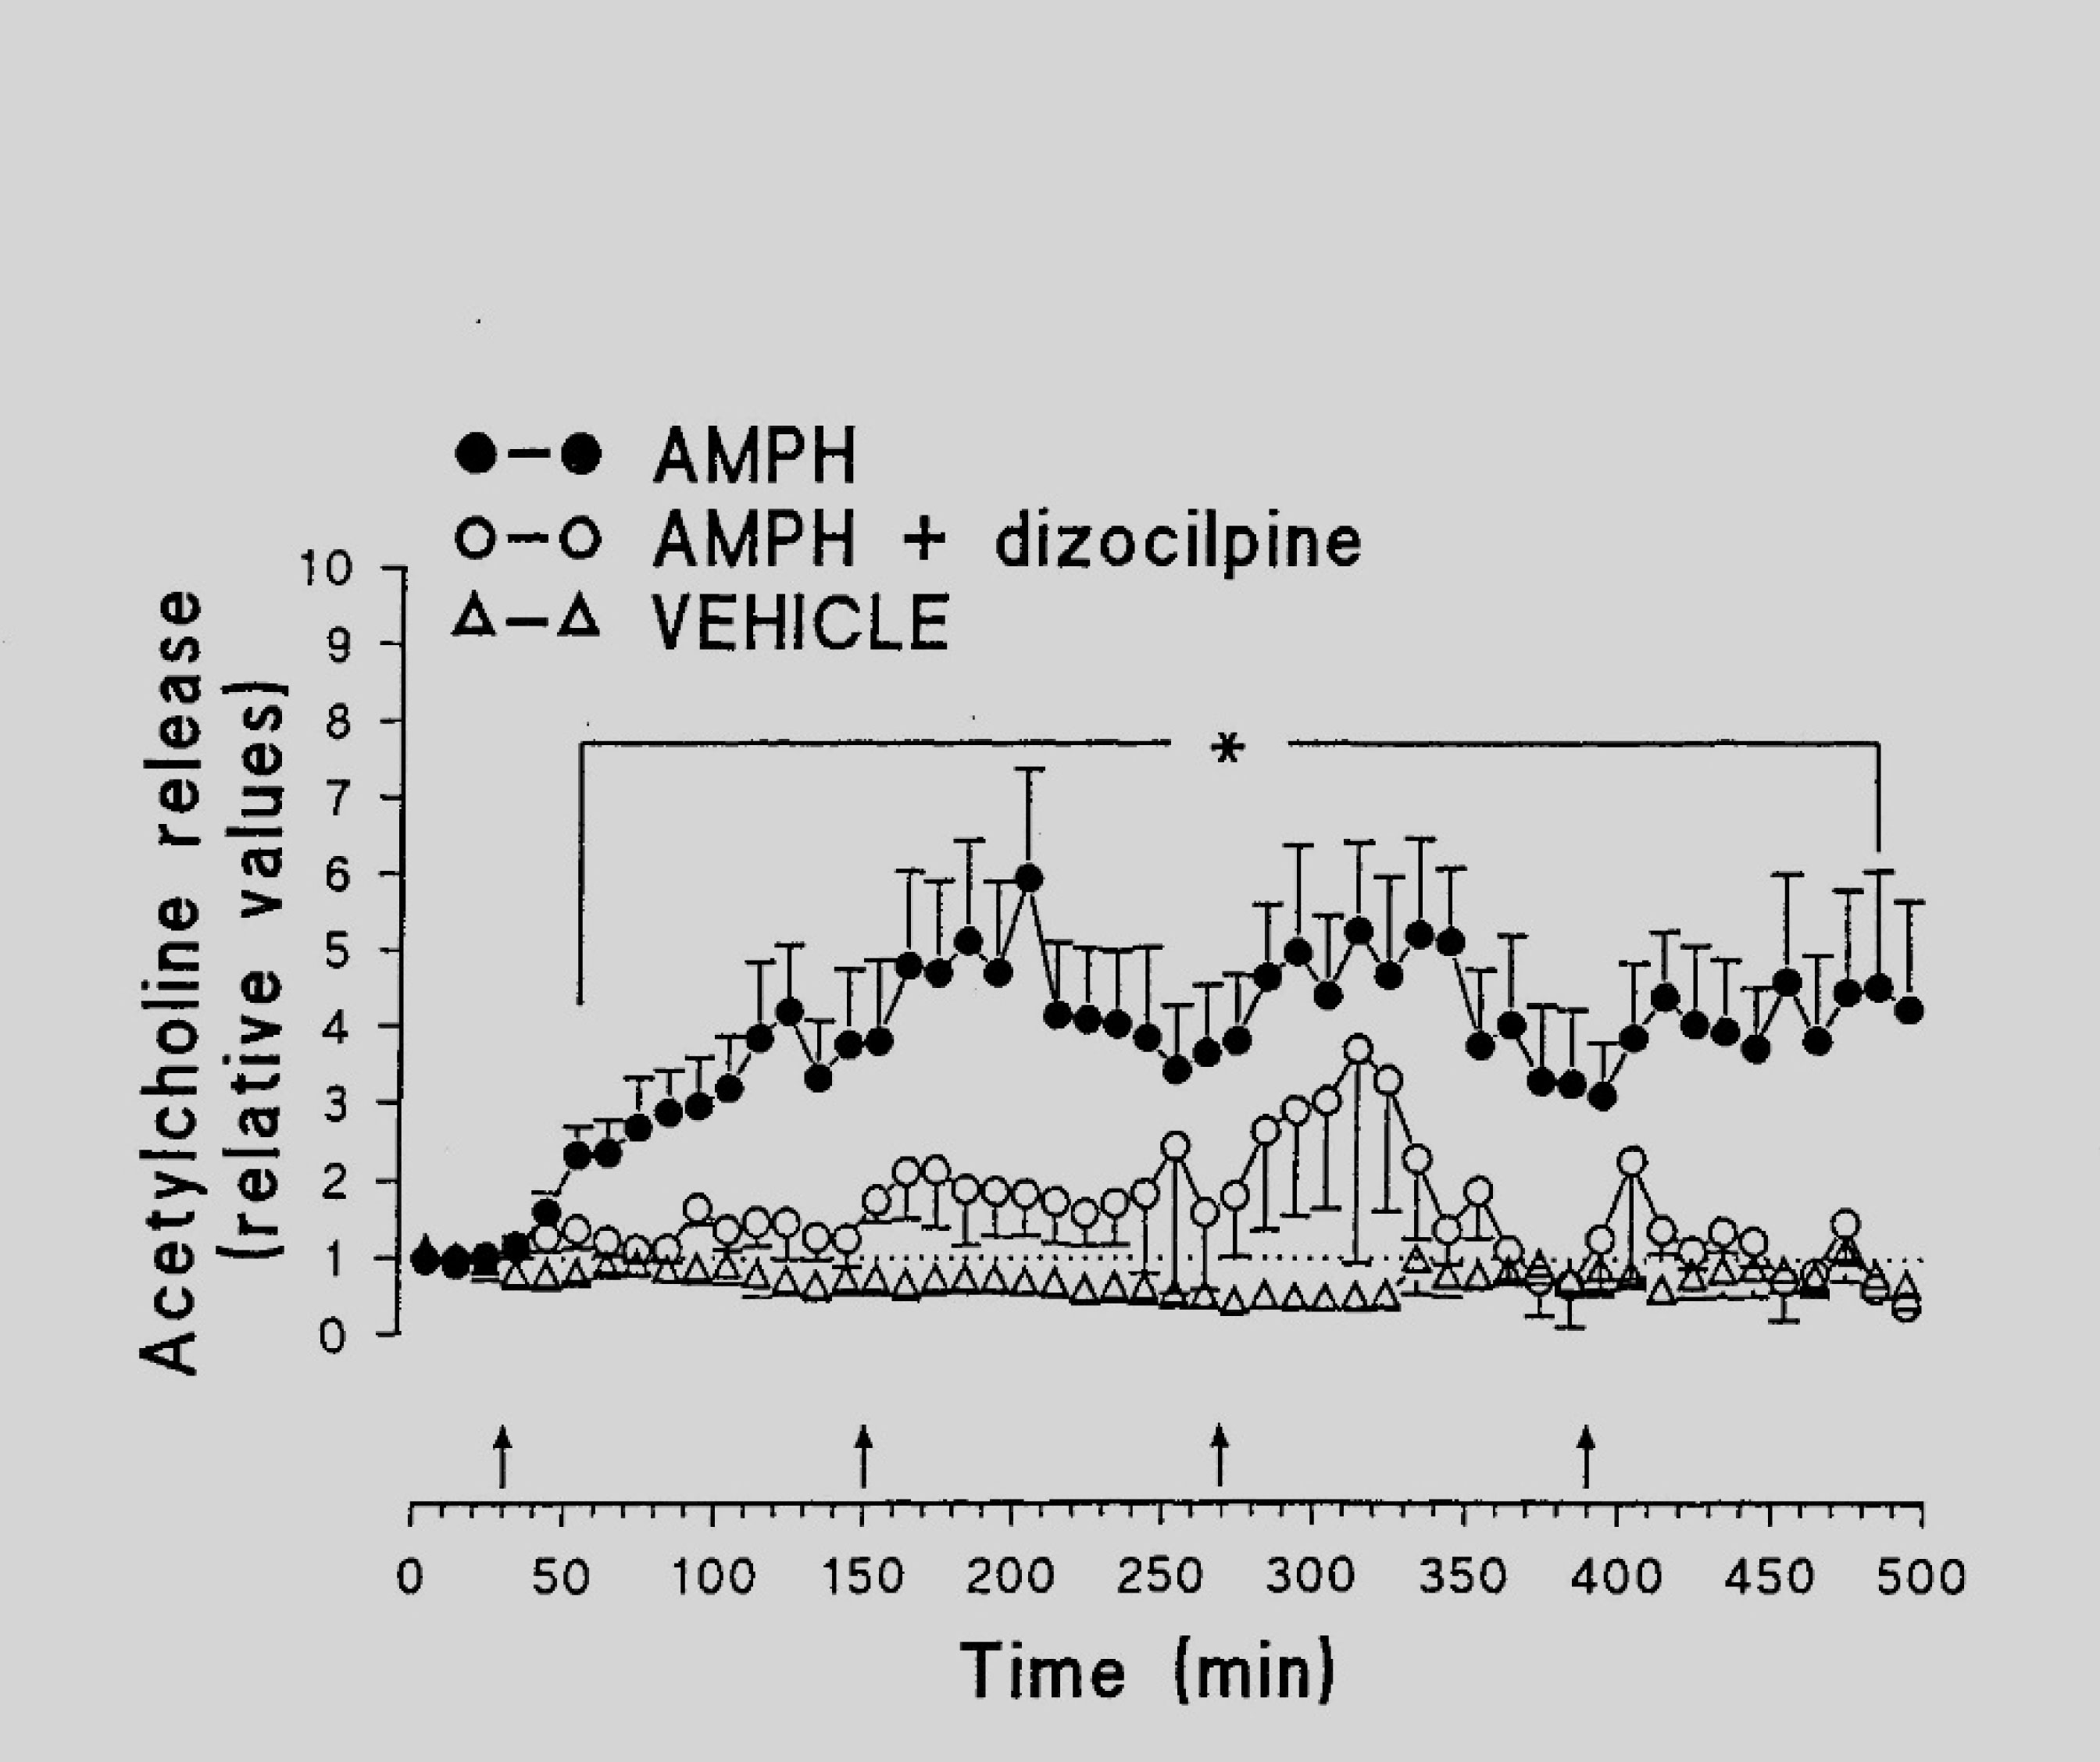
Kraus MM, Bashkatova V, Vanin A, et al. (2002) Dizocilpine inhibits amphetamine-induced formation of nitric oxide and amphetamine-induced release of amino acids and acetylcholine in the rat brain. Neurochem Res 27: 229–235. doi: 10.1023/A:1014836621717
    [48] Wan FJ, Tung CS, Shiah IS, et al. (2006) Effects of alpha-phenyl-N-tert-butyl nitrone and N- acetylcysteine on hydroxyl radical formation and dopamine depletion in the rat striatum produced by d-amphetamine. Eur Neuropsychopharmacol 16: 147–153. doi: 10.1016/j.euroneuro.2005.07.002
    [49] Kita T, Miyazaki I, Asanuma M, et al. (2009) Dopamine-induced behavioral changes and oxidative stress in methamphetamine-induced neurotoxicity. Int Rev Neurobiol 88: 43–64. doi: 10.1016/S0074-7742(09)88003-3
    [50] Dawson TM, Dawson VL, Snyder SH (1994) Molecular mechanisms of nitric oxide actions in the brain. Ann N Y Acad Sci 738: 76–85.
    [51] Li J, Baud O, Vartanian T, et al. (2005) Peroxynitrite generated by inducible nitric oxide synthase and NADPH oxidase mediates microglial toxicity to oligodendrocytes. Proc Natl Acad Sci U S A 102: 9936–9941. doi: 10.1073/pnas.0502552102
    [52] Ali SF, Imam SZ, Itzhak Y (2005) Role of peroxynitrite in methamphetamine-induced dopaminergic neurodegeneration and neuroprotection by antioxidants and selective NOS inhibitors. Ann N Y Acad Sci 1053: 97–98. doi: 10.1196/annals.1344.053
    [53] Ohkawa H, Ohishi N, Yagi K (1979) Assay for lipid peroxides in animal tissues by thiobarbituric acid reaction. Anal Biochem 95: 351–358. doi: 10.1016/0003-2697(79)90738-3
    [54] Bashkatova V, Vitskova G, Narkevich V, et al. (2000) Nitric oxide content measured by ESR-spectroscopy in the rat brain is increased during pentylenetetrazole-induced seizures. J Mol Neurosci 14: 183–190. doi: 10.1385/JMN:14:3:183
    [55] Klyueva YYu, Chepurnov SA, Chepurnova NE, et al. (2001) Role of nitric oxide and lipid peroxidation in mechanisms of febrile convulsions in wistar rat pups. Bull Exp Biol Med 131: 47–49. doi: 10.1023/A:1017530612936
    [56] Prast H, Fischer H, Werner E, et al. (1995) Nitric oxide modulates the release of acetylcholine in the ventral striatum of the freely moving rat. Naunyn-Schmiedebergґs Arch Pharmacol 352: 67–73.
    [57] Issy AC, Dos-Santos-Pereira M, Pedrazzi JFC, et al. (2018) The role of striatum and prefrontal cortex in the prevention of amphetamine-induced schizophrenia-like effects mediated by nitric oxide compounds. Prog Neuropsychopharmacol Biol Psychiatry 86: 353–362. doi: 10.1016/j.pnpbp.2018.03.015
    [58] Salum C, Guimarães FS, Brandão ML, et al. (2006) Dopamine and nitric oxide interaction on the modulation of prepulse inhibition of the acoustic startle response in the Wistar rat. Psychopharmacology (Berl) 185: 133–141. doi: 10.1007/s00213-005-0277-z
    [59] Sonsalla PK, Nicklas WJ, Heikkila RE (1989) Role for excitatory amino acids in methamphetamine-induced nigrostriatal dopaminergic toxicity. Science 243: 398–400. doi: 10.1126/science.2563176
    [60] Tata DA, Yamamoto BK (2007) Interactions between methamphetamine and environmentalstress: role of oxidative stress, glutamate and mitochondrial dysfunction. Addiction 102: 49–60. doi: 10.1111/j.1360-0443.2007.01770.x
    [61] Li MH, Underhill SM, Reed C, et al. (2017) Amphetamine and methamphetamine increaseNMDAR-GluN2B synaptic currents in midbrain dopamine neurons. Neuropsychopharmacology 42: 1539–1547. doi: 10.1038/npp.2016.278
    [62] Haj-Mirzaian A, Amiri S, Amini-Khoei H, et al. (2018) Involvement of NO/NMDA-R pathwayin the behavioral despair induced by amphetamine withdrawal. Brain Res Bull 139: 81–90. doi: 10.1016/j.brainresbull.2018.02.001
    [63] Erenberg G (2005) The relationship between tourette syndrome, attention deficit hyperactivitydisorder, and stimulant medication: a critical review. Semin Pediatr Neurol 12: 217–221. doi: 10.1016/j.spen.2005.12.003
    [64] Jain R, Jain S, Montano CB (2017) Addressing diagnosis and treatment gaps in adults withattention-deficit/hyperactivity disorder. Prim Care Companion CNS Disord 19: pii: 17nr02153.
    [65] Quilty LC, Allen TA, Davis C, et al. (2019) A randomized comparison of long actingmethylphenidate and cognitive behavioral therapy in the treatment of binge eating disorder. Psychiatry Res 273: 467–474. doi: 10.1016/j.psychres.2019.01.066
    [66] Novoselov IA, Cherepov AB, Raevskii KS, et al. (2002) Locomotor activity and expression ofc-Fos protein in the brain of C57BL and Balb/c mice: effects of D-amphetamine and sydnocarb. Eksp Klin Farmakol 65: 18–21.
    [67] Gruner JA, Mathiasen JR, Flood DG, et al. (2011) Characterization of pharmacological andwake-promoting properties of the dopaminergic stimulant sydnocarb in rats. J Pharmacol ExpTher 337: 380–390. doi: 10.1124/jpet.111.178947
    [68] Gainetdinov RR, Sotnikova TD, Grekhova TV, et al. (1997) Effects of a psychostimulant drugsydnocarb on rat brain dopaminergic transmission in vivo. Eur J Pharmacol 340: 53–58. doi: 10.1016/S0014-2999(97)01407-6
    [69] Afanas'ev II, Anderzhanova EA, Kudrin VS, et al. (2001) Effects of amphetamine andsydnocarb on dopamine release and free radical generation in rat striatum. Pharmacol BiochemBehav 200169: 653–658.
    [70] Bashkatova V, Mathieu-Kia AM, Durand C, et al. (2002) Neurochemical changes and neurotoxic effects of an acute treatment with sydnocarb, a novel psychostimulant: comparison with D-amphetamine. Ann N Y Acad Sci 965: 180–192.
    [71] Feier G, Valvassori SS, Lopes-Borges J (2012) Behavioral changes and brain energy metabolism dysfunction in rats treated with methamphetamine or dextroamphetamine. Neurosci Lett 530: 75–79. doi: 10.1016/j.neulet.2012.09.039
    [72] Witkin JM, Savtchenko N, Mashkovsky M, et al. (1999) Behavioral, toxic, and neurochemical effects of sydnocarb, a novel psychomotor stimulant: comparisons with methamphetamine. J Pharmacol Exp Ther 288: 1298–1310.
    [73] Anderzhanova EA, Afanas'ev II, Kudrin VS, et al. (2000) Effect of d-amphetamine and sydnocarb on the extracellular level of dopamine, 3,4-dihydroxyphenylacetic acid, and hydroxyl radicals generation in rat striatum. Ann N Y Acad Sci 914: 137–145. doi: 10.1111/j.1749-6632.2000.tb05191.x
    [74] Chen N, Li J, Li D, et al. (2014) Chronic exposure to perfluorooctane sulfonate induces behavior defects and neurotoxicity through oxidative damages, in vivo and in vitro. PLoS One 9: e113453. doi: 10.1371/journal.pone.0113453
    [75] Zhang LP, Wang QS, Guo X, et al. (2007) Time-dependent changes of lipid peroxidation and antioxidative status in nerve tissues of hens treated with tri-ortho-cresyl phosphate (TOCP). Toxicology 239: 45–52. doi: 10.1016/j.tox.2007.06.091
  • This article has been cited by:

    1. Yan Zheng, Min Zhou, Fenghua Wen, Asymmetric effects of oil shocks on carbon allowance price: Evidence from China, 2021, 97, 01409883, 105183, 10.1016/j.eneco.2021.105183
    2. Michael Frömmel, Darko B. Vukovic, Jinyuan Wu, The Dollar Exchange Rate, Adjustment to the Purchasing Power Parity, and the Interest Rate Differential, 2022, 10, 2227-7390, 4504, 10.3390/math10234504
    3. Saban Nazlioglu, Mehmet Altuntas, Emre Kilic, Ilhan Kucukkkaplan, Purchasing power parity in GIIPS countries: evidence from unit root tests with breaks and non-linearity, 2022, 30, 2632-7627, 176, 10.1108/AEA-10-2020-0146
    4. Qian Ding, Jianbai Huang, Jinyu Chen, Dynamic and frequency-domain risk spillovers among oil, gold, and foreign exchange markets: Evidence from implied volatility, 2021, 102, 01409883, 105514, 10.1016/j.eneco.2021.105514
    5. Shuaishuai Jia, Cunyi Yang, Mengxin Wang, Pierre Failler, Heterogeneous Impact of Land-Use on Climate Change: Study From a Spatial Perspective, 2022, 10, 2296-665X, 10.3389/fenvs.2022.840603
    6. Lynda Atil, Hocine Fellag, Ana E. Sipols, M. T. Santos-Martín, Clara Simón de Blas, Non-linear Cointegration Test, Based on Record Counting Statistic, 2024, 64, 0927-7099, 2205, 10.1007/s10614-023-10520-1
  • Reader Comments
  • © 2019 the Author(s), licensee AIMS Press. This is an open access article distributed under the terms of the Creative Commons Attribution License (http://creativecommons.org/licenses/by/4.0)
通讯作者: 陈斌, bchen63@163.com
  • 1. 

    沈阳化工大学材料科学与工程学院 沈阳 110142

  1. 本站搜索
  2. 百度学术搜索
  3. 万方数据库搜索
  4. CNKI搜索

Metrics

Article views(7193) PDF downloads(640) Cited by(7)

Figures and Tables

Figures(4)

Other Articles By Authors

/

DownLoad:  Full-Size Img  PowerPoint
Return
Return

Catalog