Loading [MathJax]/jax/output/SVG/fonts/TeX/fontdata.js
Research article

Design and simulation of a CMOS image sensor with a built-in edge detection for tactile vision sensory substitution

  • Tactile Vision Sensory Substitution (TVSS) systems are used to convert scene images captured by the image sensors to tactile patterns that can be used to stimulate the skin sensory of the blind users. These types of devices needed to be wearable, small size, low power consumption, lightweight, and affordable cost. This paper presents the integration of an edge detection scheme inside a CMOS image sensor forming an Edge Detection CMOS Image Sensor (EDIS). The design is simulated using LTSPICE and MATLAB, performing three ways of simulation, giving accepted edge images having very few fine edges but keeping the main edges. The proposed way is simple, low component-count, doesn’t reduce the fill factor, use no analog to digital converter, presents adaptable comparator-reference-voltage, and make a step towards an integrated all-in-one tactile vision sensory substitution device.

    Citation: Mazin H. Aziz , Saad D. Al-Shamaa. Design and simulation of a CMOS image sensor with a built-in edge detection for tactile vision sensory substitution[J]. AIMS Electronics and Electrical Engineering, 2019, 3(2): 144-163. doi: 10.3934/ElectrEng.2019.2.144

    Related Papers:

    [1] Jianzhong Shi, Ying Song . Mathematical analysis of a simplified general type-2 fuzzy PID controller. Mathematical Biosciences and Engineering, 2020, 17(6): 7994-8036. doi: 10.3934/mbe.2020406
    [2] Baohua Hu, Yong Wang, Jingsong Mu . A new fractional fuzzy dispersion entropy and its application in muscle fatigue detection. Mathematical Biosciences and Engineering, 2024, 21(1): 144-169. doi: 10.3934/mbe.2024007
    [3] Li Yang, Kai Zou, Kai Gao, Zhiyi Jiang . A fuzzy DRBFNN-based information security risk assessment method in improving the efficiency of urban development. Mathematical Biosciences and Engineering, 2022, 19(12): 14232-14250. doi: 10.3934/mbe.2022662
    [4] Qiwen Wang, Guibao Song, Xiuxia Yang . Mixed-attitude three-way decision model for aerial targets: Threat assessment based on IF-VIKOR-GRA method. Mathematical Biosciences and Engineering, 2023, 20(12): 21514-21536. doi: 10.3934/mbe.2023952
    [5] Yuting Zhu, Wenyu Zhang, Junjie Hou, Hainan Wang, Tingting Wang, Haining Wang . The large-scale group consensus multi-attribute decision-making method based on probabilistic dual hesitant fuzzy sets. Mathematical Biosciences and Engineering, 2024, 21(3): 3944-3966. doi: 10.3934/mbe.2024175
    [6] Han Wu, Junwu Wang, Sen Liu, Tingyou Yang . Research on decision-making of emergency plan for waterlogging disaster in subway station project based on linguistic intuitionistic fuzzy set and TOPSIS. Mathematical Biosciences and Engineering, 2020, 17(5): 4825-4851. doi: 10.3934/mbe.2020263
    [7] Muhammad Akram, Ahmad N. Al-Kenani, Anam Luqman . Degree based models of granular computing under fuzzy indiscernibility relations. Mathematical Biosciences and Engineering, 2021, 18(6): 8415-8443. doi: 10.3934/mbe.2021417
    [8] Bo Sun, Ming Wei, Wei Wu, Binbin Jing . A novel group decision making method for airport operational risk management. Mathematical Biosciences and Engineering, 2020, 17(3): 2402-2417. doi: 10.3934/mbe.2020130
    [9] Yevgeniy Bodyanskiy, Olha Chala, Natalia Kasatkina, Iryna Pliss . Modified generalized neo-fuzzy system with combined online fast learning in medical diagnostic task for situations of information deficit. Mathematical Biosciences and Engineering, 2022, 19(8): 8003-8018. doi: 10.3934/mbe.2022374
    [10] Muhammad Akram, Saba Siddique, Majed G. Alharbi . Clustering algorithm with strength of connectedness for m-polar fuzzy network models. Mathematical Biosciences and Engineering, 2022, 19(1): 420-455. doi: 10.3934/mbe.2022021
  • Tactile Vision Sensory Substitution (TVSS) systems are used to convert scene images captured by the image sensors to tactile patterns that can be used to stimulate the skin sensory of the blind users. These types of devices needed to be wearable, small size, low power consumption, lightweight, and affordable cost. This paper presents the integration of an edge detection scheme inside a CMOS image sensor forming an Edge Detection CMOS Image Sensor (EDIS). The design is simulated using LTSPICE and MATLAB, performing three ways of simulation, giving accepted edge images having very few fine edges but keeping the main edges. The proposed way is simple, low component-count, doesn’t reduce the fill factor, use no analog to digital converter, presents adaptable comparator-reference-voltage, and make a step towards an integrated all-in-one tactile vision sensory substitution device.


    As an effective and low-cost method to achieve high precision deformation information of large areas, Interferometry Synthetic Aperture Radar (InSAR) technology is widely used in topographic survey, earthquake monitoring, ground surface subsidence monitoring and many other applications [1,2,3]. However, conventional InSAR is affected by the temporal decorrelation and atmospheric effects, which seriously restricts the accuracy and reliability in deformation monitoring [4]. Based on plenty of relatively stable, high coherent points from time-series SAR images and implementing differential Interferometry Synthetic Aperture Radar (DInSAR) on them, Permanent Scatterer InSAR (PSInSAR) can mitigate the spatial and temporal decorrelation and atmospheric delay effect to get relatively high accuracy and reliable information of the earth surface deformation [5,6,7,8,9,10,11,12].

    One of the key steps for PSInSAR technology is to analyze and process those stable scatterers with the high coherent characteristic. The phase stability of PS determines that the deformation results of these scatterers is reliable and can reflect the ground deformation if the density of PS is sufficient [13,14]. So how to identify and select PS automatically and effectively from SAR images is one of the most critical procedures in PSInSAR technology.

    Ferretti et al. firstly proposed the algorithms of PS identification and selection, including amplitude dispersion thresholding, temporal correlation thresholding and phase deviation thresholding [15,16], and some related experiments were implemented correspondingly. Among them, the amplitude dispersion thresholding needs a large number of images for the statistical analysis. However, in the amplitude dispersion thresholding method, only the varying of amplitude is used without considering the corresponding amplitude value. In addition, its reliability is related to the quality of the image preprocessing and the setting of the threshold [17,18]. The results based on temporal correlation thresholding are actually some stable regions rather than individual pixels. Their reliability is related to the window size and the selection of the threshold directly. Phase dispersion thresholding only considers phase information, so the results are easily affected by decorrelation, system thermal noise and so on [19]. Kampes et al. proposed a new PS selection algorithm by setting an amplitude threshold to identify high coherent points, which can detect high amplitude points easily [20,21]. Considering the phase stability, Hooper presented a new PS identification method based on the spatial correlation analysis of interferometric phase and implemented some related deformation extraction experiments [22,23].

    To automatically identify PS, Chen et al. put forward a Double-Thresholding algorithm (DTA) by combining both correlation coefficient threshold and amplitude dispersion index threshold [18]. Luo et al. proposed a method named amplitude information dual-threshold approach (AIDTA). With this method, those points with high amplitude values are firstly selected as permanent scatterer candidates (PSCs), then the eventual PS are taken out of PSCs by setting a suitable amplitude dispersion index (ADI) threshold [24]. Azadnejad et al. presented a new method which is based on minimizing Amplitude Dispersion Index (ADI) by finding the optimum scattering mechanism to increase the number of PSC and PS pixels [25]. Similarly, taking into account the characteristics of strong reflectivity and stable backscattering of PS to radar waves, Hu et al. presented a new method by seriously setting tri-threshold with time-series correlation coefficient, amplitude dispersion index and amplitude index [19]. Based on the characteristics and flaws of all kinds of PS selection methods, such as amplitude stability, phase stability, temporal sequence correlation and amplitude dispersion index threshold, Long et al. proposed a new approach considering the union and intersection of temporal sequence correlation coefficient threshold and amplitude dispersion index threshold [26]. Tao et al. presented a new method for identifying and selecting PS by introducing wavelet phase analysis and taking into account the stability of amplitude and phase [27].

    All the above mentioned methods enriched the PS identification technology and achieved superior effects and they are suitable for those land cover with clear characters (e.g. unstable plants and stable man-made buildings) areas. However, these methods identify PS by setting one or several thresholds under the “black or white” rule without taking the fuzzy characteristics of the PS into account and can easily fall into a logical paradox especially in the area covered by objects possessing ambiguous boundary for interested features. For example, in an mountain area covered with various reflective land covers (there is no clear boundary of the reflection intensity), considering both the amplitude and amplitude dispersion index thresholds, it might be obviously unreasonable that if a pixel, with amplitude equal or greater than 64 and amplitude dispersion equal or less than 0.4, is selected as PS, while another pixel with the amplitude 63.99999 and amplitude dispersion 0.2 is excluded from PS. In fact, this can exclude many valuable PS, which usually leads to unreliable subsidence analysis results because of sparse density of PS. Based on this, this paper tries to find a suitable PS selection method to deal with those areas with fuzzy features. The fuzzy set (FS) theory was proposed in 1965 [28], since then it is widely used in various fields [29,30,31]. It adopts quantitative method to study and deal with the fuzzy phenomenon and always makes the solution in conformity with the practical situation. In other words, FS method can achieve more accurate result by a fuzzy point of view. In order to obtain more reasonable PS in those areas covered by objects possessing ambiguous boundary for interested features, a new fuzzy PS (FPS) concept is first proposed based on fuzzy set theory in this paper. Taking the two indexes amplitude and amplitude dispersion in AIDTA as an example, the selection method is presented. Two groups of real data are performed to validate the proposed method. The results indicate that, compared with traditional method, FPS can not only eliminate the negative effect of the “black or white” rule because of setting single threshold on each PS characteristic, but also gain a unified quantitative index to guide the selection and quality classification of PS by fusing different PS characters comprehensively.

    The paper is organized as follows. Section 2 introduces the detail description of amplitude information dual-threshold approach (AIDTA). The fuzzy PS identification method is presented in Section 3. Test results and data analysis are given in Section 4. The last part of the paper is the conclusions attained through this study.

    Based on the characteristics of PS with strong and stable Radar reflectivity, a method named amplitude information dual-threshold approach (AIDTA) was proposed [24]. Firstly, the pixels with high amplitude values are selected as PS candidates (PSC) using amplitude thresholding in view of their strong reflectivity. Then, PS are selected from PSC according to an amplitude dispersion index thresholding for their stable reflectivity.

    1) Consider N time-series images covering the same area. The amplitude threshold is computed as:

    TA=min{1m×nmi=1nj=1Aki,j|k=1,2,,N} (1)

    where m and n represent the number of rows and columns of the SAR images; Ak is the calibrated amplitude array of the kth SAR image [32]. From Eq (1), the minimum of the amplitude mean of each image is set as the amplitude threshold.

    For a fixed TA, PSC are those pixels satisfying the following formula:

    min{Aki,j|k=1,,N}TA (2)

    The above amplitude threshold considers only the strong reflectivity without regarding to the scattering stability of PS, making the result not reliable enough. In the following step, PS are further selected from the PSC using amplitude dispersion index threshold for their stable reflectivity.

    2) Amplitude dispersion index DA and phase dispersion index Dφ are used to quantitatively express the stability of the PS scattering. The distribution of the amplitude values f(A) is given by the Rice distribution [16]:

    f(A)=Aσ2nI0[Agσ2n]e(A2+g2)/(A2+g2)(2σ2n)(2σ2n) (3)

    where I0 is the modified Bessel function; σ2n is the power of complex circular Gaussian distributed noise; g is complex reflectivity and A>0.

    The shape of the Rice Distribution depends on the SNR (i.e., the ratio g/gσnσn). For low SNR, the probability density function (PDF) tends to a Rayleigh distribution. For high SNR (g/gσnσn>4), f(A) approaches a Gauss distribution, and the following equations hold:

    {σAσnR=σnIDφσnIgσAmA=DA (4)

    where σnR and σnI are the noise standard deviation of the real and imaginary part; mA and σA are the mean and the standard deviation of the amplitude values Ak; DA is called amplitude dispersion index (ADI). According to the above equation, the amplitude dispersion index is a measure of phase stability, at lease for high SNR pixels [16].

    Based on the above analysis, the selected PSC can meet the high SNR, and the points are selected as PS if the amplitude dispersion is below a threshold in the second step which means that the final PS are with stable reflectivity. Therefore, PS can be finalized through further analysis of the amplitude dispersion index on PSC.

    The basic idea of fuzzy set is to make the absolute membership degree in common sets flexible, specifically, by expanding the membership degree of element from the only 0 or 1 to arbitrary value in [0, 1]. Some relevant concepts are briefly described as follows [33]:

    Let U be the universal set. A fuzzy set F of U can be mathematically described as:

    F={(u,μF(u))|uU} (5)

    where μF(u):U[0,1] represents the membership degree of an element belonging to F.

    λ cut of a fuzzy set F in U can be defined as

    (F)λ={u|μF(u)λ,uU} (6)

    where λ is called a threshold. Obviously, (F)λ is a common set and (F)λ1(F)λ2 if λ1<λ2.

    T-norms, T-conorms and negated function are the basic operations on fuzzy sets to compute the membership degree of their union, intersection and complement, respectively. Minimum, Algebra product and bounded product are common T-norms operators.

    PS are with the characteristics of steadier scattering and stronger radar echo signal. While “steadier” and “stronger” are fuzzy descriptions of PS properties. Based on previous research PS and non-PS are classified by setting threshold respectively for each characteristic. One pixel will be excluded from PS once it does not meet any threshold rule. This in turn will lead to an “either this or that” logic paradox especially in the area covered by objects possessing ambiguous boundary for interested features. Because it is very difficult to set a precise and proper threshold in practice. For example, if pixels whose amplitude greater than or equal to 367.54 and amplitude dispersion less than or equal to 0.35 are identified as PS, it is more reasonable to classify the pixel with amplitude 367.30 and amplitude dispersion 0.27 to PS, while the previous method may make a rejection choice. Based on this, the concept of fuzzy PS is proposed and a fuzzy identification method is designed accordingly.

    On the base of fuzzy set theory, each point is no longer classified into either “PS” set or “no-PS” set absolutely, but has a membership degree to describe its level belonging to “PS”.

    Let P represent all pixels in a study area. Each pixel pP has m feature indexes C1,,Cm which are used to describe the characteristics of “PS”. Accordingly, there will be a fuzzy vector V(p)=(u1(p),,um(p)), where ui(i=1,,m) is the value of p in Ci. Define m fuzzy sets A1,,Am, where Ai={(u,μAi(u))|uUi} is a fuzzy set describing feature Ci, Ui is a universal set containing all values of p in Ci. Since all the fuzzy sets are to describe the feature of PS, fuzzy PS set P can be given by P=mi=1Ai and the membership degree can be calculated by the following formula

    μP(p)=Tmi=1μAi(ui(p)) (7)

    where T represents T-norms and Algebra product operation is selected in this paper. Thus, the fuzzy PS set can be written as P={(p,μP(p))|pP}. Accordingly, the λ cut of P can be symbolized as Pλ={p|μP(p)λ,pP}, which means all the pixels whose membership degrees are greater than or equal to λ.

    According to the above theory, each pixel has a corresponding membership degree, which can be considered as the level it belongs to “PS”. A larger membership degree means the higher possibility that a certain pixel will be regarded as PS. It must be pointed out that, how to select a proper membership function in practice will directly affect the identification results. Since there is not a universal law to select a membership function, the reasonable and proper formulas for membership functions are more or less formulated with subjectivity or by experience.

    The new PS identification algorithm based on fuzzy set (fuzzy PS identification for short) are as follows:

    1) Select the study area. A matrix is used to describe the whole pixels which can be expressed by position.

    2) Choose m feature indexes related to properties of PS, written as C1,Cm, such as “amplitude”, “amplitude dispersion” or “time-series correlation coefficient”.

    3) Define fuzzy set Ai for Ci, such as “high” amplitude, “low” amplitude dispersion and so on. They are usually constructed based on some empirical models.

    4) Determine fuzzy PS set P=mi=1Ai, μP(p)=Tmi=1μAi(ui(p)). The operator T is decided on practical problem.

    5) Set membership degree threshold λ to select the points satisfying μP(p)λ. This is usually related to the threshold of traditional method.

    6) Determine practical PS considering the traditional method and the fuzzy method.

    The proposed method is a new characteristic fusion tool to identify PS. By fusing two or more characteristics, the practical PS can be selected on one hand, and the quality value of each PS can be obtained on the other hand. The former is conducted by controlling the membership degree threshold instead of setting single threshold for each characteristic. From Eq (7), it can be seen that the membership degree in fuzzy PS set P is a fusion result taking the entire feature into account. Therefore, it is more reasonable than the traditional method by setting single threshold one by one.

    Twenty-seven TerraSAR-X images acquired from April 2012 to January 2013 are selected as the first test data set. The cropped images are 500 × 500 pixels, which cover part of 18,207 working face in Tunlan coal mine and its geographical location is about from east longitude 111 to 112 degree, and north latitude 37 to 38 degree.

    Taking the amplitude information dual-threshold approach (AIDTA) as an example, the traditional method (AIDTA) and fuzzy amplitude information dual-threshold approach (FAIDTA) are compared to show their relationship and difference. For simplicity, PS selected by AIDTA are shortly written as PS-AIDTA, PS selected by FAIDTA are simply described as PS-FAIDTA, and PS selected by FAIDTA but excluded from AIDTA is expressed as PS-FAIDTA/AIDTA.

    The calculated amplitude threshold for this test data was TA=104.11 based on Eq (1). Meanwhile, the amplitude dispersion threshold was set as TB=0.32 to make sure the selected PS candidates with high amplitude stability. Then, the calculated number of PS-AIDTA is 709. The FAIDTA method can be described as follows:

    Define that U=(pi,j)I×J(i=1,,I,j=1,,J) represents all the pixels in study area, pi,j is the position of the i row, j column pixel, I=500 and J=500 are the number of rows and columns. The minimum amplitude value of time-series (amplitude value for short) ci,j and amplitude dispersion value qi,j for pixel pi,j were selected to describe the features of PS. Correspondingly, two fuzzy sets were defined.

    The first fuzzy set A means that the amplitude value c is high. The second fuzzy set B means that the amplitude dispersion value q is low. As a kind of methods for constructing fuzzy membership function, the assignment method is used in this paper [34,35]. The membership functions of A and B are shown as follows, which are Cauchy distributions

    μA(c)={00<cTA/211+(cTA/2TA/10)2.5TA/2<cmax{cij} (8)
    μB(q)={02TBqmax{qi,j}11+(2TBq2TB/5)40<q<2TB (9)

    Figure 1 shows the membership functions of amplitude value and the amplitude dispersion value. It can be found that the former is monotone increasing and the latter is monotone decreasing. The membership degrees of the amplitude threshold (TA=104.11) and the amplitude dispersion threshold (TB=0.32) are greater than 0.9, and the membership function of the latter is more sensitive than the former, which conforms to the real expectation.

    Figure 1.  Membership Degree Functions of amplitude and amplitude dispersion. Note that c is the amplitude value (unit: dB) and q is the amplitude dispersion value (Dimensionless). The membership degree μ is a dimensionless quantity with a range [0, 1].

    According to fuzzy set theory, the membership degree of any pixel belonging to “PS” is

    μP(p)=μA(c(p))μB(q(p)) (10)

    The calculated minimum membership degree of PS-AIDTA is 0.92384.

    Figure 2 shows three overlay sub-graphs. The green ‘*’ means the PS-AIDTA, and the red ‘o’ represents the PS-FAIDTA. PS-AIDTA are all the same in the three sub-graphs because the thresholds of amplitude and amplitude dispersion are fixed, while PS-FAIDTA are different under three membership degree thresholds, and both of them are on top of the mean intensity image in study area. From all the three sub-graphs, it can be found that the PS-AIDTA and the PS-FAIDTA are mostly distributed in the strong reflected intensity area. With the decrease of membership degree threshold, the number of PS-FAIDTA grows. When the membership degree threshold was set as T = 0.92384 (the minimum membership degree of PS-AIDTA), the PS-FAIDTA include all the PS-AIDTA and the former is much more than the latter. This is consistent with the fuzzy PS theory—the λ -cut of a fuzzy set is monotone decreasing with λ.

    Figure 2.  PS distribution under different membership degree thresholds in the mean-intensity map for Case 1. (a) with membership degree threshold T = 0.94; (b) with membership degree threshold T = 0.93; (c) with membership degree threshold T = 0.92384.

    Table 1 shows the statistic information under different membership degree thresholds. There are some abbreviations: TMD is the threshold of membership degree; n-FAIDTA, n-FAIDTA/AIDTA, and n-intersection stand for the number of PS-FAIDTA, PS-FAIDTA/AIDTA, and the intersection of FAIDTA and AIDTA respectively. It can be found that with the decrease of membership degree threshold, the number of PS-FAIDTA, PS-FAIDTA/AIDTA and their intersection increase. When the membership degree threshold was set as T = 0.92384, the PS-FAIDTA include all the PS-AIDTA and the former is about 37 percent more than the later. Figure 2 and Table 1 indicate that the PS-FAIDTA method is feasible and it can select some different pixels based on FAIDTA method. Following, the quantitative characteristics of these PS-FAIDTA/AIDTA are showed and analyzed.

    Table 1.  The number of PS-FAIDTA, PS-FAIDTA/AIDTA and intersection under different membership degree thresholds.
    TMD n-FAIDTA n-FAIDTA/AIDTA n-intersection
    0.92384 974 265 709
    0.925 941 234 707
    0.928 891 190 701
    0.93 841 146 695
    0.94 628 13 615
    0.95 440 1 489
    0.96 277 0 277

     | Show Table
    DownLoad: CSV

    Figure 3 shows the characters of the PS-FAIDTA/AIDTA under different membership degree thresholds. Sub-graph (a) offers the amplitude values of these scatterers, (b) shows their amplitude dispersion values and n is the number of selected pixels. It is clearly shown that all of them are not far from the “PS” characters. And as the membership degree threshold increases, the number of PS-FAIDTA/AIDTA decreases, while the amplitude values of these scatterers are closer to the threshold of AIDTA and the amplitude dispersion values get smaller and smaller, which conforms to the PS characteristics better. This can be confirmed from the two subplots on the right-most side of Figure 3 especially. According to the traditional method (AIDTA), these scatters should be belonged to “no-PS” because they do not simultaneously meet the requirements that the minimum amplitude value of the pixel sequence should be greater than a fixed threshold 104.11 and the amplitude dispersion should be smaller than 0.32. However, it is not a logical judgment to some extent. For our study, the first requirement is very strong. In practice, there are some pixels whose amplitude values are slightly smaller than the given threshold while their amplitude dispersion values are much lesser than the given threshold. Obviously, they conform to “PS” better. Similarly, there is the same problem for amplitude dispersion index threshold in traditional method. Actually, these problems are embodied in several traditional methods beside AIDTA because the fuzzy properties of PS are not considered. This demonstrates the significance of the FAIDTA method. In addition, it should be worth noting that some PS-FAIDTA/AIDTA may not be selected as practical PS because their characteristics are far from PS somewhat. However, with the increase of the membership degree threshold, the reliability of the PS-FAIDTA/AIDTA is improving. Therefore, we can select those with high membership degree as practical PS.

    Figure 3.  Characters of the PS-FAIDTA/AIDTA under different membership degree thresholds, (a) is about amplitude. (b) is about the amplitude dispersion results.

    Figure 4 shows the distribution of membership degrees of those PS-FAIDTA/AIDTA under different membership degree thresholds. We find that the membership degrees are relatively greater compared to the minimum membership degree of PS-AIDTA 0.92384 on the whole and the lesser the membership degree threshold is, the more PS-FAIDTA/AIDTA can be selected as. In practice, it is improper for them to be all excluded from PS. Take the sixth point in the third sub-graph for example, its amplitude is 100.31 and amplitude dispersion is 0.1888. Relatively, the former is slightly less than the threshold 104.11, while the latter is much less than 0.32. By our subjective judgment, it is more consistent with the characteristics of “PS”. Its membership degree, greater than 0.955 from the Figure 4, confirms the judgment, which reflects the rationality of the new method.

    Figure 4.  The membership degrees of the PS-FAIDTA/AIDTA under different membership degree thresholds.

    Table 2 lists eight typical pixels whose membership degrees are greater than 0.94, amplitude are greater than 100 and amplitude dispersion are less than 0.32. Clearly, the amplitude of all the pixels are slightly smaller than the threshold 104.11 relatively. That is why these points are excluded by AIDTA. In fact, it is reasonable for them to be selected as PS based on their high amplitude stability seen from amplitude dispersion and negligible undesirable amplitude information. Taking the eighth pixel of Table 2 for example, its amplitude 102.42 is only a litter below the threshold 104.11 a little relatively, while its amplitude dispersion 0.2711 is much smaller than 0.32. Comprehensively considering, it’s a better choice to classify it as a PS.

    Table 2.  The amplitude (A) and amplitude dispersion (AD) values of some pixels in PS-FAIDTA/AIDTA.
    Index Values
    AD 0.2463 0.2629 0.2694 0.2708 0.1888 0.2390 0.2710 0.2710
    A 101.38 101.96 101.52 101.75 100.31 101.52 101.29 102.42

     | Show Table
    DownLoad: CSV

    Another merit of FAIDTA is that quality results of all the interested pixels can be achieved based on their membership degrees in study area. Figure 5 shows two typical quality maps about PS-FAIDTA under membership degree threshold T = 0.8 and T = 0.9 respectively (mathematically named 0.8-T cut and 0.9-T cut of fuzzy set P). In Figure 5, the brighter the pixel is, the greater the membership degree it has. Thus it can be seen that the FAIDTA method can not only recognize the effective PS, but also obtain the quality result of these pixels. In other words, FAIDTA can also obtain the quantitative description for the selected PS, which may be used for evaluating the reliability of them.

    Figure 5.  Quality maps of PS-FAIDTA under membership degree threshold T = 0.8 and 0.9. (a) with membership degree threshold T = 0.8; (b) with membership degree threshold T = 0.9.

    In addition, the proposed method is also compared with the traditional algorithm (AIDTA) from the numerical computational costs. To compare the efficiency of different algorithms objectively, the same hardware and software were adopted. The hardware was a PC with a Core i7-8565U CPU and 16 Gb RAM. Matlab software (version R2017b) running on the Win10 system was used to design the different algorithms. For the test data in this case, the new method costs about 0.5 second and AIDTA costs about 0.05 seconds. Because the membership degrees of the candidate points need more computational costs. It should be pointed that the cost of the new method is closely related to the parameter setting in selecting the candidate points.

    Fifty-six ERS images acquired from April 1992 to January 2003 over Luxembourg are selected as the second test data set. The cropped images are 150 × 650 pixels and cover about 39 km2. The same methods and processing strategy are used. The amplitude dispersion threshold is set as 0.35. The calculated amplitude threshold and minimum membership degree of PS-AIDTA PS are 367 and 0.9263 respectively in this test. For keeping the paper concise, parts of the results are shown below.

    Figure 6 shows three corresponding overlay sub-graphs. The green ‘*’ and red ‘o’ mean the same as Figure 2. Similar regularity it demonstrates as Figure 1.

    Figure 6.  PS distribution under different membership degree thresholds in the mean-intensity map for Case 2. (a) with membership degree threshold T = 0.94; (b) with membership degree threshold T = 0.93; (c) with membership degree threshold T = 0.9263.

    Table 3 shows the statistic information about the PS-AIDTA and PS-FAIDTA under different membership degree thresholds. The abbreviations are the same as Table 1. When the membership degree threshold was set as T = 0.9263, the PS-FAIDTA include all the PS-AIDTA. Other analyses are similar to Figure 6.

    Table 3.  The number of PS-FAIDTA, PS-FAIDTA/AIDTA and intersection under different membership degree thresholds.
    TMD n-FAIDTA n-FAIDTA/AIDTA n-intersection
    0.9263 890 141 749
    0.93 844 99 745
    0.94 729 26 703

     | Show Table
    DownLoad: CSV

    Table 4 lists nine typical pixels with membership degrees greater than 0.94, amplitude greater than 360 and amplitude dispersion less than 0.35. Clearly, the amplitude values of all the pixels are slightly smaller than the threshold 367.54 calculated by AIDTA method relatively. That is why these points are excluded by AIDTA. In fact, it is reasonable for them to be selected as PS based on their high amplitude stability seen from amplitude dispersion and negligible undesirable amplitude information. Taking the sixth pixel of Table 4 for example, its amplitude value 367.30 is slightly below the threshold 367.54, while its amplitude dispersion 0.2757 is much lesser than 0.35. Comprehensively considering, it’s a better choice to classify it as a PS.

    Table 4.  The amplitude (A) and amplitude dispersion (AD) values of some pixels in PS-FAIDTA/AIDTA.
    Index Values
    AD 0.2751 0.2729 0.2867 0.2652 0.2757 0.2465 0.2514 0.2961
    A 365.87 360.84 365.40 361.51 367.30 366.04 363.89 363.83

     | Show Table
    DownLoad: CSV

    Figure 7 shows the distribution of membership degrees of those PS-FAIDTA/AIDTA under different membership degree thresholds. It can be found that the membership degrees are relatively greater compared to the minimum membership degree of PS-AIDTA 0.9263 on the whole and the lesser the membership degree threshold is, the more PS-FAIDTA/AIDTA can be selected as. The twenty-second point, whose amplitude value is 366.04, amplitude dispersion value is 0.2465 and membership degree is greater than 0.95, indicates the illogical judgment of excluding all of them by AIDTA.

    Figure 7.  The membership degrees of the PS-FAIDTA/AIDTA under different membership degree thresholds.

    From Cases 1 and 2, it can be found that AIDTA method always lose some key pixels which could be identified as PS for application while FAIDTA can make up this shortcoming. In other words, combing the two methods can usually lead to a nicer result for PS identification. Firstly, traditional method AIDTA is used to get some PS with clear characteristics. Then, some supplement pixels with high membership degree selected by FAIDTA method are obtained. As a consequence, it can increase the density of practical PS. Sub-graphs (a), (b) in Figures 2 and 6 show the selection results for the combining method. Moreover, from Tables 1 and 3, we can find that the new method plays a greater role in case 1 (the percent of n-FAIDTA/AIDTA is higher). In other words, the extent of the increase is different for different study areas. This depends on the land cover types. The vaguer the difference between land covers, the greater the extent of increase and the more sensitive the selection result. For instance, if a study area is covered with various reflective land covers, more reasonable PS can be selected based on the FAIDTA method and a slight change of the threshold will lead to great changes of the selection result. However, an opposite result can be shown in areas covered only by crops and some man-made corner reflectors. Therefore, the FAIDTA method can further improve the PS technology. In addition, it is clearly that the quality results of the selected PS can be also obtained, which can be used to evaluate the degree of the reliability for the selected PS. This is a remarkable advantage compared with traditional methods.

    Based on the fuzzy sets theory and features of PS pixels, a new concept of fuzzy PS was proposed and a fuzzy identification method was designed. Taking the amplitude information dual-threshold approach (AIDTA) as an example, the characters of PS were quantitatively described by membership degrees of amplitude and amplitude dispersion. Accordingly, a fuzzy AIDTA (FAIDTA) method was formed. Two groups of real data indicated that FAIDTA could recognize more effective and reliable permanent scatterers so as to compensate for traditional method AIDTA. In addition, quality results of the selected PS also could be obtained from the membership degrees, which could be used for quantitative evaluation of the selected points in time-series analyzing step of PSInSAR technology. That is to say, the new method not only can provide more practical PS to promote the time series analysis reliability for ground subsidence, but also can present quality value of each PS which can be used to evaluate the result of deformation based on PSInSAR technology. Generally, the proposed method can be extended based on other traditional PS identification methods, which is an effective feature fusion tool for PS identification and can improve the PSInSAR technology. Furthermore, how to apply the selected PS to subsidence monitoring is our future work. Additionally, heuristic and PSO algorithms can also be used to solve this problem, which are our other further research.

    This work was supported by Science Foundation of Jiangsu Province (No: BK20170248) and National Natural Science Foundation of China (No: 51804297).

    The authors declare no conflict of interest.


    [1] Kristjánsson Á, Moldoveanu A, Jóhannesson ÓI, et al. (2016) Designing sensory-substitution devices: Principles, pitfalls and potential1. Restor Neurol Neuros 34: 769–787.
    [2] Bach-y-Rita P, Kercel SW (2003) Sensory substitution and the human–machine interface.Trends Cogn Sci 7: 541–546. doi: 10.1016/j.tics.2003.10.013
    [3] Way TP, Barner KE (1997) Automatic Visual to Tactile Translation, Part I: Human Factors, Access Methods, and Image Manipulation. IEEE TRANSACTIONS ON REHABILITATION ENGINEERING 5: 81–94. doi: 10.1109/86.559353
    [4] Velázquez R (2010) Wearable assistive devices for the blind. In: Wearable and autonomous biomedical devices and systems for smart environment, pp. 331–349, Springer.
    [5] Krufka SE, Barner KE, Aysal TC (2007) Visual to tactile conversion of vector graphics. IEEE Transactions on Neural Systems and Rehabilitation Engineering 15: 310–321. doi: 10.1109/TNSRE.2007.897029
    [6] Ivanchenko V, Coughlan JM, Shen H (2008) Detecting and locating crosswalks using a camera phone. In: 2008 IEEE Computer Society Conference on Computer Vision and Pattern Recognition Workshops, pp. 1–8.
    [7] Bourbakis N (2008) Sensing surrounding 3-D space for navigation of the blind. IEEE Engineering in Medicine and Biology Magazine 27: 49–55. doi: 10.1109/MEMB.2007.901780
    [8] Balakrishnan G, Sainarayanan G, Nagarajan R, et al. (2007) Wearable Real-Time Stereo Vision for the Visually Impaired. Engineering Letters 14: 6–14.
    [9] Kajimoto H, Kanno Y, Tachi S (2006) Forehead Electro-tactile Display for Vision Substitution. In: Proc EuroHaptics.
    [10] Kong JS, Kim SH, Sung DK, et al. (2016) A 160×20 Light-Adaptive CMOS Vision Chip for Edge Detection Based on a Retinal Structure Using a Saturating Resistive Network. ETRI Journal 29: 59–69.
    [11] Katic N, Schmid A, Leblebici Y (2014) A retina-inspired robust on-focal-plane multi-band edge-detection scheme for CMOS image sensors. In: 2014 IEEE 57th International Midwest Symposium on Circuits and Systems (MWSCAS), pp. 683–686.
    [12] Jose J, Farrajota M, Rodrigues JMF, et al. (2011) The SmartVision local navigation aid for blind and visually impaired persons. International Journal of Digital Content Technology and its Applications 5: 362–375.
    [13] Kajimoto H, Suzuki M, Kanno Y (2014) HamsaTouch: Tactile vision substitution with smartphone and electro-tactile display. In: Proceedings of the Extended Abstracts of the 32nd annual ACM conference on Human Factors in Computing Systems, pp. 1273–1278.
    [14] Pereira MC, Kassab F (2006) An electrical stimulator for sensory substitution. In: 2006 International Conference of the IEEE Engineering in Medicine and Biology Society, pp. 6016–6020.
    [15] Rao AS, Gubbi J, Palaniswami M, et al. (2016) A vision-based system to detect potholes and uneven surfaces for assisting blind people. In: 2016 IEEE International Conference on Communications (ICC), pp. 1–6.
    [16] Roth P, Richoz D, Petrucci LS, et al. (2001) An audio-haptic tool for non-visual image representation. In: Proceedings of the 6th International Symposium on Signal Processing and Its Applications 1: 64–67.
    [17] Way TP, Barner KE (1997) Automatic Visual to Tactile Translation, Part II: Evaluation of the TACTile Image Creation System. International Conference of the IEEE Engineering in Medicine and Biology Society 5: 95–105.
    [18] du Buf JMH, Barroso J, Rodrigues JMF, et al. (2011) The SmartVision Navigation Prototype for Blind Users. International Journal of Digital Content Technology and its Applications 5: 351–361.
    [19] Hir JL, Kolar A, Santos FVD (2017) Distributed mixed-signal architecture for programmable smart image sensors. In: 2017 15th IEEE International New Circuits and Systems Conference (NEWCAS), pp. 353–356.
    [20] Grewe L, Overell W (2017) Road following for blindBike: an assistive bike navigation system for low vision persons. In: Signal Processing, Sensor/Information Fusion, and Target Recognition XXVI 10200: 1020011. doi: 10.1117/12.2264548
    [21] Fossum ER (1998) Digital camera system on a chip. IEEE Micro 18: 8–15.
    [22] Elouardi A, Bouaziz S, Dupret A, et al. (2007) Time comparison in image processing: APS sensors versus an artificial retina based vision system. Meas Sci Technol 18: 2817–2826. doi: 10.1088/0957-0233/18/9/011
    [23] Gonda M, Jarvis R (2000) Tactile Vision-Development of a Wearable Prosthesis for the Blind. In: Australian Conference on Robotics and Automation, pp. 71–74.
    [24] Elouardi A, Bouaziz S, Dupret A, et al. (2004) Image processing vision system implementing a smart sensor. In: Proceedings of the 21st IEEE Instrumentation and Measurement Technology Conference (IEEE Cat. No.04CH37510) 1: 445–450.
    [25] El Gamal A, Yang DXD, Fowler BA (1999) Pixel Level Processing - Why, What, and How? In:Sensors, Cameras, and Applications for Digital Photography 3650: 2–13. doi: 10.1117/12.342849
    [26] Loose M, Meier K, Schemmel J (1996) Camera with analog adaptive photoreceptors for a tactile vision aid. In: Intelligent Robots and Computer Vision XV: Algorithms, Techniques, Active Vision, and Materials Handling 20904: 528–537.
    [27] Nixon RH, Kemeny SE, Pain B, et al. (1996) 256×256 CMOS Active Pixel Sensor Camera-on-a-Chip. In: 1996 IEEE International Solid-State Circuits Conference. Digest of Technical Papers (ISSCC) 31: 2046–2050.
    [28] Hong CS (2001) On-chip spatial image processing with CMOS active pixel sensors. PhD Thesis, Waterloo, Ontario, Canada.
    [29] Lichtsteiner P, Posch C, Delbruck T (2006) A 128 X 128 120db 30mw asynchronous vision sensor that responds to relative intensity change. In: 2006 IEEE International Solid State Circuits Conference - Digest of Technical Papers 39: 2060–2069.
    [30] Amhaz H, Sicard G (2012) New smart readout technique performing edge detection designed to control vision sensors dataflow. In: Sensors, Cameras, and Systems for Industrial and Scientific Applications XIII 8298: 82980N. International Society for Optics and Photonics. doi: 10.1117/12.909553
    [31] Cho DID, LEE TJ (2015) A Review of Bioinspired Vision Sensors and Their Applications.Sensors and Materials 27: 447–463.
    [32] Nixon M, Aguado A (2008) Feature Extraction and Image Processing (2nd ed.). Orlando, FL, USA: Academic Press, Inc.
    [33] Lee TH (2007) Edge Detection Analysis. IJCSI International Journal of Computer Science Issues 5: 1–25.
    [34] Juneja M, Sandhu P (2009) Performance evaluation of edge detection techniques for images in spatial domain. International Journal of Computer Theory and Engineering 1: 614–622.
    [35] Desai NR, Hoang KV, Sonek GJ (1993) Applications of PSPICE Simulation Software to the Study of Optoelectronic Integrated Circuits and Devices. IEEE Transactions on Education 36: 357–362. doi: 10.1109/13.241611
    [36] Neifeld MA, Chou WC (1998) SPICE-Based Optoelectronic System Simulation. Applied optics37: 6093–6104.
    [37] Navarro D, Feng Z, Viswanathan V, et al. (2011) Image toolbox for CMOS image sensors simulations in Cadence ADE. In: International Conference on Design and Modeling in Science, Education, and Technology: DeMset, p. 5.
    [38] Feng Z, Viswanathan V, Navarro D (2012) Image Sensor Matrix High Speed Simulation. World Academy of Science, Engineering and Technology International Journal of Electrical, Computer, Energetic, Electronic and Communication Engineering 6: 1244–1247.
    [39] Navarro D, Feng Z, O'Connor I (2013) Image Toolbox for CMOS Image Sensors Fast Simulation. Global Journal of Computer Science and Technology , Graphics & Vision 13: 1–6.
    [40] Jha M, Charaya N, Dahiya S (2016) Design and Analysis CMOS Image Sensor. International Journal of Engineering Science Invention 5: 69–72.
    [41] Suthar K, Thakker R (2018) A New Global Shutter 8T CIS Architecture with CDS Operation. In:Proceedings of the International Conference on Intelligent Systems and Signal Processing, Advances in Intelligent Systems and Computing, pp. 113–124.
    [42] Feng Z (2014) Fast Scalable and Variability Aware CMOS Image Sensor Simulation Methodology. PhD Thesis, Automatique Institut des Nanotechnologies de Lyon.
    [43] Feng Z, Navarro D, O'Connor I (2015) A new method for Image sensor simulation. Available from: https://www.researchgate.net/publication/265062241_A_new_method_for_Image_sensor_simul ation.
    [44] Ohta J (2007) Smart CMOS Image Sensors and Applications. (B. J. Thompson, Ed.) CRC Press.
    [45] Fossum ER (1993) Active Pixel Sensors : Are CCDs dinosaurs? In: Charge-Coupled Devices and Solid State Optical Sensors III 1900: 2–15.
    [46] Fossum ER (1995) CMOS Image Sensors: Electronic Camera On A Chip. In: Proceedings of International Electron Devices Meeting, pp. 17–25.
    [47] Dipti, Mehra R, Sehgal D (2016) Optimized Design of Active Pixel Sensor using CMOS 180 nm Technology. International Journal of Advanced Research in Computer and Communication Engineering 5: 423–426. doi: 10.17148/IJARCCE.2016.51297
    [48] Choi B, Kim S, Lee J, et al. (2018) Complementary Metal Oxide Semiconductor Image Sensor Using Gate / Body-tied P-channel Metal Oxide Semiconductor Field Effect Transistor-type Photodetector for High-speed Binary Operation. Sensor Mater 30: 129–134.
    [49] Choi B, Jo S, Bae M, et al. (2016) Binary CMOS image sensor with a gate/body-tied MOSFET-type photodetector for high-speed operation. In: Image Sensing Technologies: Materials, Devices, Systems, and Applications 9854: 98540Z.
    [50] Jo S, Bae M, Choi B (2015) Linear-Logarithmic Wide-Dynamic-Range Active Pixel Sensor with Negative Feedback Structure Using Gate / Body-Tied Photodetector with an Overlapping Control Gate. Sensor Mater 27: 97–105.
    [51] Goiffon V, Estribeau M, Michelot J, et al. (2014) Pixel level characterization of pinned photodiode and transfer gate physical parameters in CMOS image sensors. IEEE Journal of the Electron Devices Society 2: 65–76. doi: 10.1109/JEDS.2014.2326299
    [52] Fossum ER, Hondongwa DB (2014) A review of the pinned photodiode for CCD and CMOS image sensors. IEEE Journal of the Electron Devices Society 2: 33–43. doi: 10.1109/JEDS.2014.2306412
    [53] Structures C, Murari K, Member S, et al. (2009) Which Photodiode to Use : A Comparison of.IEEE SENSORS JOURNAL 9: 752–760. doi: 10.1109/JSEN.2009.2021805
    [54] Chowdhury S, Banerjee A (2008) A high speed 8 transistor full adder design using novel 3 transistor XOR gates. International Journal of Electronics and Communication Engineering 2: 2244–2250.
    [55] Tabet M (2002) Double Sampling Techniques for CMOS Image Sensors. University of Waterloo.
    [56] 
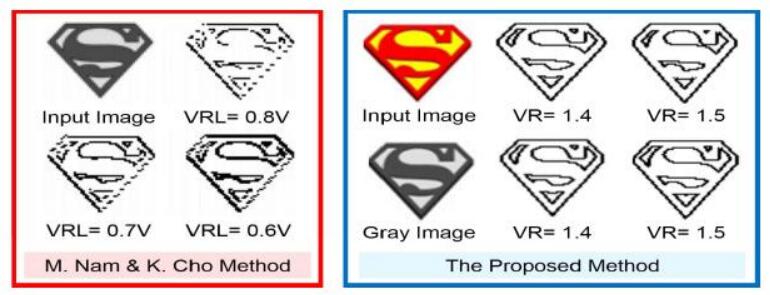
Nam M, Cho K (2018) Implementation of real-time image edge detector based on a bump circuit and active pixels in a CMOS image sensor. Integration 60: 56–62. doi: 10.1016/j.vlsi.2017.07.005
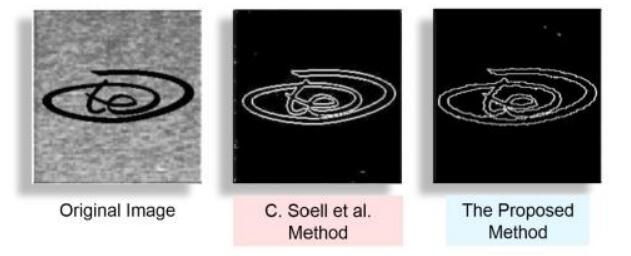
    [57] Soell C, Shi L, Roeber J, et al. (2016) Low-power analog smart camera sensor for edge detection. In: 2016 IEEE International Conference on Image Processing (ICIP), pp. 4408–4412.
    [58] Lee C, Chao W, Lee S, et al. (2015) A Low-Power Edge Detection Image Sensor Based on Parallel Digital Pulse Computation. IEEE Transactions on Circuits and Systems II: Express Briefs 62: 1043–1047. doi: 10.1109/TCSII.2015.2455354
    [59] 
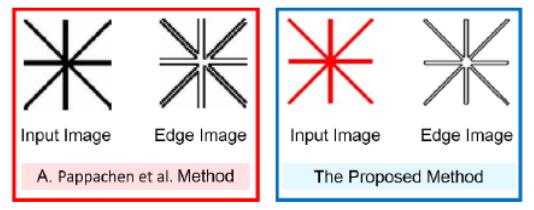
James A, Pachentavida A, Sugathan S (2014) Edge detection using resistive threshold logic networks with CMOS flash memories. International Journal of Intelligent Computing and Cybernetics 7: 79–94. doi: 10.1108/IJICC-06-2013-0032
  • This article has been cited by:

    1. Yongjiu Feng, Yilun Zhou, Yanling Chen, Pengshuo Li, Mengrong Xi, Xiaohua Tong, Automatic selection of permanent scatterers-based GCPs for refinement and reflattening in InSAR DEM generation, 2022, 15, 1753-8947, 954, 10.1080/17538947.2022.2070678
    2. Weitao Liu, Qiushuang Zheng, Lifu Pang, Weimeng Dou, Xiangxi Meng, Study of roof water inrush forecasting based on EM-FAHP two-factor model, 2021, 18, 1551-0018, 4987, 10.3934/mbe.2021254
    3. Dan Wang, Yier Lin, Liang Hong, Ce Zhang, Yajie Bai, Zhen Zhen Bi, Naeem Jan, Detection of the Driver’s Mental Workload Level in Smart and Autonomous Systems Using Physiological Signals, 2022, 2022, 1563-5147, 1, 10.1155/2022/5233257
    4. Yun Wang, Songpeng Wang, Ram Bilas Pachori, Lei Chen, 2024, Surface deformation monitoring and analysis using PS-inSAR in Bortala Mongol Autonomous Prefecture, 9781510680012, 127, 10.1117/12.3029813
  • Reader Comments
  • © 2019 the Author(s), licensee AIMS Press. This is an open access article distributed under the terms of the Creative Commons Attribution License (http://creativecommons.org/licenses/by/4.0)
通讯作者: 陈斌, bchen63@163.com
  • 1. 

    沈阳化工大学材料科学与工程学院 沈阳 110142

  1. 本站搜索
  2. 百度学术搜索
  3. 万方数据库搜索
  4. CNKI搜索

Metrics

Article views(10229) PDF downloads(3233) Cited by(2)

Figures and Tables

Figures(24)  /  Tables(1)

Other Articles By Authors

/

DownLoad:  Full-Size Img  PowerPoint
Return
Return

Catalog