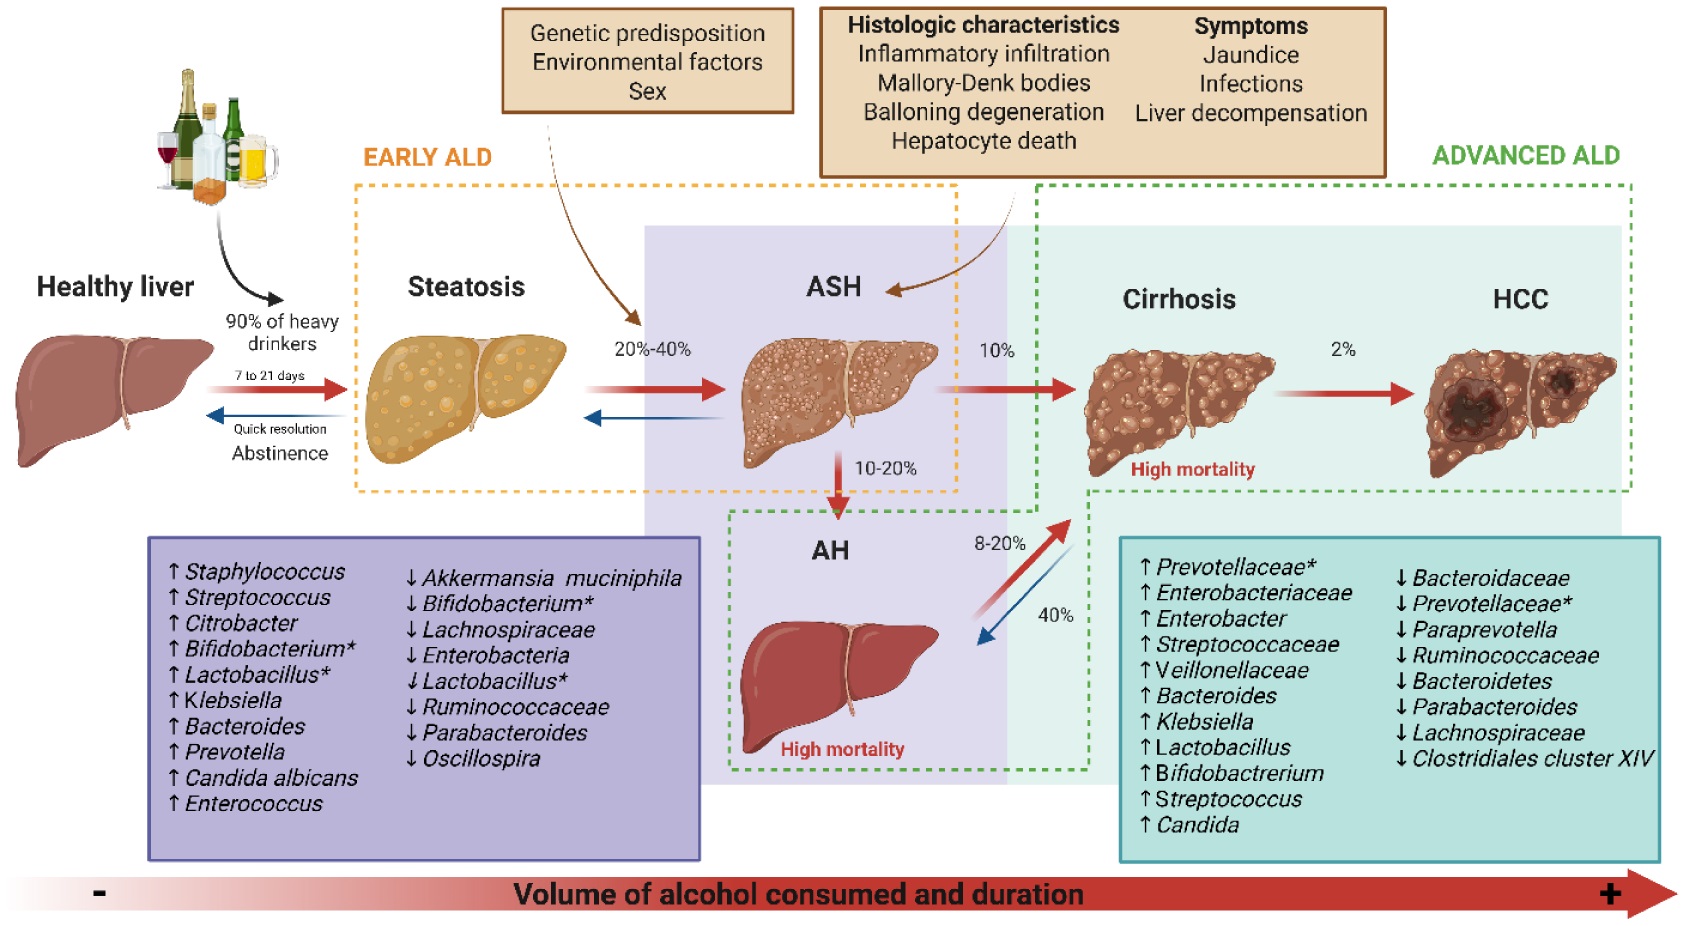
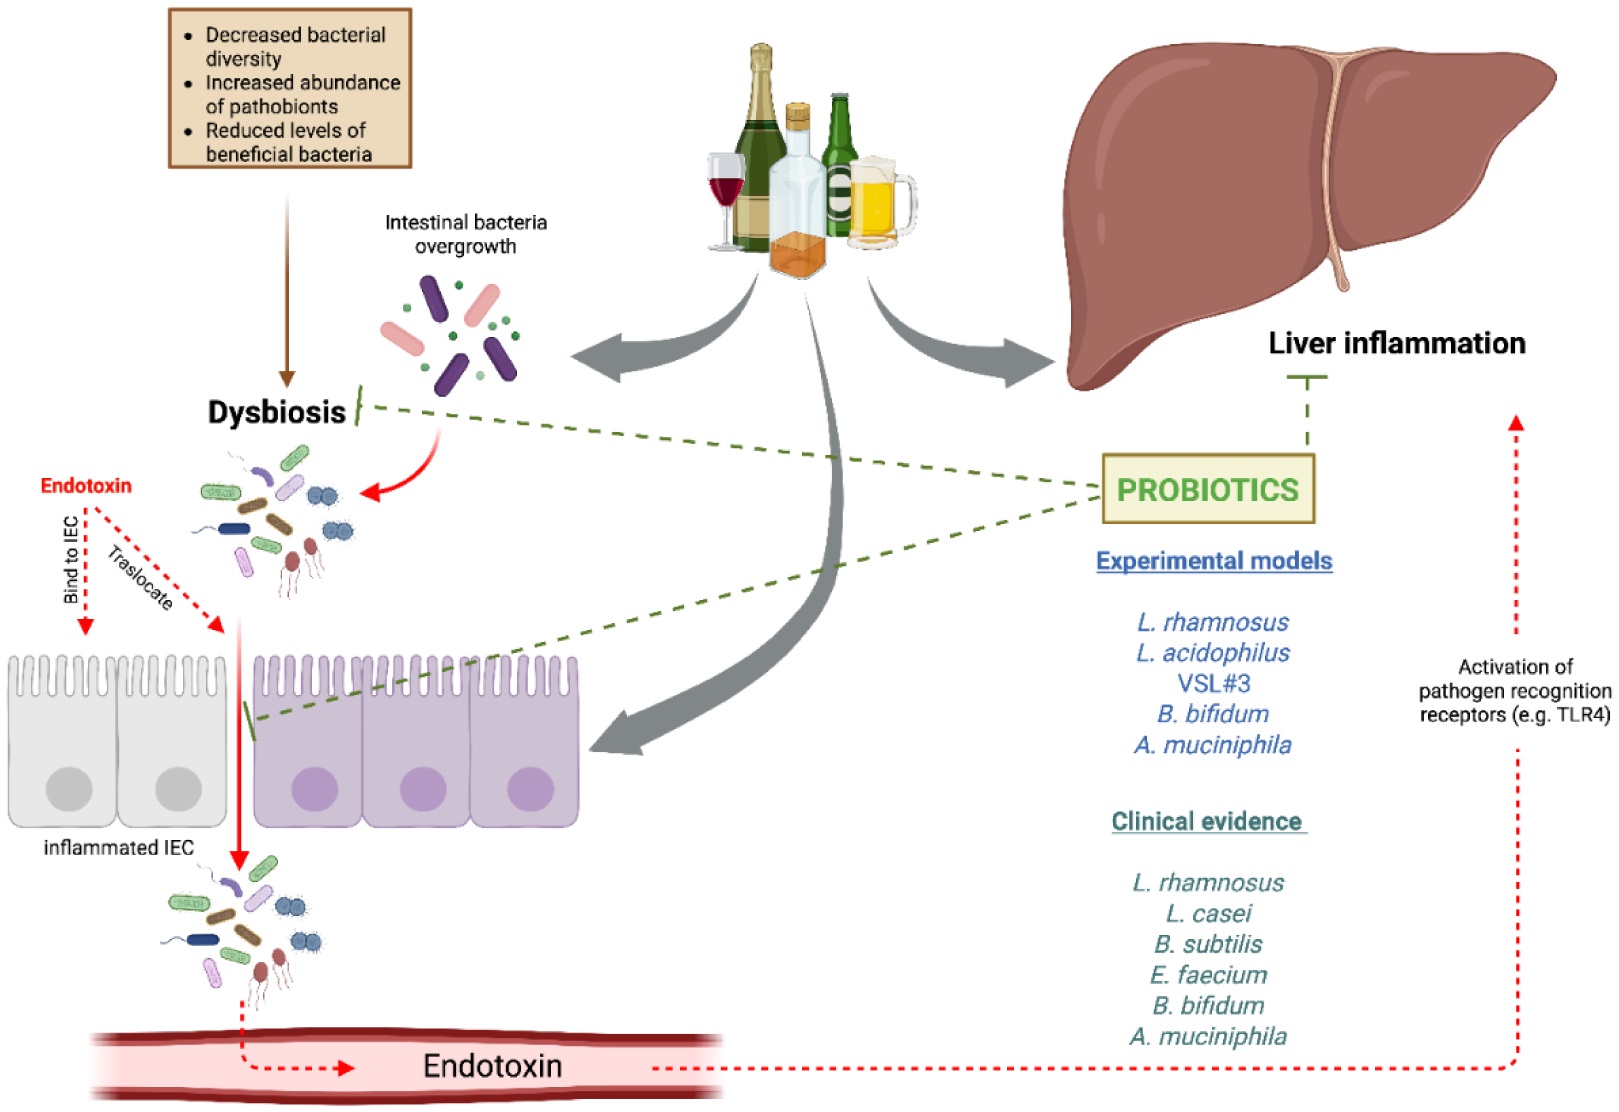
Alcohol consumption represents a major global health issue, accounting for approximately 4.7% of annual deaths and 5.1% of the disease burden worldwide. The liver is particularly vulnerable to alcohol-related damage, with chronic alcohol use leading to a spectrum of alcohol-associated liver diseases, including fatty liver, alcohol-associated hepatitis, cirrhosis, and hepatocellular carcinoma. Despite public awareness of the risks associated with excessive alcohol intake, a substantial proportion of the global population continues to consume alcohol, contributing to the increased incidence of liver-related conditions. Dysbiosis of the gut microbiota has emerged as a critical factor in the pathogenesis of alcohol-associated liver diseases, as alcohol consumption alters microbial composition and increases intestinal permeability, which contributes to systemic inflammation and liver injury through the translocation of endotoxins. Recent research into the therapeutic potential of probiotics, prebiotics, and synbiotics highlights their ability to restore microbial balance and enhance intestinal barrier function. Studies demonstrate that these interventions can significantly improve liver enzymes and reduce inflammation, suggesting their complementary role in the management of alcohol-associated liver diseases. However, further research is necessary to elucidate optimal dosing strategies and long-term efficacy. This review underscores the importance of a multifaceted approach toward understanding alcohol-associated liver diseases and the therapeutic potential of modulating the gut-liver axis through microbiota-targeted strategies.
Citation: María José Lorenzo Pisarello, Antonela Marquez, Adriana Perez Chaia, Jaime Daniel Babot. Targeting gut health: Probiotics as promising therapeutics in alcohol-related liver disease management[J]. AIMS Microbiology, 2025, 11(2): 410-435. doi: 10.3934/microbiol.2025019
Alcohol consumption represents a major global health issue, accounting for approximately 4.7% of annual deaths and 5.1% of the disease burden worldwide. The liver is particularly vulnerable to alcohol-related damage, with chronic alcohol use leading to a spectrum of alcohol-associated liver diseases, including fatty liver, alcohol-associated hepatitis, cirrhosis, and hepatocellular carcinoma. Despite public awareness of the risks associated with excessive alcohol intake, a substantial proportion of the global population continues to consume alcohol, contributing to the increased incidence of liver-related conditions. Dysbiosis of the gut microbiota has emerged as a critical factor in the pathogenesis of alcohol-associated liver diseases, as alcohol consumption alters microbial composition and increases intestinal permeability, which contributes to systemic inflammation and liver injury through the translocation of endotoxins. Recent research into the therapeutic potential of probiotics, prebiotics, and synbiotics highlights their ability to restore microbial balance and enhance intestinal barrier function. Studies demonstrate that these interventions can significantly improve liver enzymes and reduce inflammation, suggesting their complementary role in the management of alcohol-associated liver diseases. However, further research is necessary to elucidate optimal dosing strategies and long-term efficacy. This review underscores the importance of a multifaceted approach toward understanding alcohol-associated liver diseases and the therapeutic potential of modulating the gut-liver axis through microbiota-targeted strategies.

| [1] | World health OrganizationGlobal status report on alcohol and health and treatment of substance use disorders, 2024 (2024). Available from: https://www.who.int/publications/i/item/9789240096745 |
| [2] |
Thursz M, Gual A, Lackner C, et al. (2018) EASL clinical practice guidelines: Management of alcohol-related liver disease. J Hepatol 69: 154-181. https://doi.org/10.1016/j.jhep.2018.03.018 
|
| [3] |
Han S, Yang Z, Zhang T, et al. (2021) Epidemiology of alcohol-associated liver disease. Clin Liver Dis 25: 483-492. https://doi.org/10.1016/j.cld.2021.03.009
|
| [4] |
Narro GEC, Díaz LA, Ortega EK, et al. (2024) Alcohol-related liver disease: A global perspective. Ann Hepatol 29: 101499. https://doi.org/10.1016/j.aohep.2024.101499
|
| [5] | Camarotti AC, Jones D, Güelman M, et al. (2020) Changes in behaviors of alcohol consumption in the context of quarantine for COVID-19. A study in the Buenos Aires Metropolitan Area (Argentina). Rev Salud Pública : 37-50. Available from: https://revistas.unc.edu.ar/index.php/RSD/article/view/29140 |
| [6] | Conde K, Gimenez PV, Salomón T, et al. (2021) Before and after the pandemic: Alcohol consumption and related problems in Argentina. Rev Interam Psicol J Psychol 55: e1444. https://doi.org/10.30849/ripijp.v55i1.1444 |
| [7] |
Karadayian A, Merlo A, Czerniczyniec A, et al. (2023) Alcohol consumption, hangovers, and smoking among Buenos Aires University students during the COVID-19 pandemic. J Clin Med 12: 1491. https://doi.org/10.3390/jcm12041491
|
| [8] |
Devarbhavi H, Asrani SK, Arab JP, et al. (2023) Global burden of liver disease: 2023 update. J Hepatol 79: 516-537. https://doi.org/10.1016/j.jhep.2023.03.017
|
| [9] |
Fedeli U, Amidei CB, Casotto V, et al. (2023) Mortality from chronic liver disease: Recent trends and impact of the COVID-19 pandemic. World J Gastroenterol 29: 4166-4173. https://doi.org/10.3748/wjg.v29.i26.4166
|
| [10] |
Amonker S, Houshmand A, Hinkson A, et al. (2023) Prevalence of alcohol-associated liver disease: A systematic review and meta-analysis. Hepatol Commun 7: e0133. https://doi.org/10.1097/HC9.0000000000000133
|
| [11] |
Parker R (2020) The natural history of alcohol-related liver disease. Curr Opin Gastroenterol 36: 164-168. https://doi.org/10.1097/MOG.0000000000000627
|
| [12] |
Torruellas C, French SW, Medici V (2014) Diagnosis of alcoholic liver disease. World J Gastroenterol WJG 20: 11684-11699. https://doi.org/10.3748/wjg.v20.i33.11684
|
| [13] |
Thomes PG, Rasineni K, Saraswathi V, et al. (2021) Natural recovery by the liver and other organs after chronic alcohol use. Alcohol Res Curr Rev 41: 05. https://doi.org/10.35946/arcr.v41.1.05
|
| [14] |
Hernández-Évole H, Jiménez-Esquivel N, Pose E, et al. (2024) Alcohol-associated liver disease: Epidemiology and management. Ann Hepatol 29: 101162. https://doi.org/10.1016/j.aohep.2023.101162
|
| [15] |
Mitra S, De A, Chowdhury A (2020) Epidemiology of non-alcoholic and alcoholic fatty liver diseases. Transl Gastroenterol Hepatol 5: 16. https://doi.org/10.21037/tgh.2019.09.08
|
| [16] |
Ventura-Cots M, Ballester-Ferré MP, Ravi S, et al. (2019) Public health policies and alcohol-related liver disease. JHEP Rep 1: 403-413. https://doi.org/10.1016/j.jhepr.2019.07.009
|
| [17] |
Yan C, Hu W, Tu J, et al. (2023) Pathogenic mechanisms and regulatory factors involved in alcoholic liver disease. J Transl Med 21: 300. https://doi.org/10.1186/s12967-023-04166-8
|
| [18] |
Das SK, Vasudevan DM (2007) Alcohol-induced oxidative stress. Life Sci 81: 177-187. https://doi.org/10.1016/j.lfs.2007.05.005
|
| [19] |
Liu SY, Tsai IT, Hsu YC (2021) Alcohol-related liver disease: Basic mechanisms and clinical perspectives. Int J Mol Sci 22: 5170. https://doi.org/10.3390/ijms22105170
|
| [20] |
Yang YM, Cho YE, Hwang S (2022) Crosstalk between oxidative stress and inflammatory liver injury in the pathogenesis of alcoholic liver disease. Int J Mol Sci 23: 774. https://doi.org/10.3390/ijms23020774
|
| [21] |
French SW (2001) Intragastric ethanol infusion model for cellular and molecular studies of alcoholic liver disease. J Biomed Sci 8: 20-27. https://doi.org/10.1159/000054009
|
| [22] | Fleming S, Toratani S, Shea-Donohue T, et al. (2001) Pro- and anti-inflammatory gene expression in the murine small intestine and liver after chronic exposure to alcohol. Alcohol Clin Exp Res 25: 579-589. https://doi.org/10.1111/j.1530-0277.2001.tb02253.x |
| [23] |
Mendes BG, Schnabl B (2020) From intestinal dysbiosis to alcohol-associated liver disease. Clin Mol Hepatol 26: 595-605. https://doi.org/10.3350/cmh.2020.0086
|
| [24] |
Fairfield B, Schnabl B (2021) Gut dysbiosis as a driver in alcohol-induced liver injury. JHEP Rep 3: 100220. https://doi.org/10.1016/j.jhepr.2020.100220
|
| [25] |
Hartmann P, Chu H, Duan Y, et al. (2019) Gut microbiota in liver disease: Too much is harmful, nothing at all is not helpful either. Am J Physiol-Gastrointest Liver Physiol 316: G563-G573. https://doi.org/10.1152/ajpgi.00370.2018
|
| [26] |
Schnabl B (2013) Linking intestinal homeostasis and liver disease. Curr Opin Gastroenterol 29: 264-270. https://doi.org/10.1097/MOG.0b013e32835ff948
|
| [27] |
Alvarez-Payares JC, Bello-Simanca JD, De La Peña-Arrieta EDJ, et al. (2021) Common pitfalls in the interpretation of endocrine tests. Front Endocrinol 12: 1-14. https://doi.org/10.3389/fendo.2021.727628
|
| [28] |
Tadokoro T, Morishita A, Himoto T, et al. (2023) Nutritional support for alcoholic liver disease. Nutrients 15: 1360. https://doi.org/10.3390/nu15061360
|
| [29] |
Adekunle AD, Adejumo A, Singal AK (2023) Therapeutic targets in alcohol-associated liver disease: Progress and challenges. Ther Adv Gastroenterol 16: 17562848231170946. https://doi.org/10.1177/17562848231170946
|
| [30] |
Rangra S, Rana D, Prajapati A, et al. (2024) Nutritional and microbiota-based therapeutic interventions for alcohol-associated liver disease: From pathogenesis to therapeutic insights. Life Sci 352: 122852. https://doi.org/10.1016/j.lfs.2024.122852
|
| [31] |
Vidya Bernhardt G, Shivappa P, Pinto JR, et al. (2024) Probiotics—role in alleviating the impact of alcohol liver disease and alcohol deaddiction: A systematic review. Front Nutr 11: 1372755. https://doi.org/10.3389/fnut.2024.1372755
|
| [32] |
Mullish BH, Thursz MR (2024) Alcohol-associated liver disease: Emerging therapeutic strategies. Hepatology 80: 1372-1389. https://doi.org/10.1097/HEP.0000000000000986
|
| [33] |
Hou K, Wu ZX, Chen XY, et al. (2022) Microbiota in health and diseases. Signal Transduct Target Ther 7: 1-28. https://doi.org/10.1038/s41392-022-00974-4
|
| [34] |
Tripathi A, Debelius J, Brenner DA, et al. (2018) The gut–liver axis and the intersection with the microbiome. Nat Rev Gastroenterol Hepatol 15: 397-411. https://doi.org/10.1038/s41575-018-0011-z
|
| [35] |
Ciocan D, Spatz M, Trainel N, et al. (2022) Modulation of the bile acid enterohepatic cycle by intestinal microbiota alleviates alcohol liver disease. Cells 11: 968. https://doi.org/10.3390/cells11060968
|
| [36] |
Ridlon JM, Kang DJ, Hylemon PB, et al. (2015) Gut microbiota, cirrhosis and alcohol regulate bile acid metabolism in the gut. Dig Dis Basel Switz 33: 338-345. https://doi.org/10.1159/000371678
|
| [37] |
Schnabl B, Brenner DA (2014) Interactions between the intestinal microbiome and liver diseases. Gastroenterology 146: 1513-1524. https://doi.org/10.1053/j.gastro.2014.01.020
|
| [38] |
Hsu CL, Schnabl B (2023) The gut–liver axis and gut microbiota in health and liver disease. Nat Rev Microbiol 21: 719-733. https://doi.org/10.1038/s41579-023-00904-3
|
| [39] |
Wang W, Wang C, Xu H, et al. (2020) Aldehyde dehydrogenase, liver disease and cancer. Int J Biol Sci 16: 921-934. https://doi.org/10.7150/ijbs.42300
|
| [40] |
Leclercq S, De Saeger C, Delzenne N, et al. (2014) Role of inflammatory pathways, blood mononuclear cells, and gut-derived bacterial products in alcohol dependence. Biol Psychiatry 76: 725-733. https://doi.org/10.1016/j.biopsych.2014.02.003
|
| [41] |
Xu J, Chen N, Li Z, et al. (2025) Gut microbiome and liver diseases. Fundam Res 5: 890-901. https://doi.org/10.1016/j.fmre.2024.09.007
|
| [42] |
Shasthry SM (2020) Fecal microbiota transplantation in alcohol related liver diseases. Clin Mol Hepatol 26: 294-301. https://doi.org/10.3350/cmh.2020.0057
|
| [43] |
Zeng S, Rosati E, Saggau C, et al. (2023) Candida albicans-specific Th17 cell-mediated response contributes to alcohol-associated liver disease. Cell Host Microbe 31: 389-404.e7. https://doi.org/10.1016/j.chom.2023.02.001
|
| [44] |
Jiang L, Lang S, Duan Y, et al. (2020) Intestinal virome in patients with alcoholic hepatitis. Hepatology 72: 2182-2196. https://doi.org/10.1002/hep.31459
|
| [45] |
Chen L, Hou X, Chu H (2023) The novel role of phage particles in chronic liver diseases. Microorganisms 11: 1181. https://doi.org/10.3390/microorganisms11051181
|
| [46] |
Hsu CL, Zhang X, Jiang L, et al. (2022) Intestinal virome in patients with alcohol use disorder and after abstinence. Hepatol Commun 6: 2058-2069. https://doi.org/10.1002/hep4.1947
|
| [47] |
Grander C, Adolph TE, Wieser V, et al. (2018) Recovery of ethanol-induced Akkermansia muciniphila depletion ameliorates alcoholic liver disease. Gut 67: 891-901. https://doi.org/10.1136/gutjnl-2016-313432
|
| [48] |
Leclercq S, Matamoros S, Cani PD, et al. (2014) Intestinal permeability, gut-bacterial dysbiosis, and behavioral markers of alcohol-dependence severity. Proc Natl Acad Sci 111: E4485-E4493. https://doi.org/10.1073/pnas.1415174111
|
| [49] |
Addolorato G, Mirijello A, Leggio L, et al. (2013) Management of alcohol dependence in patients with liver disease. CNS Drugs 27: 287-299. https://doi.org/10.1007/s40263-013-0043-4
|
| [50] |
Kirpich IA, McClain CJ, Vatsalya V, et al. (2017) Liver injury and endotoxemia in male and female alcohol-dependent individuals admitted to an alcohol treatment program. Alcohol Clin Exp Res 41: 747-757. https://doi.org/10.1111/acer.13346
|
| [51] |
Li W, Gao W, Yan S, et al. (2025) Gut microbiota as emerging players in the development of alcohol-related liver disease. Biomedicines 13: 74. https://doi.org/10.3390/biomedicines13010074
|
| [52] |
Kirpich IA, Solovieva NV, Leikhter SN, et al. (2008) Probiotics restore bowel flora and improve liver enzymes in human alcohol-induced liver injury: A pilot study. Alcohol Fayettev N 42: 675-682. https://doi.org/10.1016/j.alcohol.2008.08.006
|
| [53] |
Raya Tonetti F, Eguileor A, Mrdjen M, et al. (2024) Gut-liver axis: Recent concepts in pathophysiology in alcohol-associated liver disease. Hepatology 80: 1342-1371. https://doi.org/10.1097/HEP.0000000000000924
|
| [54] |
Pant K, Venugopal SK, Lorenzo Pisarello MJ, et al. (2023) The role of gut microbiome-derived short-chain fatty acid butyrate in hepatobiliary diseases. Am J Pathol 193: 1455-1467. https://doi.org/10.1016/j.ajpath.2023.06.007
|
| [55] |
Visekruna A, Luu M (2021) The role of short-chain fatty acids and bile acids in intestinal and liver function, inflammation, and carcinogenesis. Front Cell Dev Biol 9: 703218. https://doi.org/10.3389/fcell.2021.703218
|
| [56] |
Sosnowski K, Przybyłkowski A (2024) Ethanol-induced changes to the gut microbiome compromise the intestinal homeostasis: A review. Gut Microbes 16: 2393272. https://doi.org/10.1080/19490976.2024.2393272
|
| [57] |
Szabo G (2015) Gut–liver axis in alcoholic liver disease. Gastroenterology 148: 30-36. https://doi.org/10.1053/j.gastro.2014.10.042
|
| [58] |
Alvarado-Tapias E, Pose E, Gratacós-Ginès J, et al. (2025) Alcohol-associated liver disease: Natural history, management and novel targeted therapies. Clin Mol Hepatol 31: S112-S133. https://doi.org/10.3350/cmh.2024.0709
|
| [59] |
Chen X, Zhang Z, Cui B, et al. (2020) Combination of chronic alcohol consumption and high-salt intake elicits gut microbial alterations and liver steatosis in mice. J Agric Food Chem 68: 1750-1759. https://doi.org/10.1021/acs.jafc.9b07368
|
| [60] |
Arab JP, Arrese M, Shah VH (2020) Gut microbiota in non-alcoholic fatty liver disease and alcohol-related liver disease: Current concepts and perspectives. Hepatol Res 50: 407-418. https://doi.org/10.1111/hepr.13473
|
| [61] |
Li F, Jiang C, Krausz KW, et al. (2013) Microbiome remodelling leads to inhibition of intestinal farnesoid X receptor signalling and decreased obesity. Nat Commun 4: 2384. https://doi.org/10.1038/ncomms3384
|
| [62] |
Ridlon JM, Kang DJ, Hylemon PB, et al. (2014) Bile acids and the gut microbiome. Curr Opin Gastroenterol 30: 332-338. https://doi.org/10.1097/MOG.0000000000000057
|
| [63] |
Gao B, Emami A, Nath S, et al. (2021) Microbial products and metabolites contributing to alcohol-related liver disease. Mol Nutr Food Res 65: 2000023. https://doi.org/10.1002/mnfr.202000023
|
| [64] |
Grondin JA, Khan WI (2024) Emerging roles of gut serotonin in regulation of immune response, microbiota composition and intestinal inflammation. J Can Assoc Gastroenterol 7: 88-96. https://doi.org/10.1093/jcag/gwad020
|
| [65] |
Shukla S, Hsu CL (2025) Alcohol use disorder and the gut–brain axis: A narrative review of the role of gut microbiota and implications for treatment. Microorganisms 13: 67. https://doi.org/10.3390/microorganisms13010067
|
| [66] |
Albillos A, de Gottardi A, Rescigno M (2020) The gut-liver axis in liver disease: Pathophysiological basis for therapy. J Hepatol 72: 558-577. https://doi.org/10.1016/j.jhep.2019.10.003
|
| [67] |
Kaufmann B, Seyfried N, Hartmann D, et al. (2023) Probiotics, prebiotics, and synbiotics in nonalcoholic fatty liver disease and alcohol-associated liver disease. Am J Physiol-Gastrointest Liver Physiol 325: G42-G61. https://doi.org/10.1152/ajpgi.00017.2023
|
| [68] |
Vallianou NG, Kounatidis D, Psallida S, et al. (2024) NAFLD/MASLD and the gut–liver axis: From pathogenesis to treatment options. Metabolites 14: 366. https://doi.org/10.3390/metabo14070366
|
| [69] |
Del Barrio M, Lavín L, Santos-Laso Á, et al. (2023) Faecal microbiota transplantation, paving the way to treat non-alcoholic fatty liver disease. Int J Mol Sci 24: 6123. https://doi.org/10.3390/ijms24076123
|
| [70] |
Jiménez-González C, Vallejo I, Sordo D, et al. (2024) Assessing the therapeutic potential of fecal microbiota transplantation in steatotic liver disease: Current insights and future pathways. Curr Hepatol Rep 23: 435-444. https://doi.org/10.1007/s11901-024-00670-7
|
| [71] |
Shah YR, Ali H, Tiwari A, et al. (2024) Role of fecal microbiota transplant in management of hepatic encephalopathy: Current trends and future directions. World J Hepatol 16: 17-32. https://doi.org/10.4254/wjh.v16.i1.17
|
| [72] |
Litwinowicz K, Gamian A (2023) Microbiome alterations in alcohol use disorder and alcoholic liver disease. Int J Mol Sci 24: 2461. https://doi.org/10.3390/ijms24032461
|
| [73] |
Calzadilla N, Zilberstein N, Hanscom M, et al. (2024) Serum metabolomic analysis in cirrhotic alcohol-associated liver disease patients identified differentially altered microbial metabolites and novel potential biomarkers for disease severity. Dig Liver Dis 56: 923-931. https://doi.org/10.1016/j.dld.2023.10.006
|
| [74] |
Jew MH, Hsu CL (2023) Alcohol, the gut microbiome, and liver disease. J Gastroenterol Hepatol 38: 1205-1210. https://doi.org/10.1111/jgh.16199
|
| [75] |
Skladany L, Kubanek N, Adamcova Selcanova S, et al. (2024) 3PM-guided innovation in treatments of severe alcohol-associated hepatitis utilizing fecal microbiota transplantation. EPMA J 15: 677-692. https://doi.org/10.1007/s13167-024-00381-5
|
| [76] |
Ganesan R, Suk KT (2022) Microbiome and metabolomics in alcoholic liver disease. Clin Mol Hepatol 28: 580-582. https://doi.org/10.3350/cmh.2022.0171
|
| [77] |
Ryu T, Kim K, Choi SE, et al. (2023) New insights in the pathogenesis of alcohol-related liver disease: The metabolic, immunologic, and neurologic pathways. Liver Res 7: 1-8. https://doi.org/10.1016/j.livres.2022.09.004
|
| [78] |
Bloom PP, Bajaj JS (2024) The current and future state of microbiome therapeutics in liver disease. Off J Am Coll Gastroenterol ACG 119: S36-S41. https://doi.org/10.14309/ajg.0000000000003009
|
| [79] |
Hill C, Guarner F, Reid G, et al. (2014) Expert consensus document. The International Scientific Association for Probiotics and Prebiotics consensus statement on the scope and appropriate use of the term probiotic. Nat Rev Gastroenterol Hepatol 11: 506-514. https://doi.org/10.1038/nrgastro.2014.66
|
| [80] |
Binda S, Hill C, Johansen E, et al. (2020) Criteria to qualify microorganisms as “probiotic” in foods and dietary supplements. Front Microbiol 11: 1662. https://doi.org/10.3389/fmicb.2020.01662
|
| [81] |
Zavišić G, Ristić S, Petković B, et al. (2023) Microbiological quality of probiotic products. Arh Za Farm 73: 17-34. https://doi.org/10.5937/arhfarm73-42160
|
| [82] |
Tsai YL, Lin TL, Chang CJ, et al. (2019) Probiotics, prebiotics and amelioration of diseases. J Biomed Sci 26: 3. https://doi.org/10.1186/s12929-018-0493-6
|
| [83] |
Li HY, Zhou DD, Gan RY, et al. (2021) Effects and mechanisms of probiotics, prebiotics, synbiotics, and postbiotics on metabolic diseases targeting gut microbiota: A narrative review. Nutrients 13: 3211. https://doi.org/10.3390/nu13093211
|
| [84] |
Ji J, Jin W, Liu SJ, et al. (2023) Probiotics, prebiotics, and postbiotics in health and disease. MedComm 4: e420. https://doi.org/10.1002/mco2.420
|
| [85] |
Gibson GR, Hutkins R, Sanders ME, et al. (2017) Expert consensus document: The International Scientific Association for Probiotics and Prebiotics (ISAPP) consensus statement on the definition and scope of prebiotics. Nat Rev Gastroenterol Hepatol 14: 491-502. https://doi.org/10.1038/nrgastro.2017.75
|
| [86] |
Swanson KS, Gibson GR, Hutkins R, et al. (2020) The International Scientific Association for Probiotics and Prebiotics (ISAPP) consensus statement on the definition and scope of synbiotics. Nat Rev Gastroenterol Hepatol 17: 687-701. https://doi.org/10.1038/s41575-020-0344-2
|
| [87] |
Thilakarathna WPDW, Rupasinghe HPV (2024) Proanthocyanidins-based synbiotics as a novel strategy for nonalcoholic fatty liver disease (NAFLD) risk reduction. Molecules 29: 709. https://doi.org/10.3390/molecules29030709
|
| [88] |
Salminen S, Collado MC, Endo A, et al. (2021) The International Scientific Association of Probiotics and Prebiotics (ISAPP) consensus statement on the definition and scope of postbiotics. Nat Rev Gastroenterol Hepatol 18: 649-667. https://doi.org/10.1038/s41575-021-00440-6
|
| [89] |
Siciliano RA, Reale A, Mazzeo MF, et al. (2021) Paraprobiotics: A new perspective for functional foods and nutraceuticals. Nutrients 13: 1225. https://doi.org/10.3390/nu13041225
|
| [90] |
Rodríguez-Pastén A, Pérez-Hernández N, Añorve-Morga J, et al. (2022) The activity of prebiotics and probiotics in hepatogastrointestinal disorders and diseases associated with metabolic syndrome. Int J Mol Sci 23: 7229. https://doi.org/10.3390/ijms23137229
|
| [91] |
Mishra G, Singh P, Molla M, et al. (2023) Harnessing the potential of probiotics in the treatment of alcoholic liver disorders. Front Pharmacol 14: 1212742. https://doi.org/10.3389/fphar.2023.1212742
|
| [92] |
Barbuti RC, Schiavon LL, Oliveira CP, et al. (2020) Gut microbiota, prebiotics, probiotics, and synbiotics in gastrointestinal and liver diseases: Proceedings of a joint meeting of the Brazilian Society of Hepatology (SBH), Brazilian Nucleus for the Study of Helicobacter pylori and Microbiota (NBEHPM), and Brazilian Federation of Gastroenterology (FBG). Arq Gastroenterol 57: 381-398. https://doi.org/10.1590/S0004-2803.202000000-72
|
| [93] | Argemi J, Ventura-Cots M, Rachakonda V, et al. (2020) Alcoholic-related liver disease: Pathogenesis, management and future therapeutic developments. Rev Esp Enfermedades Dig 112: 869-878. https://doi.org/10.17235/reed.2020.7242/2020 |
| [94] |
Yoon EL, Kim W (2023) Current and future treatment for alcoholic-related liver diseases. J Gastroenterol Hepatol 38: 1218-1226. https://doi.org/10.1111/jgh.16257
|
| [95] |
Nanji AA, Sadrzadeh SMH, Dannenberg AJ (1994) Liver microsomal fatty acid composition in ethanol-fed rats: Effect of different dietary fats and relationship to liver injury. Alcohol Clin Exp Res 18: 1024-1028. https://doi.org/10.1111/j.1530-0277.1994.tb00077.x
|
| [96] |
Marotta F, Barreto R, Wu C, et al. (2005) Experimental acute alcohol pancreatitis-related liver damage and endotoxemia: Synbiotics but not metronidazole have a protective effect. Chin J Dig Dis 6: 193-197. https://doi.org/10.1111/j.1443-9573.2005.00230.x
|
| [97] |
Forsyth CB, Farhadi A, Jakate SM, et al. (2009) Lactobacillus GG treatment ameliorates alcohol-induced intestinal oxidative stress, gut leakiness, and liver injury in a rat model of alcoholic steatohepatitis. Alcohol Fayettev N 43: 163-172. https://doi.org/10.1016/j.alcohol.2008.12.009
|
| [98] |
Zhao H, Zhao C, Dong Y, et al. (2015) Inhibition of miR122a by Lactobacillus rhamnosus GG culture supernatant increases intestinal occludin expression and protects mice from alcoholic liver disease. Toxicol Lett 234: 194-200. https://doi.org/10.1016/j.toxlet.2015.03.002
|
| [99] |
Ye D, Guo S, Al–Sadi R, et al. (2011) MicroRNA regulation of intestinal epithelial tight junction permeability. Gastroenterology 141: 1323-1333. https://doi.org/10.1053/j.gastro.2011.07.005
|
| [100] |
Furuta GT, Turner JR, Taylor CT, et al. (2001) Hypoxia-inducible factor 1–dependent induction of intestinal trefoil factor protects barrier function during hypoxia. J Exp Med 193: 1027-1034. https://doi.org/10.1084/jem.193.9.1027
|
| [101] |
Lindemans CA, Calafiore M, Mertelsmann AM, et al. (2015) Interleukin-22 promotes intestinal-stem-cell-mediated epithelial regeneration. Nature 528: 560-564. https://doi.org/10.1038/nature16460
|
| [102] |
Khailova L, Dvorak K, Arganbright KM, et al. (2009) Bifidobacterium bifidum improves intestinal integrity in a rat model of necrotizing enterocolitis. Am J Physiol-Gastrointest Liver Physiol 297: G940-G949. https://doi.org/10.1152/ajpgi.00141.2009
|
| [103] |
Chang B, Sang L, Wang Y, et al. (2013) The protective effect of VSL#3 on intestinal permeability in a rat model of alcoholic intestinal injury. BMC Gastroenterol 13: 151. https://doi.org/10.1186/1471-230X-13-151
|
| [104] | Huang H, Lin Z, Zeng Y, et al. (2019) Probiotic and glutamine treatments attenuate alcoholic liver disease in a rat model. Exp Ther Med 18: 4733-4739. https://doi.org/10.3892/etm.2019.8123 |
| [105] |
Mutlu E, Keshavarzian A, Engen P, et al. (2009) Intestinal dysbiosis: A possible mechanism of alcohol-induced endotoxemia and alcoholic steatohepatitis in rats. Alcohol Clin Exp Res 33: 1836-1846. https://doi.org/10.1111/j.1530-0277.2009.01022.x
|
| [106] |
Han SH, Suk KT, Kim DJ, et al. (2015) Effects of probiotics (cultured Lactobacillus subtilis/Streptococcus faecium) in the treatment of alcoholic hepatitis: Randomized-controlled multicenter study. Eur J Gastroenterol Hepatol 27: 1300-1306. https://doi.org/10.1097/MEG.0000000000000458
|
| [107] |
Stadlbauer V, Mookerjee RP, Hodges S, et al. (2008) Effect of probiotic treatment on deranged neutrophil function and cytokine responses in patients with compensated alcoholic cirrhosis. J Hepatol 48: 945-951. https://doi.org/10.1016/j.jhep.2008.02.015
|
| [108] |
Koga H, Tamiya Y, Mitsuyama K, et al. (2013) Probiotics promote rapid-turnover protein production by restoring gut flora in patients with alcoholic liver cirrhosis. Hepatol Int 7: 767-774. https://doi.org/10.1007/s12072-012-9408-x
|
| [109] |
Li X, Liu Y, Guo X, et al. (2021) Effect of Lactobacillus casei on lipid metabolism and intestinal microflora in patients with alcoholic liver injury. Eur J Clin Nutr 75: 1227-1236. https://doi.org/10.1038/s41430-020-00852-8
|
| [110] |
Gupta H, Kim SH, Kim SK, et al. (2022) Beneficial shifts in gut microbiota by Lacticaseibacillus rhamnosus R0011 and Lactobacillus helveticus R0052 in alcoholic hepatitis. Microorganisms 10: 1474. https://doi.org/10.3390/microorganisms10071474
|
| [111] |
Vatsalya V, Feng W, Kong M, et al. (2023) The beneficial effects of Lactobacillus GG therapy on liver and drinking assessments in patients with moderate alcohol-associated hepatitis. Off J Am Coll Gastroenterol ACG 118: 1457-1460. https://doi.org/10.14309/ajg.0000000000002283
|
| [112] |
Shen H, Zhou L, Zhang H, et al. (2024) Dietary fiber alleviates alcoholic liver injury via Bacteroides acidifaciens and subsequent ammonia detoxification. Cell Host Microbe 32: 1331-1346.e6. https://doi.org/10.1016/j.chom.2024.06.008
|
| [113] |
Ferrere G, Wrzosek L, Cailleux F, et al. (2017) Fecal microbiota manipulation prevents dysbiosis and alcohol-induced liver injury in mice. J Hepatol 66: 806-815. https://doi.org/10.1016/j.jhep.2016.11.008
|
| [114] |
Yan AW, Fouts DE, Brandl J, et al. (2011) Enteric dysbiosis associated with a mouse model of alcoholic liver disease. Hepatology 53: 96-105. https://doi.org/10.1002/hep.24018
|
| [115] |
Wei L, Pan Y, Guo Y, et al. (2024) Symbiotic combination of Akkermansia muciniphila and inosine alleviates alcohol-induced liver injury by modulating gut dysbiosis and immune responses. Front Microbiol 15: 1355225. https://doi.org/10.3389/fmicb.2024.1355225
|
| [116] |
Irwin C, Khalesi S, Cox AJ, et al. (2018) Effect of 8-weeks prebiotics/probiotics supplementation on alcohol metabolism and blood biomarkers of healthy adults: A pilot study. Eur J Nutr 57: 1523-1534. https://doi.org/10.1007/s00394-017-1437-8
|
| [117] |
Zhu Y, Wang X, Zhu L, et al. (2022) Lactobacillus rhamnosus GG combined with inosine ameliorates alcohol-induced liver injury through regulation of intestinal barrier and Treg/Th1 cells. Toxicol Appl Pharmacol 439: 115923. https://doi.org/10.1016/j.taap.2022.115923
|
| [118] | Parthasarathy G, Malhi H, Bajaj JS (2024) Therapeutic manipulation of the microbiome in liver disease. Hepatolog . https://doi.org/10.1097/HEP.0000000000000987 |
| [119] |
Zhou P, Chen C, Patil S, et al. (2024) Unveiling the therapeutic symphony of probiotics, prebiotics, and postbiotics in gut-immune harmony. Front Nutr 11: 1355542. https://doi.org/10.3389/fnut.2024.1355542
|
| [120] |
Xu R, Yu Y, Chen T (2025) Exploring the dark side of probiotics to pursue light: Intrinsic and extrinsic risks to be opportunistic pathogens. Curr Res Food Sci 10: 101044. https://doi.org/10.1016/j.crfs.2025.101044
|
| [121] |
Maslennikov R, Poluektova E, Zolnikova O, et al. (2023) Gut microbiota and bacterial translocation in the pathogenesis of liver fibrosis. Int J Mol Sci 24: 16502. https://doi.org/10.3390/ijms242316502
|
| [122] |
Pinzone MR, Celesia BM, Di Rosa M, et al. (2012) Microbial translocation in chronic liver diseases. Int J Microbiol 2012: 694629. https://doi.org/10.1155/2012/694629
|
Figures(2) / Tables(3)

María José Lorenzo Pisarello, Antonela Marquez, Adriana Perez Chaia, Jaime Daniel Babot. Targeting gut health: Probiotics as promising therapeutics in alcohol-related liver disease management[J]. AIMS Microbiology, 2025, 11(2): 410-435. doi: 10.3934/microbiol.2025019


 DownLoad: