Citation: Christian M Julien, Alain Mauger, Ashraf E Abdel-Ghany, Ahmed M Hashem, Karim Zaghib. Smart materials for energy storage in Li-ion batteries[J]. AIMS Materials Science, 2016, 3(1): 137-148. doi: 10.3934/matersci.2016.1.137
[1] | Vasileios Tzenetidis, Aristomenis Kotsakis, Mary Gouva, Konstantinos Tsaras, Maria Malliarou . Examining psychosocial risks and their impact on nurses' safety attitudes and medication error rates: A cross-sectional study. AIMS Public Health, 2025, 12(2): 378-398. doi: 10.3934/publichealth.2025022 |
[2] | Nazli Javid, Christy Pu . Maternal stature, maternal education and child growth in Pakistan: a cross-sectional study. AIMS Public Health, 2020, 7(2): 380-392. doi: 10.3934/publichealth.2020032 |
[3] | Maha Hamad Mohammed Ali, Osman Babiker Osman, Mohamed AE. M. Ibrahim, Waled Amen Mohammed Ahmed . The effect of AIDS peer health education on knowledge, attitudes, and practices of secondary school students in Khartoum, Sudan. AIMS Public Health, 2015, 2(4): 718-726. doi: 10.3934/publichealth.2015.4.718 |
[4] | Kola M Owonikoko, Aramide M Tijani, Olarewaju G Bajowa, Oluseyi O Atanda . Use of Safety Pin on Garments in Pregnancy: A Belief and Cultural Practice with Potential Harmful Effect. AIMS Public Health, 2017, 4(1): 19-32. doi: 10.3934/publichealth.2017.1.19 |
[5] | Henry V. Doctor, Sangwani Nkhana-Salimu . Trends and Determinants of Child Growth Indicators in Malawi and Implications for the Sustainable Development Goals. AIMS Public Health, 2017, 4(6): 590-614. doi: 10.3934/publichealth.2017.6.590 |
[6] | Sharon L. Casapulla, Gloria Aidoo-Frimpong, Tania B. Basta, Mario J. Grijalva . Zika virus knowledge and attitudes in Ecuador. AIMS Public Health, 2018, 5(1): 49-63. doi: 10.3934/publichealth.2018.1.49 |
[7] | Eduardo Fricovsky, Mudassar Iqbal Arain, Binh Tran, Phuong Thao Nguyen, Tuyet Phan, Natalie Chang . Assessing the impact of a health education outreach project on cervical cancer awareness among Vietnamese-American women in San Diego. AIMS Public Health, 2022, 9(3): 552-558. doi: 10.3934/publichealth.2022038 |
[8] | Nisreen M Abdulsalam, Marwan A Bakarman . Use of social media in food safety in Saudi Arabia—a preliminary study. AIMS Public Health, 2021, 8(2): 322-332. doi: 10.3934/publichealth.2021025 |
[9] | Natalie E. Houser, Lindsay Roach, Michelle R. Stone, Joan Turner, Sara F.L. Kirk . Let the Children Play: Scoping Review on the Implementation and Use of Loose Parts for Promoting Physical Activity Participation. AIMS Public Health, 2016, 3(4): 781-799. doi: 10.3934/publichealth.2016.4.781 |
[10] | Michael O Ogundele, Hani F Ayyash . ADHD in children and adolescents: Review of current practice of non-pharmacological and behavioural management. AIMS Public Health, 2023, 10(1): 35-51. doi: 10.3934/publichealth.2023004 |
Biomass sources are widely recognized as a potential future solution to the energy problems worldwide [1,2]. It provides the only source of renewable liquid fuel [3]. Bio-oil, a liquid product of biomass pyrolysis, is a complex mixture of several hundreds of organic compounds that exhibit a wide range of chemical functionality [4]. Characteristic examples of the bio-oil compounds are single ring containing compounds and polycyclic aromatic compounds [5].
The bio-oil applied in this study is produced from the cedar pollard, a kind of waste biomass. In order to be used as a liquid fuel, two main problems needs to be solved: high viscosity and high oxygen content [6,7]. These two problems lead to undesirable combustion phenomenon such as insufficient energy density, incomplete combustion and blockage [8].
To solve such problems, the main upgrading methods include the hydrogenation [9,10], the cracking [11,12], the solvent addition [13], the steam reforming [14,15] and the emulsification [16,17]. However, none of these bio-oil upgrading technologies have been widely commercialized due to high cost and low fuel efficiency [18]. The cracking method is highly feasible because It can be realized at the atmospheric pressure and no additives are required [19,20].
The popular cracking methods are fixed bed cracking, moving bed cracking and fluidized bed cracking [21,22]. The fixed bed cracking is chosen in this study for its simple equipment requirements.
Many types of catalysts have been studied in the literatures in order to investigate how far the catalyst can modify the bio-oil composition and the bio-oil quality. Most of these studies are focusing on the comparison of catalysts but not on the mechanism of catalysts. The control test without catalyst is considered unnecessary in these studies [23,24,25,26,27,28,29].
However, in this paper, the effect of the commonly used catalyst HZSM-5 was discussed focusing on the comparison with the non-catalytic cracking. Most studies on the catalytic cracking of bio-oil are using only one heating reactor, where all components of bio-oil are in contact with the catalyst, including the components that tend to deactivate the catalyst. In this paper, two heating units were employed so that the raw bio-oil was separated in the first heating unit and the cracking was done in the second heating unit. The components liable to deactivate the catalyst can be identified by changing the temperature in the first heating unit. In this way, the catalyst deactivation caused by different components were analyzed simultaneously, instead of treating the bio-oil as a whole [30,24], using model components separately [20] or analyzing the deactivated catalyst after the reaction [31].
Some researches reported that bio-oil component separation is difficult under the atmospheric pressure and side reactions tend to occur due to the poor heat stability of bio-oil [32,33]. But in this paper, side reactions did not significantly affect the experimental results by employing the two-stage heated reactors. Indeed, it is difficult to separate all components in bio-oil individually, but the components can be divided into 4 classes according to the chemical analysis, which was sufficient to explain the reaction mechanism of the deactivation. Different from the one heating unit process which is commonly used, the components in the upgraded bio-oil can be divided into 4 classes of organic components clearly by employing two heating units. By analyzing the reaction trend of these four classes of bio-oil components, the deactivation principle of the catalyst can be discussed without using model compounds. Previous studies generally considered that high molecular weight aromatic and aliphatic compounds are important reasons for deactivation of catalysts [1,34], but in this research, the effects of phenols and naphthalenes on the catalyst were investigated to show the importance of their effects.
The bio-oil was produced from the pyrolysis of Japanese cedar. The pyrolysis gas produced in an updraft gasifier passed through a cooler to remove water and heavy tar and then was introduced to a centrifuge separator to recover the bio-oil [35].
The elemental content and properties of the bio-oil are listed in Table 1.
Element and properties of bio-oil | |
C (%) | 57.5 |
H (%) | 7.0 |
N (%) | 0.0 |
O (%) | 35.5 |
S (mg/kg) | 0.0 |
H2O (%) | 8.3 |
Ash (%) | 0.0 |
Density (g/cm3) | 1.14 |
HHV (MJ/kg) | 23.1 |
Cetane index | < 20 |
Kinetic viscosity (mm2/s @ 50 ℃) | 12.7 |
*Cetane index of bio-oil was unable to measure accurately for its high density. |
The HZSM-5 catalyst used in the experiment was provided by Tosoh corporation. Prior to the experiments, the catalytic materials were calcined at 500 ℃ for 3 h and stored in a desiccator. Its properties are listed in Table 2.
Properties of the catalyst | |
Pore size (Å) | 5.8 |
SiO2/Al2O3 (mol/mol) | 40 |
Specific surface area (m2/g) | 330 |
Crystal size (μm) | 2 × 4 |
Particle size (μm) | 10 |
NH3-TPD (mmol/g) | 1.3 |
The schematic diagram of the experimental set-up is shown in Figure 1. The raw bio-oil was firstly introduced to the first heating unit and then gasified into the second heating unit, with or without packing of the catalyst. As a carrier gas, N2 gas was fed at the flow rate of 10 mL/min from the top of the first heating unit for the continuous withdrawal of the products and the maintenance of the inert atmosphere during cracking. The product flowing out from the bottom of the second heating unit was in gaseous form, and was condensed in a glass receiver submerged in an ice-water bath. Non-condensable gases were collected in a gas bag. A filter was placed between the ice-water bath receiver and the gas bag for recovering condensable vapor which might leak from the condenser.
Initially, the second heating unit was filled with 10 g catalyst (catalytic cracking) or no catalyst (non-catalytic cracking), while the first heating unit was filled with 30 g of the raw bio-oil. The first heating unit was heated to a specified temperature. The first heating unit was heated externally to the different set temperature in different heating time, after the second heating unit was heated to 500 ℃ for 60 minutes. Every operation lasted one hour to ensure the reaction is complete. The operating condition was listed in Table 3.
Operation Condition | Set temperature of the 1st heating unit | Heating time |
Partial Gasification (PGF) | 510 ℃ | 15 min |
Further Gasification (FGF) | 550 ℃ | 18 min |
Complete Gasification (CGF) | 600 ℃ | 21 min |
As show in Table 3, under the PGF operation condition, both the heated temperature and heating time was less than the FGF and CGF condition. The liquid products were collected and quantitatively measured in the pre-weighted glass receiver. When changing the set temperature higher than 600 ℃, no more liquid was collected than CGF condition. Therefore, all volatile components are considered to be gasified under the CGF condition. The non-condensable gas products were collected and measured by difference. The amount of the residue left in the first heating unit was measured by weighing the first heating unit before and after the experiment. The solid products consisted of the coke left in the first heating unit and the coke on the catalyst in the second unit. The amount of condensable vapors recovered in the filter was also weighed by difference and the weight was added to the liquid products yield.
The following characteristics were determined: the elemental analysis of C, H, O, N, the moisture content, the ash content, the density, the high heating value (HHV), the cetane index, the kinetic viscosity and the chemical composition.
The ash content and the elemental analysis of C, H, N were determined by JM10 at 950 ℃. The elemental analysis of O was determined by Vario micro cube at 1150 ℃. The moisture content was measured using Karl Fischer method in accordance with the standards JIS K 2275. HHV was determined in accordance with the standards JIS K 2279. The kinetic viscosity was measured by the ostwald viscometer at 40 ℃. The cetane index was calculated in accordance with the standards JIS K 2280-5.
GC-MS is the technique used in the analyses of the product oil composition. A Rxi®-5Sil MS Column was used in the GC and helium was selected as the carrier gas. The oven heating profile was set at an increase of 5 ℃/min from 30 to 280 ℃.
In order to investigate the effect of the zeolite catalyst, the cracking with catalyst in the second heating unit was compared with the non-catalytic cracking. In each run, after the second heating unit was heated to 500 ℃ and kept for 60 min, the first heating unit was heated under the CGF condition and kept for 1 h when no more liquid or gas product could be observed, the yield was weighed and the data was listed in the Table 4.
Liquid | solid | gas | |
With catalyst | 61.3% (water:organic = 16.6:44.7) | 19.8% | 18.8% |
Without catalyst | 75.7% (water:organic = 16.8:58.9) | 18.3% | 14.4% |
As shown in Table 4, the gas product from the non-catalyst run was less than the one from the catalyst run, while the liquid product was more.
The upgraded oil in the liquid product was the target in this experiment. The collected liquid product was divided into two layers: the water layer and the organic layer. The element analysis data of the two layers are listed in Table 5.
Element content by weight | Without catalyst | With catalyst | ||
Water layer | Organic layer | Water layer | Organic layer | |
C (%) | 21.85 | 67.91 | 10.11 | 73.47 |
H (%) | 9.35 | 7.83 | 9.73 | 7.22 |
O (%) | 68.70 | 24.07 | 79.93 | 19.03 |
Obviously, some organic matter is soluble in the water layer. That is why C element was also detected in the water layer.
Though in the non-catalytic cracking, the organic liquid product was more than that in the catalytic cracking, the C content was lower and the O content was higher, which means that the heating value of the organic liquid product was lower than the catalytic cracked bio-oil.
Compared with the raw bio-oil properties listed in Table 1, the C content increased by 10% and the O content decreased by 11% in the non-catalytic cracking, while the C content increased by 16% and the O content decreased by 16% in the case of the catalytic cracking. The cracking was achieved without the catalyst, while the zeolite promoted the rate of deoxygenation by 50%.
The possible reason for this promotion was the adsorption and the acidic sites of the zeolite. The adsorption on the surface of the zeolite extended the cracking reaction time of oxygen-containing molecules and the acidic sites contributed to enhance the deoxygenation reaction [36,37]. Other physical properties of the raw bio-oil and the organic liquid products are listed in Table 6.
Bio-oil | Organic liquid from catalytic cracking | Organic liquid from non-catalyst cracking | |
Density (g/cm3) | 1.14 | 1.02 | 1.03 |
Kinetic viscosity (mm2/s@50 ℃) | 12.7 | 4.72 | 4.85 |
Water content (%) | 8.3 | 8.0 | 8.2 |
Cetane index | < 20 | 39.76 | 38.18 |
HHV (MJ/kg) | 23.1 | 31.8 | 29.9 |
Significant improvement in physical properties was observed after the cracking regardless of the usage of the catalyst. A further improvement was obtained by using the catalyst.
In order to analyze the phenomenon in more details, GC-MS was employed to identify the chemical compositions of the raw bio-oil and the organic liquid. The result of the raw bio-oil is shown in Figure 2.
Though hundreds of organics was detected, if picking out the highest 20 peaks, the area of these 20 peaks accounted for 90% of the total area. These 20 organics were listed in Table 7.
Name | Retention time (min) | Area (%) |
1-Hydroxy-2-butanone | 4.9 | 1.96 |
Propanal | 5.2 | 1.26 |
3, 5-Dimethylpyrazole | 6.5 | 1.98 |
2(5H)-Furanone | 8.9 | 2.36 |
1, 2-Cyclopentanedione, 3-methyl- | 12.7 | 3.90 |
Phenol, 2-methoxy- | 14.6 | 18.09 |
2-Cyclopenten-1-one, 3-ethyl-2-hydroxy- | 15.5 | 1.37 |
Phenol, 2, 4-dimethyl- | 16.9 | 1.55 |
Creosol | 17.7 | 17.07 |
Phenol, 4-ethyl-2-methoxy- | 20.1 | 12.98 |
Phenol, 2-methoxy-3-(2-propenyl)- | 22.2 | 2.31 |
Phenol, 2-methoxy-4-propyl- | 22.5 | 4.51 |
trans-Isoeugenol | 24.8 | 5.93 |
Naphthalene, 1, 2, 4a, 5, 6, 8a-hexahydro-4, 7-dimethyl-1-(1-methylethyl)- | 25.8 | 1.98 |
Naphthalene, 1, 2, 4a, 5, 8, 8a-hexahydro-4, 7-dimethyl-1-(1-methylethyl)-[1S-(1.alpha., 4a.beta., 8a.alpha.)]- | 26.3 | 3.70 |
Di-epi-.alpha.-cedrene-(I) | 29.0 | 1.44 |
2-Naphthalenemethanol, decahydro-.alpha., .alpha., 4a-trimethyl-8-methylene-[2R-(2.alpha., 4a.alpha., 8a.beta.)]- | 29.7 | 2.35 |
Kaur-15-ene, (5.alpha., 9.alpha., 10.beta.)- | 36.3 | 1.10 |
Naphthalene, decahydro-1, 1, 4a-trimethyl-6-methylene-5-(3-methyl-2, 4-pentadienyl)-[4aS-(4a.alpha., 5.alpha., 8a.beta.)]- | 42.0 | 1.05 |
Ferruginol | 42.9 | 2.54 |
The main components could be divided into 4 classes. The first one is oxygen-containing small molecules with the retention time from 2.5 to 10 min, the main components of which are kinds of ketone, furan and imidazole. The second class is phenols with the retention time of 10 to 25 min, whose main components are guaiacol and its homologues. The third class with the retention time from 25 to 30 min are naphthalenes, which mainly contained naphthalene and naphthol. The fourth one was the materials whose retention time were later than 30 min, mainly containing long-chain aliphatic macromolecular and polycyclic macromolecular structural substances. The area proportions of these four classes are listed in Table 8.
Small molecule | Phenols | Naphthalenes | Macromolecule | |
Rage of retention time (min) | 2.5–10 | 10–25 | 25–30 | > 30 |
Area (%) | 8.2% | 74.0% | 10.8% | 7.0% |
Figure 3 showed the GC-MS result of the organic liquid products. Two high peaks came out at the retention time of 5.1 min and 7.8 min after cracking. According to the data base, these two were toluene and xylene, which were most likely the product of the phenolic deoxygenation.
In the catalytic cracking, the phenols peak and the naphthalenes peak deceased more evidently than the non-catalytic cracking, along with more product of toluene and xylene than the non-catalytic cracking. Therefore, more phenolic deoxygenation happened when catalyst was used for cracking. Considering the high thermal stability of benzene ring and naphthalenic ring [38,39], the decrease of naphthalenes shall be interpreted as coking on the catalyst.
In summary of the above data, the most likely reactions in the second heater unit are the phenolic deoxygenation and the naphthalene coking on the catalyst. In the non-catalytic cracking, the phenols and naphthalenes were directly condensed in the ice-water bath receiver without contact with the catalyst. In order to verify this speculation, different temperatures in the first heating unit were tested in the following section.
In order to confirm the reaction of the 4 component classes, all 3 types of operation condition in Table 3 were tested. At each separation temperature, the experiments were repeated three times without changing the catalyst in the second heating unit, but replacing the residue in the first unit with new bio-oil. The yield was listed in Table 9.
Main Ingredients | 1st Class | 2nd class | 3rd class | 4th class |
Small molecules* | Phenols | Naphthalenes | Macromolecules | |
PGF | ||||
First run | 52.0% | 40.0% | 8.0% | 0.0% |
Second run | 44.8% | 43.9% | 10.8% | 0.0% |
Third run | 48% | 41% | 7% | 0.5% |
FGF | ||||
First run | 49.2% | 45.0% | 5.8% | 0.0% |
Second run | 33.7% | 57.3% | 9.0% | 0.0% |
Third run | 37.0% | 55.5% | 7.6% | 0.02% |
CGF | ||||
First run | 34.8% | 50.2% | 13.6% | 1.4% |
Second run | 18.1% | 40.4% | 33.4% | 7.1% |
Third run | 11.5% | 47.1% | 33.1% | 8.3% |
*The main ingredients of "small molecules" were toluene and xylene. |
Although the area percentage does not mean the actual content, the data as a reference can be used to summarize the reaction trend.
In the first run at each temperature, the yield of small molecules were higher than the second and the third runs. The yield of phenols in the first run was lower than in the second and the third runs under the PGF and FGF condition. It can be concluded that at the first run of each temperature, the catalyst has the highest activity of converting phenols to toluene and xylene. When the catalyst was reused without regeneration, the activity decreased and more phenols were collected in the condenser than in the first run.
Under the PGF condition, the distilled ingredients from the first heating unit were mainly the small molecule components including oxygen-containing heterocyclic compounds, ketones and benzenes. From the first run to the third run, the yield of each class did not change significantly, which shows that the deactivation was not serious. Small molecule components was not the main reason for the catalyst deactivation.
Under the FGF condition, more phenols were distilled from the first heating unit. That is why the yield of phenols was higher than the one under the PGF condition. After the first run under the PGF condition, a significant decrease of the small molecule components was observed, accompanied by the increase in the yield of phenols. The yields of naphthalene and macromolecules under the FGF condition were in low level similar as in the case of PGF condition. This proved that phenols were important cause of the catalyst deactivation.
When the separation temperature in the first unit came to CGF runs, a big amount of naphthalenes and macromolecules are distilled from the first heating unit. A serious decline happened in the yield percentage of the small molecules from the first run to the second run. A further decline was observed at the third run. It clearly showed that naphthalenes and macromolecules coked on the catalyst, resulting in a serious catalyst inactivation.
Moreover, it should not be considered that the naphthalenes and macromolecules collected in the ice-water bath came from distillation only. Part of them should be the product of the polymerization reaction in the heating process.
Small molecules, whose main component was toluene and xylene, did not contain oxygen. This class of product should be the target product because of the higher heating value. A low separation temperature and shorter heating time should be used to avoid the contact of naphthalenes and macromolecules with catalyst.
The yield of the product from the first run in each temperature was listed in Table 10. All feedstocks were converted to water, liquid, coke and gas. The residue referred to the coke in the first heating unit and the increased weight after the cracking tests.
Water | Oil | Gas | Residue | |
CGF run | 16.6 | 44.7 | 18.8 | 19.8 |
FGF run | 14.1 | 41.2 | 17.2 | 27.0 |
PGF run | 11.8 | 35.1 | 12.1 | 40.0 |
The oil product under PGF operation performed the lowest oxygen content, while that from CDF run performed the highest yield. The comparison of these two product were listed in Table 11.
Bio-oil | Product oil from 300 ℃ run | Product oil from 130 ℃ run | |
C (%) | 57.5 | 73.5 | 72.3 |
H (%) | 7.0 | 7.2 | 11.8 |
N (%) | 0 | 0 | 0 |
O (%) | 35.5 | 19.0 | 15.9 |
HHV (MJ/kg) | 23.1 | 31.8 | 38.6 |
Yield (%) | - | 44.7 | 35.1 |
Heat inputs (kJ/g) | - | 18.2 | 16.5 |
Energy recovery (%) | - | 34.3 | 34.3 |
The heat inputs referred to the heat put into the reactor for average 1g bio-oil. The recovery rate of the energy was calculated with the Eq 1:
$ {\rm{Energy}}\;{\rm{recovery}} = {\rm{Energ}}{{\rm{y}}_{{\rm{product}}\;{\rm{oil}}}}/({\rm{Energ}}{{\rm{y}}_{{\rm{bio - oil}}}} + {\rm{Hea}}{{\rm{t}}_{{\rm{inputs}}}}) $ | (1) |
Where Energyproduct oil = mproduct oilHHVproduct oil, Energybio-oil = mbio-oilHHVbio-oil
According to the calculation results, the product oil recovered 34% energy of the energy inputs. The recovery rate of CGF run was a little higher than the PGF run, but the gap is limited. Since the catalyst in the PGF run can be reused and the separation temperature was lower than the the CGF, oil upgrading at a lower separation temperature is a rational choice.
The bio-oil can be upgraded in a process with two heating unit with or without zeolite catalyst. The main reaction of the cracking is deoxygenation of phenols. The zeolite catalyst contributes to promote the deoxygenation rate. However, utilization of zeolite catalyst results in a decrease of the liquid product yield. As a liquid fuel, the properties of the catalytic cracked oil were better than the non-catalytic cracked oil. The hundreds of components in the raw bio-oil can be divided into 4 classes: small molecules, phenols, naphthalenes and macromolecules. Small molecules are not the main cause of the catalyst deactivation. Phenols slightly deactivate the catalyst. The contact of naphthalenes and macromolecules with zeolite is a big problem causing the deactivation. A lower separation temperature in the first heating unit helps to alleviate the inactivation reaction.
This work was supported by the Tokyo Institute of Technology. The authors would like to thank the cooperation of School of Environmental Science and Engineering of Tianjin University, which provided a lot of theoretical guidance.
All authors declare no conflicts of interest in this paper.
[1] | https://en.wikipedia.org/wiki/Smart_material (2015) |
[2] | Julien CM, Mauger A, Vijh A, et al. (2015) Lithium Batteries: Science and Technology. Springer, New York. |
[3] |
Julien CM (2003) Lithium intercalated compounds, charge transfer and related properties. Mater Sci Eng R 40: 47–102. doi: 10.1016/S0927-796X(02)00104-3
![]() |
[4] |
Mauger A, Julien CM (2014) Surface modifications of electrode materials for lithium-ion batteries: status and trends. Ionics 20: 751–787. doi: 10.1007/s11581-014-1131-2
![]() |
[5] |
Hashem AMA, Abdel-Ghany AE, Eid AE, et al. (2011) Study of the surface modification of LiNi1/3Co1/3Mn1/3O2 cathode materials for lithium-ion battery. J Power Sources 196: 8632–8637. doi: 10.1016/j.jpowsour.2011.06.039
![]() |
[6] |
Lee JH, Kim JW, Kang HY, et al. (2015) The effect of energetically coated ZrOx on enhanced electrochemical performances of Li(Ni1/3Co1/3Mn1/3)O2 cathodes using modified radio frequency (RF) sputtering. J Mater Chem A 3: 12982–12991. doi: 10.1039/C5TA02055G
![]() |
[7] |
Thackeray MM, Johnson PJ, de Picciotto LA, et al. (1984) Lithium extraction from LiMn2O4. Mater Res Bull 19:179–187. doi: 10.1016/0025-5408(84)90088-6
![]() |
[8] |
Amatucci GG, Schmutz CN, Blyr A, et al. (1997) Materials effects on the elevated and room temperature performance of C-LiMn2O4 Li-ion batteries. J Power Sources 69: 11–25. doi: 10.1016/S0378-7753(97)02542-1
![]() |
[9] | Komaba S, Kumagai N, Sasaki T, et al. (2001) Manganese dissolution from lithium doped Li-Mn-O spinel cathode materials into electrolyte solution. Electrochemistry 69: 784–787. |
[10] | Lee KS, Myung ST, Amine K, et al. (2009) Dual functioned BiOF-coated Li[Li0.1Al0.05Mn1.85]O4 for lithium batteries. J Mater Chem 19: 1995–2005. |
[11] | Lee DJ, Lee KS, Myung ST, et al. (2011) Improvement of electrochemical properties of Li1.1Al0.05Mn1.85O4 achieved by an AlF3 coating. J Power Sources 196: 1353–1357. |
[12] |
Chen Q, Wang Y, Zhang T, et al. (2012) Electrochemical performance of LaF3-coated LiMn2O4 cathode materials for lithium ion batteries. Electrochim Acta 83: 65–72. doi: 10.1016/j.electacta.2012.08.025
![]() |
[13] |
Jiang Q, Wang X, Tang Z (2015) Improving the electrochemical performance of LiMn2O4 by amorphous carbon coating. Fullerenes, Nanotubes and Carbon Nano 23: 676–679. doi: 10.1080/1536383X.2014.952369
![]() |
[14] | Sun W, Liu H, Bai G, et al. (2015) A general strategy to construct uniform carbon-coated spinel LiMn2O4 nanowires for ultrafast rechargeable lithium-ion batteries with a long cycle life. Nanoscale 7: 13173–13180. |
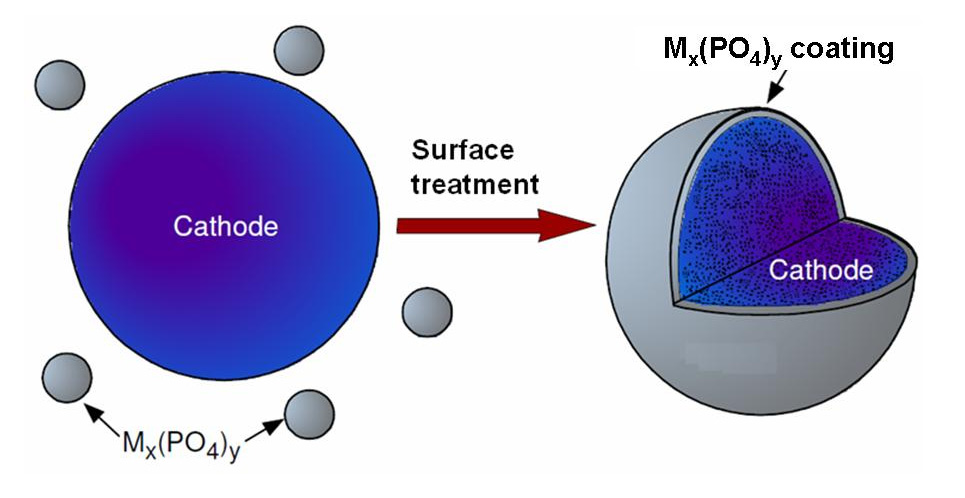
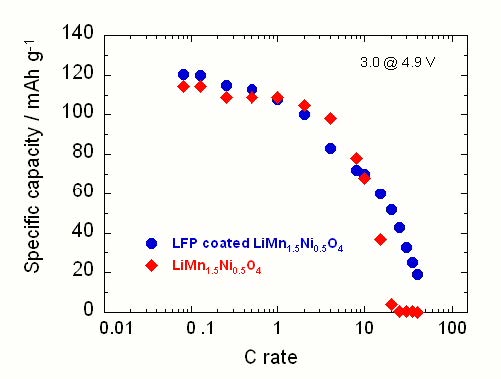
[15] | Liu D, Trottier J, Charest P, et al. (2012) Effect of nanoLiFePO4 coating on LiMn1.5Ni0.5O4 5-V cathode for lithium ion batteries. J Power Sources 204: 127–132. |
[16] |
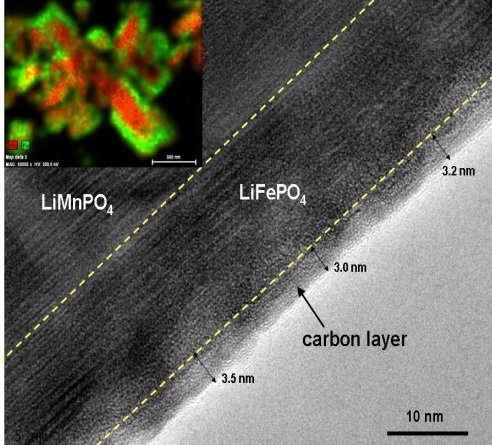
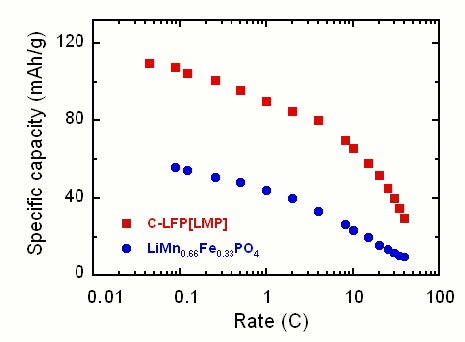
Zaghib K, Trudeau M, Guerfi A, et al. (2012) New advanced cathode material: LiMnPO4 encapsulated with LiFePO4. J Power Sources 204: 177–181. doi: 10.1016/j.jpowsour.2011.11.085
![]() |
[17] |
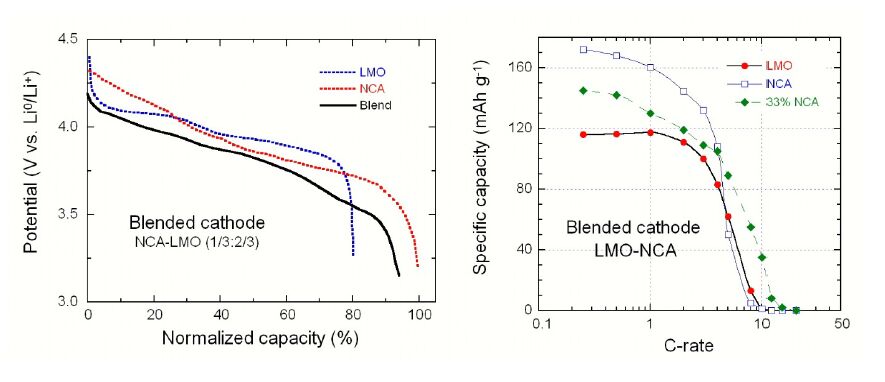
Chikkannanavar SB, Bernardi DM, Liu L (2014) A review of blended cathode materials for use in Li-ion batteries. J Power Sources 248: 91–100. doi: 10.1016/j.jpowsour.2013.09.052
![]() |
[18] | Gao J, Manthiram A (2009) Eliminating the irreversible capacity loss of high capacity layered Li[Li0.2Ni0.13Mn0.54Co0.13]O2 cathode by blending with other lithium insertion hosts. J Power Sources 191: 644–647. |
[19] | Tran HY, Täubert C, Fleischhammer M, et al. (2011) LiMn2O4 spinel/LiNi0.8Co0.15Al0.05O0.2 blends as cathode materials for lithium-ion batteries. J Electrochem Soc 158: A556–A561. |
[20] |
Luo W, Li X, Dahn JR (2010) Synthesis, characterization and thermal stability of Li[Ni1/3Mn1/3Co1/3-z(MnMg)z/2]O2. Chem Mater 22: 5065–5073. doi: 10.1021/cm1017163
![]() |
[21] |
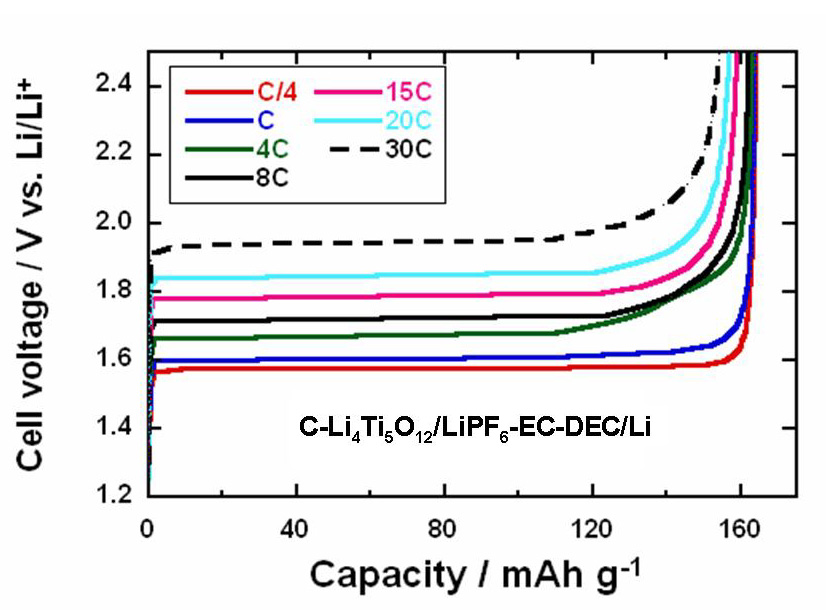
Ohzuku T, Ueda A, Yamamoto N (1995) Zero-strain insertion material of Li[Li1/3Ti5/3]O4 for rechargeable lithium cells. J Electrochem Soc 142: 1431–1435. doi: 10.1149/1.2048592
![]() |
[22] | Zhu GN, Liu HJ, Zhuang JH, et al. (2011) Carbon-coated nano-sized Li4Ti5O12 Yong-Gang nanoporous micro-sphere as anode material for high-rate lithium-ion batteries. Energy Environ Sci 4: 4016–4022. |
[23] |
Wang YQ, Gu L, Guo YG, et al. (2012) Rutile-TiO2 nano-coating for a high-rate Li4Ti5O12 anode of a lithium-ion battery. J Am Chem Soc 134: 7874–7879. doi: 10.1021/ja301266w
![]() |
[24] |
Shen L, Li H, Uchaker E, et al. (2012) General strategy for designing core−shell nanostructured materials for high-power lithium ion batteries. Nano Lett 12: 5673–5678. doi: 10.1021/nl302854j
![]() |
[25] |
Choi JH, Ryu WH, Park K, et al. (2014) Multi-layer electrode with nano-Li4Ti5O12 aggregates sandwiched between carbon nanotube and graphene networks for high power Li-ion batteries. Sci Rep 4: 7334. doi: 10.1038/srep07334
![]() |
[26] |
Zaghib K, Dontigny M, Guerfi A, et al. (2012) An improved high-power battery with increased thermal operating range: C-LiFePO4//C-Li4Ti5O12. J Power Sources 216: 192–200. doi: 10.1016/j.jpowsour.2012.05.025
![]() |
[27] |
Jung HG, Myung ST, Yoon CS, et al. (2011) Microscale spherical carbon-coated Li4Ti5O12 as ultra-high power anode material for lithium batteries. Energy Environ Sci 4: 1345–1351. doi: 10.1039/c0ee00620c
![]() |
[28] |
Zaghib K, Dontigny M, Guerfi A, et al. (2012) An improved high-power battery with increased thermal operating range: C-LiFePO4//C-Li4Ti5O12. J Power Sources 216: 192–200. doi: 10.1016/j.jpowsour.2012.05.025
![]() |
1. | Natalija M. Farrell, Sebastian Hamilton, Bryan J. Gendron, Jessica L. Corio, Sara K. Lookabill, Presence of “One Pill Can Kill” Medications in Medication Organizers: Implications for Child Safety, 2022, 35, 0897-1900, 898, 10.1177/08971900211017491 | |
2. | Hong Li, Teresa Dodd-Butera, Margaret L. Beaman, Molly Broderick Pritty, Thomas E. Heitritter, Richard F. Clark, Trends in Childhood Poison Exposures and Fatalities: A Retrospective Secondary Data Analysis of the 2009–2019 U.S. National Poison Data System Annual Reports, 2021, 13, 2036-7503, 613, 10.3390/pediatric13040073 | |
3. | Saber Yezli, Yara Yassin, Abdulaziz Mushi, Bander Balkhi, Andy Stergachis, Anas Khan, Medication Handling and Storage among Pilgrims during the Hajj Mass Gathering, 2021, 9, 2227-9032, 626, 10.3390/healthcare9060626 | |
4. | Maribeth C. Lovegrove, Nina J. Weidle, Daniel S. Budnitz, Trends in Emergency Department Visits for Unsupervised Pediatric Medication Exposures, 2004–2013, 2015, 136, 0031-4005, e821, 10.1542/peds.2015-2092 | |
5. | Allison Brown, Vishveshvar Ramkumar, Aditi Patel, David Kang, Jedidiah Lim, Samreen Shah, Hassan Y Ebrahim, Zakaria Y Abd Elmageed, Statin Consumption and Appealing Colors: Exploring Statin-Related Injuries for Children Under the Age of Three Years, 2024, 2168-8184, 10.7759/cureus.73520 | |
6. | Thamodha Weerasinghe, Radeesha Dassanayake, Minoli Senapathy, Raveen Thennakoon, Kavinda Dayasiri, The role of primary caregivers’ knowledge, attitudes, and practices in paediatric medication safety, 2025, 18, 1756-0500, 10.1186/s13104-025-07144-z |
Element and properties of bio-oil | |
C (%) | 57.5 |
H (%) | 7.0 |
N (%) | 0.0 |
O (%) | 35.5 |
S (mg/kg) | 0.0 |
H2O (%) | 8.3 |
Ash (%) | 0.0 |
Density (g/cm3) | 1.14 |
HHV (MJ/kg) | 23.1 |
Cetane index | < 20 |
Kinetic viscosity (mm2/s @ 50 ℃) | 12.7 |
*Cetane index of bio-oil was unable to measure accurately for its high density. |
Properties of the catalyst | |
Pore size (Å) | 5.8 |
SiO2/Al2O3 (mol/mol) | 40 |
Specific surface area (m2/g) | 330 |
Crystal size (μm) | 2 × 4 |
Particle size (μm) | 10 |
NH3-TPD (mmol/g) | 1.3 |
Operation Condition | Set temperature of the 1st heating unit | Heating time |
Partial Gasification (PGF) | 510 ℃ | 15 min |
Further Gasification (FGF) | 550 ℃ | 18 min |
Complete Gasification (CGF) | 600 ℃ | 21 min |
Liquid | solid | gas | |
With catalyst | 61.3% (water:organic = 16.6:44.7) | 19.8% | 18.8% |
Without catalyst | 75.7% (water:organic = 16.8:58.9) | 18.3% | 14.4% |
Element content by weight | Without catalyst | With catalyst | ||
Water layer | Organic layer | Water layer | Organic layer | |
C (%) | 21.85 | 67.91 | 10.11 | 73.47 |
H (%) | 9.35 | 7.83 | 9.73 | 7.22 |
O (%) | 68.70 | 24.07 | 79.93 | 19.03 |
Bio-oil | Organic liquid from catalytic cracking | Organic liquid from non-catalyst cracking | |
Density (g/cm3) | 1.14 | 1.02 | 1.03 |
Kinetic viscosity (mm2/s@50 ℃) | 12.7 | 4.72 | 4.85 |
Water content (%) | 8.3 | 8.0 | 8.2 |
Cetane index | < 20 | 39.76 | 38.18 |
HHV (MJ/kg) | 23.1 | 31.8 | 29.9 |
Name | Retention time (min) | Area (%) |
1-Hydroxy-2-butanone | 4.9 | 1.96 |
Propanal | 5.2 | 1.26 |
3, 5-Dimethylpyrazole | 6.5 | 1.98 |
2(5H)-Furanone | 8.9 | 2.36 |
1, 2-Cyclopentanedione, 3-methyl- | 12.7 | 3.90 |
Phenol, 2-methoxy- | 14.6 | 18.09 |
2-Cyclopenten-1-one, 3-ethyl-2-hydroxy- | 15.5 | 1.37 |
Phenol, 2, 4-dimethyl- | 16.9 | 1.55 |
Creosol | 17.7 | 17.07 |
Phenol, 4-ethyl-2-methoxy- | 20.1 | 12.98 |
Phenol, 2-methoxy-3-(2-propenyl)- | 22.2 | 2.31 |
Phenol, 2-methoxy-4-propyl- | 22.5 | 4.51 |
trans-Isoeugenol | 24.8 | 5.93 |
Naphthalene, 1, 2, 4a, 5, 6, 8a-hexahydro-4, 7-dimethyl-1-(1-methylethyl)- | 25.8 | 1.98 |
Naphthalene, 1, 2, 4a, 5, 8, 8a-hexahydro-4, 7-dimethyl-1-(1-methylethyl)-[1S-(1.alpha., 4a.beta., 8a.alpha.)]- | 26.3 | 3.70 |
Di-epi-.alpha.-cedrene-(I) | 29.0 | 1.44 |
2-Naphthalenemethanol, decahydro-.alpha., .alpha., 4a-trimethyl-8-methylene-[2R-(2.alpha., 4a.alpha., 8a.beta.)]- | 29.7 | 2.35 |
Kaur-15-ene, (5.alpha., 9.alpha., 10.beta.)- | 36.3 | 1.10 |
Naphthalene, decahydro-1, 1, 4a-trimethyl-6-methylene-5-(3-methyl-2, 4-pentadienyl)-[4aS-(4a.alpha., 5.alpha., 8a.beta.)]- | 42.0 | 1.05 |
Ferruginol | 42.9 | 2.54 |
Small molecule | Phenols | Naphthalenes | Macromolecule | |
Rage of retention time (min) | 2.5–10 | 10–25 | 25–30 | > 30 |
Area (%) | 8.2% | 74.0% | 10.8% | 7.0% |
Main Ingredients | 1st Class | 2nd class | 3rd class | 4th class |
Small molecules* | Phenols | Naphthalenes | Macromolecules | |
PGF | ||||
First run | 52.0% | 40.0% | 8.0% | 0.0% |
Second run | 44.8% | 43.9% | 10.8% | 0.0% |
Third run | 48% | 41% | 7% | 0.5% |
FGF | ||||
First run | 49.2% | 45.0% | 5.8% | 0.0% |
Second run | 33.7% | 57.3% | 9.0% | 0.0% |
Third run | 37.0% | 55.5% | 7.6% | 0.02% |
CGF | ||||
First run | 34.8% | 50.2% | 13.6% | 1.4% |
Second run | 18.1% | 40.4% | 33.4% | 7.1% |
Third run | 11.5% | 47.1% | 33.1% | 8.3% |
*The main ingredients of "small molecules" were toluene and xylene. |
Water | Oil | Gas | Residue | |
CGF run | 16.6 | 44.7 | 18.8 | 19.8 |
FGF run | 14.1 | 41.2 | 17.2 | 27.0 |
PGF run | 11.8 | 35.1 | 12.1 | 40.0 |
Bio-oil | Product oil from 300 ℃ run | Product oil from 130 ℃ run | |
C (%) | 57.5 | 73.5 | 72.3 |
H (%) | 7.0 | 7.2 | 11.8 |
N (%) | 0 | 0 | 0 |
O (%) | 35.5 | 19.0 | 15.9 |
HHV (MJ/kg) | 23.1 | 31.8 | 38.6 |
Yield (%) | - | 44.7 | 35.1 |
Heat inputs (kJ/g) | - | 18.2 | 16.5 |
Energy recovery (%) | - | 34.3 | 34.3 |