Overview

Effects of COVID-19 pandemic on education and society


  • This paper sheds light on the impact of the COVID-19 pandemic on society and the surrounding environment, with a special focus on education and the social aspect. Specifically, how the pandemic has disrupted education systems across the globe by forcing the closure of primary and secondary schools, colleges and universities is discussed. Since it is not only the students who were affected by this worldwide health emergency, the impact on educators and parents, as well as all aspects of the education system, including admissions, assessments and evaluations, is also debated. These facets are discussed while emphasizing the shifts that many organizations underwent to maintain operations while adhering to the announced governmental restrictions related to the circulation of the pandemic. Specifically, the needs to rapidly implement significant modifications to their usual practices and standard operational processes and convert their existing teaching materials to another format to make them appropriate for online delivery are highlighted and discussed.

    Citation: Zaineb Chelly Dagdia, Ana Cristina Simões e Silva. Effects of COVID-19 pandemic on education and society[J]. STEM Education, 2022, 2(3): 197-220. doi: 10.3934/steme.2022013
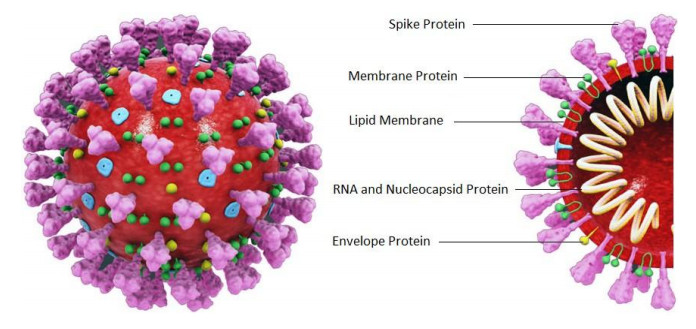
    Related Papers:

    [1] Firoz Ahmad, Laxmi Goparaju, Abdul Qayum . Wild life habitat suitability and conservation hotspot mapping: Remote Sensing and GIS based decision support system. AIMS Geosciences, 2018, 4(1): 66-87. doi: 10.3934/geosci.2018.1.66
    [2] Firoz Ahmad, Laxmi Goparaju . Soil and Water Conservation Prioritization Using Geospatial Technology – a Case Study of Part of Subarnarekha Basin, Jharkhand, India. AIMS Geosciences, 2017, 3(3): 375-395. doi: 10.3934/geosci.2017.3.375
    [3] Rajeev Singh Chandel, Shruti Kanga, Suraj Kumar Singh . Impact of COVID-19 on tourism sector: a case study of Rajasthan, India. AIMS Geosciences, 2021, 7(2): 224-243. doi: 10.3934/geosci.2021014
    [4] Binoy Kumar Barman, K. Srinivasa Rao, Kangkana Sonowal, Zohmingliani, N.S.R. Prasad, Uttam Kumar Sahoo . Soil erosion assessment using revised universal soil loss equation model and geo-spatial technology: A case study of upper Tuirial river basin, Mizoram, India. AIMS Geosciences, 2020, 6(4): 525-544. doi: 10.3934/geosci.2020030
    [5] Voyé Liliane, Karel Dobbelaere . Pilgrimages: Space, Polysemy and Three Cases. AIMS Geosciences, 2016, 2(2): 166-181. doi: 10.3934/geosci.2016.2.166
    [6] Alexander Vasilyevich Tertyshnikov . Results of radio sounding of the south polar auroral oval performed with the GNSS signals of a sledge-track train around the Russian Antarctic station "Vostok". AIMS Geosciences, 2021, 7(2): 129-137. doi: 10.3934/geosci.2021008
    [7] Alexander Fekete . Urban and Rural Landslide Hazard and Exposure Mapping Using Landsat and Corona Satellite Imagery for Tehran and the Alborz Mountains, Iran. AIMS Geosciences, 2017, 3(1): 37-66. doi: 10.3934/geosci.2017.1.37
    [8] Mario Batubara, Masa-yuki Yamamoto, Islam Hosni Hemdan Eldedsouki Hamama, Musthofa Lathif, Ibnu Fathrio . Measurement and characterization of infrasound waves from the March 25, 2023 thunderstorm at the near equatorial. AIMS Geosciences, 2023, 9(4): 652-671. doi: 10.3934/geosci.2023035
    [9] Miyuru B Gunathilake, Thamashi Senerath, Upaka Rathnayake . Artificial neural network based PERSIANN data sets in evaluation of hydrologic utility of precipitation estimations in a tropical watershed of Sri Lanka. AIMS Geosciences, 2021, 7(3): 478-489. doi: 10.3934/geosci.2021027
    [10] K Siri Lakshatha, D Venkata Ratnam, K Sivakrishna . Applicability of NeQuick G ionospheric model for single-frequency GNSS users over India. AIMS Geosciences, 2022, 8(1): 127-136. doi: 10.3934/geosci.2022008
  • This paper sheds light on the impact of the COVID-19 pandemic on society and the surrounding environment, with a special focus on education and the social aspect. Specifically, how the pandemic has disrupted education systems across the globe by forcing the closure of primary and secondary schools, colleges and universities is discussed. Since it is not only the students who were affected by this worldwide health emergency, the impact on educators and parents, as well as all aspects of the education system, including admissions, assessments and evaluations, is also debated. These facets are discussed while emphasizing the shifts that many organizations underwent to maintain operations while adhering to the announced governmental restrictions related to the circulation of the pandemic. Specifically, the needs to rapidly implement significant modifications to their usual practices and standard operational processes and convert their existing teaching materials to another format to make them appropriate for online delivery are highlighted and discussed.


    1. Introduction

    Geo-informatics technology or 3S technology stands for integration of Remote Sensing (RS), Geospatial Information System (GIS) and Global Positioning System (GPS). Present-day 3S technology is proving as most dynamic and innovative tool for environmental researcher and geo-scientist for mapping, monitoring, modelling, assessment and defensible management of various environmental issues and natural resources by its specific capabilities and cost effectiveness [1]. Assessment of LU/LC variations is feasible using GIS techniques if the subsequent spatial datasets of different scales or resolutions are available [2]. Land use land cover is an important component to understand global land status; it shows present as well as past status of the Earth’s surface. Land use and land cover are two distinct terms which are often used interchangeably. In common, land cover is defined as the perceived (bio)-physical cover on the Earth’s surface which may include vegetation, man-made features, bare rock, bare soil, and inland water surfaces, etc. Land use denotes the approach in which land has been used by humans for economic activities [3,4,5,6]. LU/LC is the basic parameter which evaluates the composition of Earth’s surface to monitor the condition and functioning of the ecosystem. LU/LC variations caused by natural and human resources have generally resulted in deforestation, global warming, biodiversity loss and increase of natural disaster-flooding [7,8,9,10]. LU/LC data sets are the primary inputs for environmental modelling and monitoring, carbon cycle studies, hydrology and global climate change analysis, natural resources management, policy-making, etc. [11]. The LU/LC monitoring includes tracking the changes of a natural environment and their influence on the ecosystem [12].

    There are numerous methods established in literature for LU/LC change detection: post classification comparison, image ratio, image regression, orthodox image variation and manual on-screen digitization of multi temporal satellite imagery [7]. It is a well known fact that post classification comparison is the most precise technique which has the advantage of indicating the nature of the changes [11]. In present research, change detection comparison (pixel by pixel) method was adopted to the Land use/Land cover maps obtained from satellite imagery. Many researchers from diverse countries have recognized the advantages of geospatial technology in mapping, monitoring and detecting LU/LC variation. For example Prakasam (2010) analyzed LU/LC change using Landsat and IRS image data in Kodaikanal Taluk, Tamil Nadu and found that forest degraded up to 50% in 2008. While N. Kayet and K. Pathak (2015) revealed that Very Dense Forest (VDF) area of Saranda forest, Jharkhand reduced to 8.61% and Open Forest (OF) increased to 7.03% between the years 1992 and 2014 due to increase in built-up area and mining activity. In West Java, Kaswanto et al. (2010) analyzed the impact of LU/LC changes on spatial pattern of landscape between two decades (1989-2009) using Landsat Imagery and detected the changing of forest and grassland into agricultural and built-up area. Mengistu and Salami (2007) studied the LU/LC change detection using Landsat imagery in a region of south western Nigeria and they revealed that forest area has decreased and a corresponding increase is noticed in shrub land/farmland complex and settlement/bare surface [7]. An assessment of variation in forest cover has become a vital element in the present-day system for management of natural resources and identifying environmental deviations [5].

    Many of recent researches has publicized that the overpowering population pressure, practicing unscientific cultivated methods and the lack of consciousness about the significance of forests among the people are the key reasons for deforestation/degradation of forest [6]. Jharkhand has geographical area of 79, 714 Km2 contributing 2.42% of the country's area. The total noted forest area of the state is 23, 605 Km2 which is 29.61% of the geographic area of the state. Reserved forests area establishes 18.58%, protected forests area 81.28%, and unclassified forests area covers 0.14%. The total forest and tree cover area set together, establishes about 32.48% of the geographic area of the state compared to the national average of 23.81% [13,15]. DWLS also plays an active part towards maintaining the state's ecological condition by its large forest area which is spread out over 193.22 Km2. Various habitats inhabited by diverse wildlife species are essential for maintaining the ecological balance and global carbon cycle equilibrium [13]. The present investigation reports the variation in LU/LC due to increment in shifting cultivation, forest fire, built-up area, etc. Also an attempt has been taken to establish a relation between decrease in forest cover area with increase in built-up area, agricultural land or bare land by multi temporal satellite imagery of DWLS.


    1.1. Investigated field

    The Dalma Wildlife Sanctuary, Jamshedpur which is spatially located between Latitudes 22°46’30” and 22°57’ N and Longitudes 86°3’15” and 86°26’30” E in the East Singhbhum and Sariakela-Kharsawan districts of Jharkhand and spread out over an area of 193.22 Km2 covering 86 villages are shown in Figure 1. DWLS was inaugurated by Late Sanjay Gandhi in 1975 and sanctuary

    Figure 1. Location map of Dalma Wildlife Sanctuary (DWLS)

    was acquainted by Government of Bihar vide gazette notification number S.O 1221 dated 17 July1976 [13]. It has a distinct Eco-sensitive Zone to shield the forest area. Forest renews the ground water aquifer by storing rainfall and protects streams against siltation by minimizing soil erosion. DWLS is so compact that visibility reduces to just 15 feet, it carries a diverse habitat for different Wildlife Species, and it is rich in vegetation containing various species of plant and trees with 90% of timber [16]. Ramgarh and Saharbera are selected for exploration of forest degradation due to illegal settlement encroachment in forest reserve area, which is geographically located in south west (SW) of the sanctuary nearby the National Highway-32 (NH). Increase in the population and NH construction has its consequence in the forest area getting decreased [13,16].


    1.2. Materials and data used

    The five sets of temporal remote sensing data used for current study include: LISS-III (2009, 2011 & 2013), Landsat-TM (2015, 2016) and Topographic maps of scale 1:50, 000. Five different year’s satellite data were collected from BHUVAN and United State Geological Survey (USGS) [17,18], where these data are freely available, and topographic maps were downloaded from India and Pakistan AMS topographic maps [19]. Care is taken to ensure that the data was cloud free and does not belong to leafless season. The details of the used satellite data are presented in Table 1. Shapefile of DWLS with village boundary and Pillars, GPS Coordinates of two villages, Ramgarh and Saharbera were provided by the Administration of DWLS.

    Table 1. Data used in present investigation
    YearSatellite dateResolutionData source
    2009LISS-Ⅲ23.5mBHUVAN
    2011LISS-Ⅲ23.5mBHUVAN
    2013LISS-Ⅲ23.5mBHUVAN
    2015LANDSAT-TM30mUSGS
    2016LANDSAT-TM30mUSGS
     | Show Table
    DownLoad: CSV

    2. Methodology

    ArcMap-10 and Erdas Imagine-9.2 software’s have been preferred for current study to prepare the LU/LC variation maps, using multi-temporal satellite data and toposheet. Different steps have been followed in present investigation as shown in Figure 2. The all-encompassing image

    Figure 2. Flow chart of proposed method

    processing procedure was done by using ERDAS IMAGINE and ArcMap software. Layer stacking of individual band in image file and georeferencing were completed by ERDAS IMAGINE-9.2; False Colour Composite (FCC) creation and further image classification were accomplished by using ArcMap-10 [12].


    2.1. Image classification

    In supervised classification, Maximum Likelihood Classification (MLC) technique was adopted in present study to analyze the variation in LU/LC of DWLS in five different years. The maximum likelihood classifier takes up the pixels of unknown class membership and decides certain possibility of going to a specific category [20]. The probabilities in MLC technique are the same for all the classes and the input signatures in each band follows the Gaussian distribution function to classify the image [21]. The supervised classification involves training areas for every category and the training area is used to express spectral reflectance patterns/signature of each LU/LC category. The signatures would then be used by classifier to group the pixels into a certain category which has the same spectral patterns [20,21]. The number of the test points/pixels was derived based on the thumb rule that these should at least ten times the total number of classes. As there are five LU/LC classes so the total sample size was computed to be 5*10*5=250 pixels, and the number of pixels for each class was determined by using ratio calculation. All the five LU/LC classes were assigned a rank in the ascending order of their area, each rank was divided by the sum of the ranks, i.e. 15, and finally it was multiplied by the total number of pixels, i.e. 250 as shown in Table 2. The training sample was collected on-screen.

    Table 2. Sample size of test point for accuracy assessment
    LU/LC ClassesRankSample Size
    VDF11/15*250=16.67
    MF22/15*250=33.33
    SETTELEMENTS44/15*250=66.67
    WATERBODY55/15*250=83.33
    BARELAND/OTHERS33/15*250=50
    TOTAL15250
     | Show Table
    DownLoad: CSV

    3. Results and Discussion

    Infringed zones inside the forest diverge in shape and size. It is comparatively easier to identify the larger extension of encroached pockets. In several cases, encroachers often plant non-forest trees in the gaps and in nearby small herbs and shrubs to have their right on their encroached land. In such cases, it is difficult to identify the encroachment with remote sensing images due to little background contrast in such environment. It is important to mention that in the absence of digitized boundaries of recorded forest area; it is bit difficult to indicate changes in forest-cover within and out-side of the small forest areas. Similarly, the absence of digitized boundaries of revenue villages also leads to confusion in the detection of forest encroachment. Also, it is difficult to validate encroachments using toposheets as they are not frequently updated by the concerned agencies. In such cases, validation is done through multi temporal satellite imagery, interviews, field visits, perceiving forest agency records and taking GPS/DGPS readings [22,23,24,25,26].

    With the help of multi temporal satellite data of five years, supervised classification (Maximum Likelihood Classification) technique has been adopted which works based on the similar reflectance appearance of altered LU/LC classes. It is observed from the prepared map that the area of VDF has gradually decreased; in 2009 VDF area was 166.57 Km2 which is decreased to 164.30 Km2 in 2011, likely VDF area regularly decreased to 159.43Km2, 156.75 Km2 and 154.13Km2 approximately in 2013, 2015 and 2016 respectively as presented in Figure 3. Degradation of VDF and Moderate Forest (MF) area in the year of 2011-2013 was very high that contributes 4.87 and 15.04 Km2 respectively which belong to 1.26% & 3.86% of the total VDF and MF area. It is due to drastic increment in settlement and bare land/ others area which are 7.82 & 13.46 Km2 respectively. Similarly in the year range of 2009-2011, 2013-2015 and 2015-2016 VDF area got degraded by 0.59%, 0.68% and 0.67% incessantly, which corresponds to degradation of 2.27 Km2, 2.68 Km2 and 2.62 Km2 of the VDF area respectively. MF also gradually decreased since last 7 years, but in the year of 2015 there is a sudden raise by 2.13% in comparison to 2013 (This drastic change may be due to classification error or due to seasonal variation in vegetation) as presented in Table 3.

    Figure 3. Map showing LU/LC variation due to various causes in DWLS of different year, (a) 2009, (b) 2011, (c) 2013, (d) 2015 and (e) 2016
    Table 3. LU/LC variations over the years
    LU/LC CLASS20092011201320152016
    AreaAreaAreaAreaAreaAreaAreaAreaAreaArea
    (Km2)(%)(Km2)(%)(Km2)(%)(Km2)(%)(Km2)(%)
    VDF166.5742.80164.3042.20159.4340.94156.7540.26154.1339.56
    MF132.6834.10102.5426.3387.4922.4795.7624.6081.12620.84
    SETTELEMENTS40.1610.3141.2310.5949.0512.6050.0612.8552.0113.36
    WATERBODY6.391.647.441.916.051.556.7191.726.9661.78
    BARELAND/OTHERS43.3711.1473.8618.9687.3222.4380.0120.5595.0224.41
     | Show Table
    DownLoad: CSV

    During the degradation assessment of reserve forest area of sanctuary with respect to previous time period, it is observed that forest degradation is steadily taking place due to various causes like shifting cultivation, forest fire, cutting of trees to fulfil basic needs of local habitants, increment in settlement area, conversion of forest area into crop land/ bare land etc. Throughout the whole investigation of last 7 years from 2009-2016 it is noted that VDF area of DWLS is gradually diminishing at the rate of 0.46% that is 1.77 Km2 per year of total area. Whereas settlements and bare land/others are steadily increasing at the rate of 0.44% & 1.89% which are 1.69 Km2 and 7.37 Km2 per year of total forest cover area. Water body within the DWLS is approximately constant in all the years as shown in Figure 4. According to current case study it has been revealed that the deforestation is taking place gradually due to several concerns as we have discussed earlier, which is not optimistic indication for ecological equilibrium.

    Figure 4. LU/LC variation valuations over the year of DWLS

    To establish a relation between the humiliation of forest cover and increment in settlement area/bare land, two selected villages viz. Ramgarh and Saharbera were surveyed with prior GPS coordinates of the reserved forest boundary. During the traditional field survey it is noted that lots of pillars were ruined or illegally dislocated by the local habitants for making their own shelters or using it as an agricultural land etc. which is validated in Figure 5. Pillars location with prior and examined position has been also listed with loss of forest cover distances in Table 4 and 5 for the two selected villages. Minus marks (-) in Table 4 and Table 5 shows the loss of distance (approximately) from the prior pillars location (only negative variation of Pillars ID has been listed).

    Figure 5. Settlement encroached in forest area (near saharbera village)
    Table 4. Geographic coordinates with pillars ID and distance of Ramgarh villages
    Pillars IDExamined GPS Coordinates (Degree, Minute, Second)Prior GPS Coordinates (Degree, Minute, Second)Variation in Pillars Distance (m)
    186 09' 09.0'' E 22 53' 08.6'' N86 9'8.97"E 22 53'9.287"N-21.151802
    386 09' 17.1'' E 22 53' 06.3'' N86 9'12.071"E 22 53'9.799"N-70.764403
    486 09' 22.8'' E 22 53' 04.6'' N86 9'17.078"E 22 53'7.968"N-52.270414
    586 09' 26.3'' E 22 53' 04.0'' N86 9'22.786"E 22 53'6.662"N-18.493981
    786 09' 33.5'' E 22 53' 03.9'' N86 9'29.935"E 22 53'5.493"N-3.100787
    886 09' 35.5'' E 22 53' 03.8'' N86 9'33.487"E 22 53'5.773"N-3.000650
    1186 09' 41.0'' E 22 53' 03.5'' N86 9'41.127"E 22 53'4.738"N -12.335158
    1486 09' 57.7'' E 22 53' 06.0'' N86 9'51.837"E 22 53'8.086"N -55.371204
    1586 09' 58.8'' E 22 53' 04.6'' N86 9'57.761"E 22 53'6.031"N -43.078794
    1686 10' 02.4'' E 22 53' 03.8'' N86 9'58.86 "E 22 53'4.603"N -24.695555
    1886 09' 09.0'' E 22 53' 08.6'' N86 9'8.97"E 22 53'9.287"N -21.151802
     | Show Table
    DownLoad: CSV
    Table 5. Geographic coordinates with pillars ID and distance of Saharbera villages
    Pillars IDExamined GPS Coordinates (Degree, Minute, Second)Prior GPS Coordinates (Degree, Minute, Second)Variation In Pillars Distance (m)
    2686 07' 35.8'' E 22 53' 46.6'' N86 7' 35.62"E 22 53' 46.651"N-5.36
    5386 07' 5.7" E 22 53' 26.3"N86 6' 55.873"E 22 53' 29.852"N-87.837663
    5486 07' 8.4" E 22 53' 25.6"N86 6' 59.341"E 22 53' 29.027"N-56.218106
     | Show Table
    DownLoad: CSV

    By analysing the above listed prior and examined GPS coordinates it can be predicted that forest area is diminished by human influences to fulfil their needs, so it is very important to protect the forest environment and maintain the ecological balance.


    4. Accuracy assessment

    The accuracy assessment is essential to validate the of image classification results and a number of methods have been developed for this process. For accuracy assessment validation, a confusion matrix has been prepared with the help of classified and pre classification satellite imagery [27], using a sample of 10 randomly selected pixels within each class that were collected on-screen by an experienced interpreter. The results show that the overall accuracy of five LU/LC datasets for the years 2009, 2011, 2013, 2015 and 2016 was 91.48, 95.00, 95.00, 92.59 and 85.37 respectively as shown in Table 6.

    Table 6. Confusion matrix over the years for LU/LC
    (A) Year- 2009
    LU/LC ClassVDFMFWaterbodySettlementBareland/OthersTotalUser’s Accuracy (%)
    VDF71000887.5
    MF380001172.73
    Waterbody008008100
    Settlement00010010100
    Bareland/00001010100
    Others
    Total1098101047
    Producer’s Accuracy(%)708080100100
    Overall Accuracy (%)91.48
    (B) Year- 2011
    LU/LC ClassVDFWaterbodyMFBareland/OthersSettlementTotalUser’s Accuracy (%)
    VDF10000010100
    Waterbody01000010100
    MF009009100
    Bareland/000909100
    Others
    Settlement0011101283.33
    Total101010101050
    Producer’s Accuracy(%)1001009090100
    Overall Accuracy (%)95.00
    (C) Year- 2013
    LU/LC ClassVDFMFWaterbodySettlementBareland/OthersTotalUser’s Accuracy (%)
    VDF1002001283.33
    MF01000010100
    Waterbody008008100
    Settlement00010010100
    Bareland/00001010100
    Others
    Total101010101050
    Producer’s Accuracy(%)10010080100100
    Overall Accuracy (%)95.00
    (D) Year- 2015
    LU/LC ClassVDFWaterbodyMFBareland/OthersSettlementTotalUser’s Accuracy (%)
    VDF10000010100
    Waterbody01000010100
    MF009201181.82
    Bareland/000808100
    Others
    Settlement0010101190.91
    Total101010101050
    Producer’s Accuracy(%)1001009080100
    Overall Accuracy (%)92.59
    (E) Year- 2016
    LU/LC ClassVDFMFWaterbodySettlementBareland/OthersTotalUser’s Accuracy (%)
    VDF10000010100
    MF06100785.71
    Waterbody049011464.29
    Settlement00010010100
    Bareland/000099100
    Others
    Total101010101050
    Producer’s Accuracy(%)100609010090
    Overall Accuracy (%)85.37
     | Show Table
    DownLoad: CSV

    5. Conclusions

    The investigation apparently predicts the reason behind the gradual loss in forest cover area of DWLS from the study of multi-temporal satellite imageries of last seven years since 2009-2016 as well as from the field visit experience. Main causes for the loss of forest area assessed from field verification and interacting with local villagers are as follows; shifting cultivation, forest fire, settlement infringement, conversion of forest area into crop land/ bare land etc. With the help of In-situ data and remotely sensed data it has been analyzed that VDF area is decreasing at the rate of 1.77 Km2 per year and settlement/bare land is increasing at the rate of 1.69 Km2, 7.37 Km2 respectively per year of total area which is not positive indication for ecological equilibrium. The foremost variations in the LU/LC through the study retro amongst the years 2009, 2011, 2013, 2015 and 2016 are recorded which provided us with stimulating explanation.


    Acknowledgements

    Authors are grateful to Ministry of Environment and Forests, Jharkhand Wildlife for authorization to work in Dalma Wildlife Sanctuary. Authors also thank to Mr. Kamlesh Pandey, Divisional Forest Officer (DFO), Dalma Wildlife Sanctuary Jamshedpur, for kind support. We are pleased to GIS analyst of Jamshedpur Mr. Balram Yadav, for going through the manuscript and providing their valuable comments, suggestions and appreciation to improve this manuscript. We would like to express sincere thanks to Forest guard Kaleshwar Mahto and many staffs of DWLS for their help and support during the field work.


    Conflict of Interest

    All authors declare no conflict of interest.


    [1] Clinical features of patients infected with 2019 novel coronavirus in Wuhan, China. The lancet (2020) 395: 497-506.
    [2] The COVID-19 pandemic. Critical reviews in clinical laboratory sciences (2020) 57: 365-388.
    [3]

    United Nations. End poverty in all its forms everywhere. Retrieved from: https://unstats.un.org/sdgs/report/2021/goal-01/ [Online; accessed 18-March-2022].

    [4]

    World Health Organization, World Health Organization best practices for the naming of new human infectious diseases. In: World Health Organization best practices for the naming of new human infectious diseases, 2015.

    [5]

    World Health Organization, Surveillance case definitions for human infection with novel coronavirus (nCoV), interim guidance, 15 January 2020.

    [6] The proximal origin of SARS-CoV-2. Nature medicine (2020) 26: 450-452.
    [7]

    Dr Michel NAHON, Covid-19: mise au point. Retrieved from: https://urgences-serveur.fr/covid-19-mise-au-point.html [Online; accessed 27-January-2022].

    [8] The biological and clinical significance of emerging SARS-CoV-2 variants. Nature Reviews Genetics (2021) 22: 757-773.
    [9]

    The World Health Organization, Tracking sars-cov-2 variants. Retrieved from: https://www.who.int/en/activities/tracking-SARS-CoV-2-variants/ [Online; accessed 27-January-2022].

    [10] The prevalence of symptoms in 24,410 adults infected by the novel coronavirus (SARS-CoV-2; COVID-19): A systematic review and meta-analysis of 148 studies from 9 countries. PloS one (2020) 15: e0234765.
    [11] COVID-19: Transmission, prevention, and potential therapeutic opportunities. Clinica chimica acta (2020) 508: 254-266.
    [12] A review of current interventions for COVID-19 prevention. Archives of medical research (2020) 51: 363-374.
    [13] Coronavirus disease (COVID-19) prevention and treatment methods and effective parameters: A systematic literature review. Sustainable cities and society (2021) 64: 102568.
    [14] History of the COVID-19 pandemic: Origin, explosion, worldwide spreading. Biochemical and biophysical research communications (2021) 538: 14-23.
    [15] Understanding the origin of COVID-19 requires to change the paradigm on zoonotic emergence from the spillover to the circulation model. Infection, Genetics and Evolution (2021) 95: 104812.
    [16] Wuhan seafood market may not be source of novel virus spreading globally. Science (2020) 10: 1126.
    [17] Dangerous pathogens in the laboratory: from smallpox to today's SARS setbacks and tomorrow's polio-free world. The Lancet (2004) 363: 1566-1568.
    [18] Do not blame bats and pangolins! Global consequences for wildlife conservation after the SARS-CoV-2 pandemic. Biodiversity and conservation (2020) 29: 3829-3833.
    [19] Guidelines for communicating about bats to prevent persecution in the time of COVID-19. Biological Conservation (2020) 248: 108650.
    [20] Probability of a zoonotic spillover with seasonal variation. Infectious Disease Modelling (2021) 6: 514-531.
    [21] Probable pangolin origin of SARS-CoV-2 associated with the COVID-19 outbreak. Current biology (2020) 30: 1346-1351.
    [22] Isolation and characterization of 2019-nCoV-like coronavirus from Malayan pangolins. BioRxiv (2020) .
    [23] Spike protein recognition of mammalian ACE2 predicts the host range and an optimized ACE2 for SARS-CoV-2 infection. Biochemical and biophysical research communications (2020) 526: 165-169.
    [24]

    The World Health Organization, Who coronavirus (covid-19) dashboard. Retrieved from: https://covid19.who.int/ [Online; accessed 28-January-2022].

    [25]

    Scientific The United Nations Educational and Cultural Organization (UNESCO). Education: From disruption to recovery. Retrieved from: https://en.unesco.org/covid19/educationresponse [Online; accessed 05-February-2022].

    [26] , Impact of COVID-19 pandemic on information management research and practice: Transforming education, work and life. International journal of information management (2020) 55: 102211.
    [27] Digitally transforming work styles in an era of infectious disease. International Journal of Information Management (2020) 55: 102172.
    [28] Transition to online education in schools during a SARS-CoV-2 coronavirus (COVID-19) pandemic in Georgia. Pedagogical Research (2020) 5:.
    [29] Rethinking assessment in a digital age: Opportunities, challenges and risks. British Educational Research Journal (2016) 42: 454-476.
    [30] Closure of universities due to coronavirus disease 2019 (COVID-19): impact on education and mental health of students and academic staff. Cureus (2020) 12:.
    [31]

    Scientific The United Nations Educational and Cultural Organization (UNESCO). Unesco rallies international organizations, civil society and private sector partners in a broad coalition to ensure #learningneverstops.[Online; accessed 06-February-2022].

    [32]

    Di Pietro, G., Biagi, F., Costa, P., Karpiński, Z. and Mazza. J., The likely impact of COVID-19 on education: Reflections based on the existing literature and recent international datasets, Vol. 30275, Luxembourg: Publications Office of the European Union, 2020.

    [33] In the shadow of Coronavirus: Distance education and digital literacy skills in Greece. International Journal of Social Science and Technology (2020) 5: 1-14.
    [34] The impact of Covid-19 on learning-the perspective of the Ghanaian student. European Journal of Education Studies (2020) .
    [35]

    European Migration Network (EMN), the Organisation for Economic Co-operation, and Development (OECD). Inform #2 - impact of covid-19 on international students in eu and oecd member states. Retrieved from: https://ec.europa.eu/migrant-integration/library-document/inform-2-impact-covid-19-international-students-eu-and-oecd-member-states_en [Online; accessed 06-February-2022].

    [36]

    THE EUROPEAN PARLIAMENT and THE COUNCIL OF THE EUROPEAN UNION. Directive (eu) 2016/801 of the european parliament and of the council of 11 may 2016 on the conditions of entry and residence of third-country nationals for the purposes of research, studies, training, voluntary service, pupil exchange schemes or educational projects and au pairing. Official Journal of the European Union.

    [37] Should international borders re-open? The impact of travel restrictions on COVID-19 importation risk. BMC public health (2021) 21: 1-9.
    [38] Impact of "e-Learning crack-up" perception on psychological distress among college students during COVID-19 pandemic: A mediating role of "fear of academic year loss". Children and youth services review (2020) 118: 105355.
    [39] , Psychological impacts of COVID-19 and satisfaction from online classes: disturbance in daily routine and prevalence of depression, stress, and anxiety among students of Pakistan. Heliyon (2021) 7: e07030.
    [40] Perspective: Mental health and the Covid-19 pandemic. The New England Journal of Medicine (2020) 383: 510-512.
    [41] Psychological and social impact of COVID-19. Psychological Trauma: Theory, Research, Practice, and Policy (2020) 12: 468-469.
    [42]

    Masten, A.S., Narayan, A.J., Silverman, W.K. and Osofsky, J.D., Children in war and disaster. Handbook of child psychology and developmental science, 2015, 1‒42. Wiley. https://doi.org/10.1002/9781118963418.childpsy418

    [43]

    American Psychological Association, Keeping your distance to stay safe. Retrieved from: https://www.apa.org/practice/programs/dmhi/research-information/social-distancing

    [44] Economic impact of COVID-19 pandemic in healthcare facilities and systems: International perspectives. Best Practice Research in Clinical Anaesthesiology (2021) 35: 293-306.
    [45] The economic effects of COVID-19 containment measures. Open Economies Review (2022) 33: 1-32.
    [46] Patient and Hospital Factors Associated With Differences in Mortality Rates Among Black and White US Medicare Beneficiaries Hospitalized With COVID-19 Infection. JAMA Network Open (2021) 4: e2112842.
    [47] Ethnic differences in COVID-19 mortality during the first two waves of the Coronavirus Pandemic: a nationwide cohort study of 29 million adults in England. European Journal of Epidemiology (2021) 36: 605-617.
    [48] Hospitalization and Mortality among Black Patients and White Patients with Covid-19. New England Journal of Medicine (2020) 382: 2534-2543.
    [49] Association of Race With Mortality Among Patients Hospitalized With Coronavirus Disease 2019 (COVID-19) at 92 US Hospitals. JAMA Network Open (2020) 3: e2018039.
    [50] The COVID-19 pandemic and health inequalities. Journal of Epidemiology and Community Health (2020) 74: 964-968.
    [51] , Ethnic differences in SARS-CoV-2 infection and COVID-19-related hospitalisation, intensive care unit admission, and death in 17 million adults in England: an observational cohort study using the OpenSAFELY platform. The Lancet (2021) 397: 1711-1724.
    [52] Offline: COVID-19 is not a pandemic. Lancet (2020) 396: 874.
    [53] Syndemics and the biosocial conception of health. The Lancet (2017) 389: 941-950.
    [54] Multidisciplinary research priorities for the COVID-19 pandemic: a call for action for mental health science. The Lancet Psychiatry (2020) 7: 547-560.
    [55] , Emotional, behavioral, and psychological impact of the COVID-19 pandemic. Frontiers in Psychology (2020) 11: 566212.
    [56] LGBTQ populations: Psychologically vulnerable communities in the COVID-19 pandemic. Psychological Trauma (2020) 12: S239-242.
    [57] The Mental Health Impact of the COVID-19 Pandemic Across Different Cohorts. International Journal of Mental Health and Addiction (2020) 1-7.
    [58] Patients with mental health disorders in the COVID-19 epidemic. The Lancet Psychiatry (2020) 7: e21.
    [59] , Remote care for mental health: qualitative study with service users, careers and staff during the COVID-19 pandemic. British Medical Journal Open (2021) 11: e049210.
    [60] Psychological resilience and post-traumatic growth in disaster-exposed organisations: overview of the literature. British Medical Journal Military Health (2020) 166: 52-56.
    [61] 'Care Under Pressure': a realist review of interventions to tackle doctors' mental ill-health and its impacts on the clinical workforce and patient care. British Medical Journal Open (2018) 8: e021273.
    [62] Occurrence, prevention, and management of the psychological effects of emerging virus outbreaks on healthcare workers: rapid review and meta-analysis. British Medical Journal (2020) 369:.
    [63] Experiences of frontline healthcare workers and their views about support during COVID-19 and previous pandemics: a systematic review and qualitative meta-synthesis. BMC Health Services Research (2021) 21: e923.
    [64] Caring for older adults during the COVID-19 pandemic. Clinical Microbiology and Infection (2022) .
    [65] , The effect of age on mortality in patients with Covid-19: a meta-analysis with 611,583 subjects. Journal of the American Medical Directors Association (2020) 21: 915-918.
    [66] , Social disconnectedness, perceived isolation, and symptoms of depression and anxiety among older Americans (NSHAP): a longitudinal mediation analysis. The Lancet Public Health (2020) 5: e62-70.
    [67] The effect of age, gender, income, work, and physical activity on mental health during coronavirus disease (COVID-19) lockdown in Austria. Journal of Psychosomatic Research (2020) 136: 110186.
    [68] Mental health consequences during the initial stage of the 2020 coronavirus pandemic (COVID-19) in Spain. Brain Behavior and Immunity (2020) 87: 172-176.
    [69] The impact of the COVID-19 pandemic on wellbeing and cognitive functioning of older adults. Scientific Report (2021) 11: 4636.
    [70] A study of older adults' mental health across 33 countries during the COVID-19 pandemic. International Journal of Environmental Research in Public Health (2021) 18: 5090.
    [71] Alcohol use and mental health among older American adults during the early months of the COVID-19 pandemic. International Journal of Environmental Research in Public Health (2021) 18: 4222.
    [72] How is COVID-19 pandemic impacting mental health of children and adolescents?. International Journal of Disaster Risk Reduction (2020) 51: 10184.
    [73] Challenges and burden of the Coronavirus 2019 (COVID-19) pandemic for child and adolescent mental health: a narrative review to highlight clinical and research needs in the acute phase and the long return to normality. Child and Adolescent Psychology and Mental Health (2020) 14: 20.
    [74] , COVID-19 pandemic impact on children and adolescents' mental health: Biological, environmental, and social factors. Progress in Neuro-Psychopharmacology and Biological Psychiatry (2021) 106: 110171.
    [75] Depression and anxiety among adolescents during COVID-19: a cross-sectional study. Brain Behavior and Immunity (2020) 88: 36-38.
    [76] Promotive factors associated with internalising symptoms amongst college students during the COVID-19 lockdown in Enugu metropolis, Nigeria. South Africa Journal of Psychiatry (2022) 28: 1672.
    [77] Impact of school closures for COVID-19 on the US health-care workforce and net mortality: a modelling study. The Lancet Public Health (2020) 5: e271-e278.
    [78] , Immediate impact of stay-at-home orders to control COVID-19 transmission on socioeconomic conditions, food insecurity, mental health, and intimate partner violence in Bangladeshi women and their families: An interrupted time series. The Lancet Global Health (2020) 8: e1380-e1389.
    [79] Domestic violence during the COVID-19 pandemic - Evidence from a systematic review and meta-analysis. Journal of Criminal Justice (2021) 74: 101806.
    [80] Violence against women during the COVID-19 pandemic: An integrative review. International Journal of Gynecology and Obstetric (2020) 151: 180-187.
    [81] Do psychiatric patients experience more psychiatric symptoms during COVID-19 pandemic and lockdown? A case-control study with service and research implications for immunopsychiatry. Brain, Behavior, and Immunity (2020) 87: 100-106.
    [82] Loneliness as a predictor of outcomes in mental disorders among people who have experienced a mental health crisis: A 4-month prospective study. BMC Psychiatry (2020) 20: 249.
    [83] Longitudinal analysis of the UK COVID-19 psychological wellbeing study: Trajectories of anxiety, depression and COVID-19-related stress symptomology. Psychiatry Research (2021) 304: 114138.
  • This article has been cited by:

    1. Dipti Ladli, Kanhaiya Lal, Kiran Jalem, Avinash Kumar Ranjan, 2020, chapter 7, 9781799850274, 122, 10.4018/978-1-7998-5027-4.ch007
    2. Akash Anand, 2020, chapter 10, 9781799850274, 180, 10.4018/978-1-7998-5027-4.ch010
    3. Ramandeep Kaur M. Malhi, Akash Anand, Prashant K. Srivastava, G. Sandhya Kiran, George P. Petropoulos, Christos Chalkias, An Integrated Spatiotemporal Pattern Analysis Model to Assess and Predict the Degradation of Protected Forest Areas, 2020, 9, 2220-9964, 530, 10.3390/ijgi9090530
    4. Loubna Khalile, Hassan Rhinane, Abdelhadi Kaoukaya, Hicham Lahlaoi, Forest Cover Monitoring and Change Detection in Nfifikh Forest (Morocco), 2018, 10, 2151-1950, 219, 10.4236/jgis.2018.102011
    5. Avinash Kumar Ranjan, Debasmita Sahoo, A. K. Gorai, Quantitative assessment of landscape transformation due to coal mining activity using earth observation satellite data in Jharsuguda coal mining region, Odisha, India, 2021, 23, 1387-585X, 4484, 10.1007/s10668-020-00784-0
    6. Prachi Singh, Akash Anand, Prashant K. Srivastava, Arjun Singh, Prem Chandra Pandey, 2021, 9781119615972, 170, 10.1002/9781119616016.ch11
    7. KUMAR RANJAN AVINASH, KANGA SHRUTI, DYNAMIC CHANGES IN MANGROVE FOREST AND LU/LC VARIATION ANALYSIS OVER INDIAN SUNDARBAN DELTA IN WEST BENGAL (INDIA) USING MULTI-TEMPORAL SATELLITE DATA, 2018, 13, 0973-2632, 9, 10.26634/jfet.13.3.14226
    8. Avinash Kumar Ranjan, Bikash Ranjan Parida, Paddy acreage mapping and yield prediction using sentinel-based optical and SAR data in Sahibganj district, Jharkhand (India), 2019, 27, 2366-3286, 399, 10.1007/s41324-019-00246-4
    9. ANAND AKASH, ASHWINI KUMAR, G. PATIL RAMAPPA, REMOTE SENSING BASED APPROACH ON RECENT CHANGES IN PLATFORM OF RIVER GANGA FROM MIRZAPUR TO BALLIA, 2018, 13, 0973-2632, 19, 10.26634/jfet.13.4.14471
    10. Manish Kumar Pandey, Prashant K. Srivastava, George P. Petropoulos, 2021, 9780128186176, 429, 10.1016/B978-0-12-818617-6.00006-8
    11. Swati Maurya, Prashant K. Srivastava, Aradhana Yaduvanshi, Akash Anand, George P. Petropoulos, Lu Zhuo, R.K. Mall, Soil erosion in future scenario using CMIP5 models and earth observation datasets, 2021, 594, 00221694, 125851, 10.1016/j.jhydrol.2020.125851
    12. Avinash Kumar Ranjan, Amit Kumar Gorai, Characterization of vegetation dynamics using MODIS satellite products over stone-mining dominated Rajmahal Hills in Jharkhand, India, 2022, 27, 23529385, 100802, 10.1016/j.rsase.2022.100802
    13. Akash Anand, 2022, chapter 21, 9781668456781, 402, 10.4018/978-1-6684-5678-1.ch021
    14. N. Mohan Reddy, Ishtiyak Ahmad Peerzada, Mohammad Moonis, Ombir Singh, 2022, Chapter 19, 978-981-19-0070-9, 399, 10.1007/978-981-19-0071-6_19
    15. Arvind Chandra Pandey, Neha Kumari, Shahbaz Ahmad, Amit Kumar, Purabi Saikia, Bikash Parida, Satendra Kumar Chaudhary, Nikhil Lele, Evaluating biochemical and biophysical characteristics of tropical deciduous forests of eastern India using remote sensing and in-situ parameter estimation, 2023, 29, 23529385, 100909, 10.1016/j.rsase.2022.100909
    16. Satendra Kumar Chaudhary, Arvind Chandra Pandey, Bikash Ranjan Parida, Saurabh Kumar Gupta, Using geoinformatics to link forest fire severity and fragmentation in India's Dalma Wildlife Sanctuary, 2022, 63, 0564-3295, 453, 10.1007/s42965-021-00202-0
    17. A. Nagaraju, M.Ajith Kumar reddy, CH. Venugopal reddy, R. Mohandas, 2021, Multifactor Analysis to Predict Best Crop using Xg-Boost Algorithm, 978-1-6654-1571-2, 155, 10.1109/ICOEI51242.2021.9452918
    18. Avinash Kumar Ranjan, Bikash Ranjan Parida, Jadunandan Dash, Amit Kumar Gorai, Quantifying the impacts of opencast mining on vegetation dynamics over eastern India using the long-term Landsat-series satellite dataset, 2022, 71, 15749541, 101812, 10.1016/j.ecoinf.2022.101812
    19. Ramandeep Kaur M. Malhi, Akash Anand, Prashant K. Srivastava, Sumit K. Chaudhary, Manish K. Pandey, Mukund Dev Behera, Amit Kumar, Prachi Singh, G. Sandhya Kiran, Synergistic evaluation of Sentinel 1 and 2 for biomass estimation in a tropical forest of India, 2022, 69, 02731177, 1752, 10.1016/j.asr.2021.03.035
    20. Garima Toor, Tarush Chandra, 2022, chapter 11, 9781799883319, 219, 10.4018/978-1-7998-8331-9.ch011
    21. Ionuț Șandric, Radu Irimia, George P. Petropoulos, Akash Anand, Prashant K. Srivastava, Alin Pleșoianu, Ioannis Faraslis, Dimitrios Stateras, Dionissios Kalivas, Tree's detection & health's assessment from ultra-high resolution UAV imagery and deep learning, 2022, 37, 1010-6049, 10459, 10.1080/10106049.2022.2036824
    22. Lili Chang, Rui Zhang, Chunsheng Wang, Evaluation and Prediction of Landslide Susceptibility in Yichang Section of Yangtze River Basin Based on Integrated Deep Learning Algorithm, 2022, 14, 2072-4292, 2717, 10.3390/rs14112717
    23. Shahbaz Ahmad, Arvind Chandra Pandey, Amit Kumar, Nikhil V. Lele, Bimal K. Bhattacharya, Primary productivity estimation of forest based on in-situ biophysical parameters and sentinel satellite data using vegetation photosynthesis model in an eastern Indian tropical dry deciduous forest, 2022, 63, 0564-3295, 409, 10.1007/s42965-022-00220-6
    24. Zhe Jia, Anchen Qin, Bijeesh Kozhikkodan Veettil, Evaluation of the spatial distribution of scenic resources based on 3S technology: A case study of the Yesanpo National Park, 2022, 17, 1932-6203, e0269841, 10.1371/journal.pone.0269841
    25. Avinash Kumar Ranjan, Bikash Ranjan Parida, Jadunandan Dash, Amit Kumar Gorai, Evaluating Impacts of Opencast Stone Mining on Vegetation Primary Production and Transpiration over Rajmahal Hills, 2023, 15, 2071-1050, 8005, 10.3390/su15108005
    26. Siti Latifah, Farid Akhsani, Eva Indra Sofiana, Mohammad Riski Ferdiansah, Land cover change assessment using random forest and CA markov from remote sensing images in the protected forest of South Malang, Indonesia, 2023, 32, 23529385, 101061, 10.1016/j.rsase.2023.101061
    27. Mrinmay Mandal, Nilanjana Das Chatterjee, 2023, Chapter 6, 978-3-031-33605-8, 103, 10.1007/978-3-031-33606-5_6
    28. Pawan Kumar Thakur, Sher Singh Samant, Raj Kumar Verma, Atul Saini, Monika Chauhan, Monitoring forest cover changes and its impact on land surface temperature using geospatial technique in Talra Wildlife Sanctuary, Shimla, India, 2024, 1573-2975, 10.1007/s10668-023-04347-x
    29. Ryan Nedd, Katie Light, Marcia Owens, Neil James, Elijah Johnson, Aavudai Anandhi, A Synthesis of Land Use/Land Cover Studies: Definitions, Classification Systems, Meta-Studies, Challenges and Knowledge Gaps on a Global Landscape, 2021, 10, 2073-445X, 994, 10.3390/land10090994
    30. Huijuan Wang, Zhiguo Qi, Haiming Yan, Huicai Yang, Variation Characteristics of Land Use Change Within the Beijing–Tianjin–Hebei Region During 1985–2022, 2024, 13, 2073-445X, 1997, 10.3390/land13121997
    31. Dayamoy Mandal, Debasis Ghosh, Multitemporal Assessment of Ecosystem Service Values and Carbon Sequestration in a Protected Ecosystem: A Case Study from Dalma Wildlife Sanctuary in Jharkhand, India, 2025, 19, 1735-6865, 10.1007/s41742-025-00782-y
    32. Avinash Kumar Ranjan, Kamlesh Kumar Sahoo, Pasupunti Manasa, Amit Kumar Gorai, Assessing the Role of Urban Expansion in an Industrial City (Rourkela, India) on Land Use/Land Cover Dynamics and its Impacts on Aerosols and Land Surface Temperature, 2025, 0255-660X, 10.1007/s12524-025-02222-y
  • Reader Comments
  • © 2022 the Author(s), licensee AIMS Press. This is an open access article distributed under the terms of the Creative Commons Attribution License (http://creativecommons.org/licenses/by/4.0)
通讯作者: 陈斌, bchen63@163.com
  • 1. 

    沈阳化工大学材料科学与工程学院 沈阳 110142

  1. 本站搜索
  2. 百度学术搜索
  3. 万方数据库搜索
  4. CNKI搜索

Metrics

Article views(2964) PDF downloads(107) Cited by(1)

Article outline

Figures and Tables

Figures(7)  /  Tables(4)

/

DownLoad:  Full-Size Img  PowerPoint
Return
Return

Catalog