In this work, we introduce continuous piecewise-linear approximation via stochastic search (CPLASS), an algorithm for detecting changes in velocity within multidimensional data. The one-dimensional version of this problem is known as the change-in-slope problem. Unlike traditional changepoint detection methods that focus on changes in mean, detecting changes in velocity requires a specialized approach due to continuity constraints and parameter dependencies, which frustrate popular algorithms like binary segmentation and dynamic programming. To overcome these difficulties, we introduce a tailored penalty function to balance improvements in likelihood due to model complexity and a Markov chain Monte Carlo (MCMC)-based approach with tailored proposal mechanisms for efficient parameter exploration. Our method is particularly suited for analyzing intracellular transport data, where the multidimensional trajectories of microscale cargo are driven by teams of molecular motors that undergo complex biophysical transitions. To ensure biophysical realism in the results, we introduce a speed penalty that discourages overfitting of short noisy segments while maintaining consistency in the large-sample limit. Additionally, we introduce a summary statistic called the cumulative speed allocation (CSA), which is robust with respect to idiosyncrasies of changepoint detection while maintaining the ability to discriminate between biophysically distinct populations.
Citation: Linh Do, Dat Do, Keisha J. Cook, Yitao Shen, Scott A. McKinley. Change-in-velocity detection in multidimensional data[J]. Mathematical Biosciences and Engineering, 2026, 23(11): 3241-3272. doi: 10.3934/mbe.2026112
In this work, we introduce continuous piecewise-linear approximation via stochastic search (CPLASS), an algorithm for detecting changes in velocity within multidimensional data. The one-dimensional version of this problem is known as the change-in-slope problem. Unlike traditional changepoint detection methods that focus on changes in mean, detecting changes in velocity requires a specialized approach due to continuity constraints and parameter dependencies, which frustrate popular algorithms like binary segmentation and dynamic programming. To overcome these difficulties, we introduce a tailored penalty function to balance improvements in likelihood due to model complexity and a Markov chain Monte Carlo (MCMC)-based approach with tailored proposal mechanisms for efficient parameter exploration. Our method is particularly suited for analyzing intracellular transport data, where the multidimensional trajectories of microscale cargo are driven by teams of molecular motors that undergo complex biophysical transitions. To ensure biophysical realism in the results, we introduce a speed penalty that discourages overfitting of short noisy segments while maintaining consistency in the large-sample limit. Additionally, we introduce a summary statistic called the cumulative speed allocation (CSA), which is robust with respect to idiosyncrasies of changepoint detection while maintaining the ability to discriminate between biophysically distinct populations.

| [1] |
S. P. Gross, Hither and yon: a review of bi-directional microtubule-based transport, Phys. Biol., 1 (2004), R1. https://doi.org/10.1088/1478-3967/1/2/R01 doi: 10.1088/1478-3967/1/2/R01
|
| [2] |
A. Kunwar, S. K. Tripathy, J. Xu, M. K. Mattson, P. Anand, R. Sigua, et al., Mechanical stochastic tug-of-war models cannot explain bidirectional lipid-droplet transport, PNAS, 108 (2011), 18960–18965. https://doi.org/10.1073/pnas.1107841108 doi: 10.1073/pnas.1107841108
|
| [3] |
W. O. Hancock, Bidirectional cargo transport: Moving beyond tug of war, Nat. Rev. Mol. Cell Biol., 15 (2014), 615–628. https://doi.org/10.1038/nrm3853 doi: 10.1038/nrm3853
|
| [4] |
M. Lavielle, G. Teyssière, Adaptive detection of multiple change-points in asset price volatility, in Long Memory in Economics, Springer Berlin Heidelberg, Berlin, Heidelberg, (2007), 129–156. https://doi.org/10.1007/978-3-540-34625-8_5 |
| [5] |
J. Bai, P. Perron, estimating and testing linear models with multiple structural changes, Econometrica, 66 (1998), 47–78. https://doi.org/10.2307/2998540 doi: 10.2307/2998540
|
| [6] |
K. Frick, A. Munk, H. Sieling, Multiscale change point inference, J. R. Stat. Soc. B, 76 (2014), 495–580. https://doi.org/10.1111/rssb.12047 doi: 10.1111/rssb.12047
|
| [7] |
A. Futschik, T. Hotz, A. Munk, H. Sieling, Multiscale DNA partitioning: statistical evidence for segments, Bioinformatics, 30 (2014), 2255–2262. https://doi.org/10.1093/bioinformatics/btu180 doi: 10.1093/bioinformatics/btu180
|
| [8] |
Y. Niu, H. Zhang, The screening and ranking algorithm to detect DNA copy number variations, Ann. Appl. Stat., 6 (2012), 1306–1326. https://doi.org/10.1214/12-AOAS539 doi: 10.1214/12-AOAS539
|
| [9] |
R. Killick, I. A. Eckley, K. Ewans, P. Jonathan, Detection of changes in variance of oceanographic time-series using changepoint analysis, Ocean Eng., 37 (2010), 1120–1126. https://doi.org/10.1016/j.oceaneng.2010.04.009 doi: 10.1016/j.oceaneng.2010.04.009
|
| [10] |
R. Killick, P. Fearnhead, I. A. Eckley, Optimal detection of changepoints with a linear computational cost, J. Am. Stat. Assoc., 107 (2012), 1590–1598. https://doi.org/10.1080/01621459.2012.737745 doi: 10.1080/01621459.2012.737745
|
| [11] |
B. Jackson, J. Scargle, D. Barnes, S. Arabhi, A. Alt, P. Gioumousis, et al., An algorithm for optimal partitioning of data on an interval, IEEE Signal Process. Lett., 12 (2005), 105–108. https://doi.org/10.1109/LSP.2001.838216 doi: 10.1109/LSP.2001.838216
|
| [12] |
P. Fearnhead, R. Maidstone, A. Letchford, Detecting changes in slope with an $\ell_0$ penalty, J. Comput. Graphical Stat., 28 (2019), 265–275. https://doi.org/10.1080/10618600.2018.1512868 doi: 10.1080/10618600.2018.1512868
|
| [13] |
P. Fearnhead, D. Grose, cpop: Detecting changes in piecewise-linear signals, J. Stat. Software, 109 (2024), 1–30. https://doi.org/10.18637/jss.v109.i07 doi: 10.18637/jss.v109.i07
|
| [14] |
S. J. Kim, K. Koh, S. Boyd, D. Gorinevsky, $\ell_1$ trend filtering, SIAM Rev., 51 (2009), 339–360. https://doi.org/10.1137/070690274 doi: 10.1137/070690274
|
| [15] |
R. Baranowski, Y. Chen, P. Fryzlewicz, Narrowest-over-threshold detection of multiple change points and change-point-like features, J. R. Stat. Soc. B, 81 (2019), 649–672. https://doi.org/10.1111/rssb.12322 doi: 10.1111/rssb.12322
|
| [16] |
P. Fryzlewicz, Narrowest significance pursuit: inference for multiple change-points in linear models, J. Am. Stat. Assoc., 119 (2024), 1633–1646. https://doi.org/10.1080/01621459.2023.2211733 doi: 10.1080/01621459.2023.2211733
|
| [17] |
N. Monnier, S. M. Guo, M. Mori, J. He, P. Lénárt, M. Bathe, Bayesian approach to MSD-based analysis of particle motion in live cells, Biophys. J., 103 (2012), 616–626. https://doi.org/10.1016/j.bpj.2012.06.029 doi: 10.1016/j.bpj.2012.06.029
|
| [18] |
C. Manzo, M. F. Garcia-Parajo, A Review of progress in single particle tracking: From methods to biophysical insights, Rep. Prog. Phys., 78 (2015), 124601. https://doi.org/10.1088/0034-4885/78/12/124601 doi: 10.1088/0034-4885/78/12/124601
|
| [19] |
F. Persson, M. Lindén, C. Unoson, J. Elf, Extracting intracellular diffusive states and transition rates from single-molecule tracking data, Nat. Methods, 10 (2013), 265–269. https://doi.org/10.1038/nmeth.2367 doi: 10.1038/nmeth.2367
|
| [20] |
J. D. Karslake, E. D. Donarski, S. A. Shelby, L. M. Demey, V. J. DiRita, S. L. Veatch, et al., SMAUG: Analyzing single-molecule tracks with nonparametric Bayesian statistics, Methods, 193 (2021), 16–26. https://doi.org/10.1016/j.ymeth.2020.03.008 doi: 10.1016/j.ymeth.2020.03.008
|
| [21] |
S. Neumann, R. Chassefeyre, G. E. Campbell, S. E. Encalada, KymoAnalyzer: A software tool for the quantitative analysis of intracellular transport in neurons, Traffic, 18 (2017), 71–88. https://doi.org/10.1111/tra.12456 doi: 10.1111/tra.12456
|
| [22] |
M. A. Jensen, Q. Feng, W. O. Hancock, S. A. McKinley, A change point analysis protocol for comparing intracellular transport by different molecular motor combinations, Math. Biosci. Eng., 18 (2021), 8962–8996. https://doi.org/10.3934/mbe.2021442 doi: 10.3934/mbe.2021442
|
| [23] |
S. Yin, N. Song, H. Yang, Detection of velocity and diffusion coefficient change points in single-particle trajectories, Biophy. J., 115 (2018), 217–229. https://doi.org/10.1016/j.bpj.2017.11.008 doi: 10.1016/j.bpj.2017.11.008
|
| [24] |
A. Sosa-Costa, I. K. Piechocka, L. Gardini, F. S. Pavone, M. Capitanio, M. F. Garcia-Parajo, et al., PLANT: A method for detecting changes of slope in noisy trajectories, Biophys. J., 114 (2018), 2044–2051. https://doi.org/10.1016/j.bpj.2018.04.006 doi: 10.1016/j.bpj.2018.04.006
|
| [25] |
N. T. Rayens, K. J. Cook, S. A. McKinley, C. K. Payne, Transport of lysosomes decreases in the perinuclear region: Insights from changepoint analysis, Biophys. J., 121 (2022), 1205–1218. https://doi.org/10.1016/j.bpj.2022.02.032 doi: 10.1016/j.bpj.2022.02.032
|
| [26] |
P. Fryzlewicz, S. Rao, Multiple-change-point detection for auto-regressive conditional heteroscedastic processes, J. R. Stat. Soc. B, 76 (2014), 903–924. https://doi.org/10.1111/rssb.12054 doi: 10.1111/rssb.12054
|
| [27] |
P. Thyagarajan, C. Feng, D. Lee, M. Shorey, M. M. Rolls, Microtubule polarity is instructive for many aspects of neuronal polarity, Dev. Biol., 486 (2022), 56–70. https://doi.org/10.1016/j.ydbio.2022.03.009 doi: 10.1016/j.ydbio.2022.03.009
|
| [28] |
H. G. Scanlon, G. Mahata, A. C. Nelson, S. A. McKinley, M. M. Rolls, M. V. Ciocanel, Nucleation feedback can drive establishment and maintenance of biased microtubule polarity in neurites, Math. Biosci., 389 (2025), 109538. https://doi.org/10.1016/j.mbs.2025.109538 doi: 10.1016/j.mbs.2025.109538
|
| [29] |
K. J. Cook, N. Rayens, L. Do, C. K. Payne, S. A. McKinley, Considering experimental frame rates and robust segmentation analysis of piecewise-linear microparticle trajectories, Math. Biosci. Eng., 22 (2025), 2595–2626. https://doi.org/10.3934/mbe.2025095 doi: 10.3934/mbe.2025095
|
| [30] |
M. Lavielle, Optimal segmentation of random processes, IEEE Trans. Signal Process., 46 (1998), 1365–1373. https://doi.org/10.1109/78.668798 doi: 10.1109/78.668798
|
| [31] |
P. Fryzlewicz, Wild binary segmentation for multiple change-point detection, Ann. Stat., 42 (2014), 2243 – 2281. https://doi.org/10.1214/14-AOS1245 doi: 10.1214/14-AOS1245
|
| [32] |
Y. C. Yao, Estimating the number of change-points via Schwarz' criterion, Stat. Probab. Lett., 6 (1988), 181–189. https://doi.org/10.1016/0167-7152(88)90118-6 doi: 10.1016/0167-7152(88)90118-6
|
| [33] |
T. L. Do, Changepoint Detection: Theory, Algorithms, and Application in Intracellular Transport, Ph.D dissertation, Tulane University, 2025, |
| [34] |
L. Do, D. Do, S. A. McKinley, Consistency of penalized maximum likelihood estimation for multidimensional change-in-velocity detection, preprint, arXiv: 2610.04191, 2026. https://arXiv.org/abs/2610.04191 |
| [35] |
M. Lavielle, E. Lebarbier, An application of MCMC methods for the multiple change-points problem, Signal Process., 81 (2001), 39–53. https://doi.org/10.1016/S0165-1684(00)00189-4 doi: 10.1016/S0165-1684(00)00189-4
|
| [36] |
P. J. Green, Reversible jump Markov chain Monte Carlo computation and Bayesian model determination, Biometrika, 82 (1995), 711–732. https://doi.org/10.1093/biomet/82.4.711 doi: 10.1093/biomet/82.4.711
|
| [37] |
J. Y. Tinevez, N. Perry, J. Schindelin, G. M. Hoopes, G. D. Reynolds, E. Laplantine, et al., TrackMate: An open and extensible platform for single-particle tracking, Methods, 115 (2017), 80–90. https://doi.org/10.1016/j.ymeth.2016.09.016 doi: 10.1016/j.ymeth.2016.09.016
|
| [38] |
M. K. Gardner, M. Zanic, J. Howard, Microtubule catastrophe and rescue, Curr. Opin. Cell Biol., 25 (2013), 14–22. https://doi.org/10.1016/j.ceb.2012.09.006 doi: 10.1016/j.ceb.2012.09.006
|
| [39] |
C. Feng, P. Thyagarajan, M. Shorey, D. Y. Seebold, A. T. Weiner, R. M. Albertson, et al., Patronin-mediated minus end growth is required for dendritic microtubule polarity, J. Cell Biol., 218 (2019), 2309–2328. https://doi.org/10.1083/jcb.201810155 doi: 10.1083/jcb.201810155
|
| [40] |
A. C. Nelson, M. M. Rolls, M. V. Ciocanel, S. A. McKinley, Minimal mechanisms of microtubule length regulation in living cells, Bull. Math. Biol., 86 (2024), 58. https://doi.org/10.1007/s11538-024-01279-z doi: 10.1007/s11538-024-01279-z
|
 mbe-23-11-112-supplementary.pdf |
 |
Figures(13) / Tables(1)

Linh Do, Dat Do, Keisha J. Cook, Yitao Shen, Scott A. McKinley. Change-in-velocity detection in multidimensional data[J]. Mathematical Biosciences and Engineering, 2026, 23(11): 3241-3272. doi: 10.3934/mbe.2026112

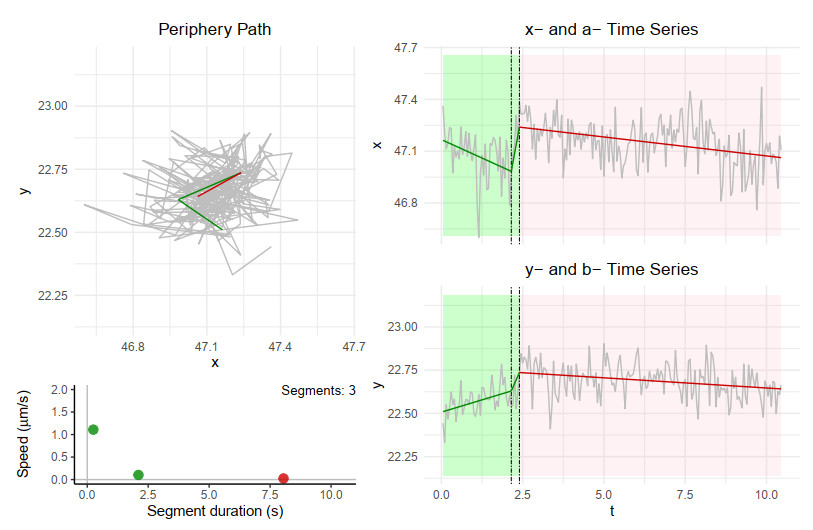
Representative lysosome trajectory in the periphery of a cell from [25]. The gray curves show the observed trajectory in the $ x $–$ y $ plane and the corresponding coordinate-wise time series. The green and red curves denote the inferred anchor positions, colored by inferred state: green indicates motile segments, and red indicates stationary segments. Green and red shaded regions indicate motile and stationary segments, respectively. In the segment-duration versus speed plot, point colors correspond to the inferred segment state
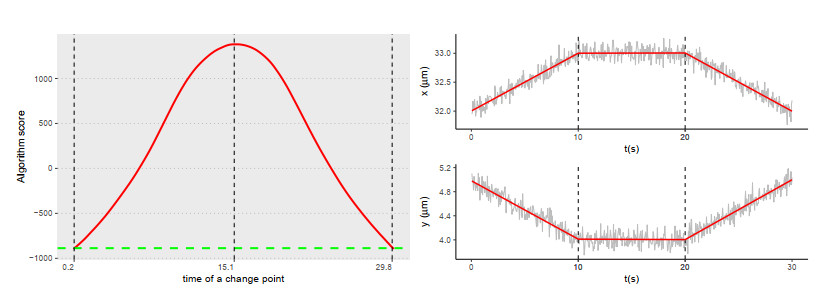
Failure of binary segmentation in a change-in-velocity setting. A 2D trajectory was simulated for 30 s at 20 Hz ($ \sigma = 0.1 $), with true changepoints at 10 and 20 s and segment velocities $ (v_x, v_y) = (0.1, -0.1) $, $ (0, 0) $, and $ (-0.1, 0.1)\, \mu $m/s. Left: CPLASS criterion values for the null (green dashed) and one-changepoint models (red solid), showing that binary segmentation introduces a spurious changepoint (higher value is better). Right: Observed $ x $ and $ y $ positions (gray), true changepoints (dashed), and fitted segmentation (red)
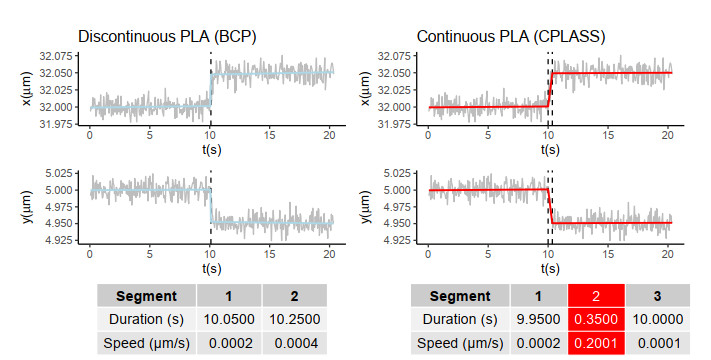
Discontinuous versus continuous piecewise-linear approximations. A simulated 2D lysosomal trajectory is shown via $ t $–$ x $ and $ t $–$ y $ time series, with true changepoints at 9 and 10.35 s. Detected changepoints are shown as dashed lines, with the fitted segmentation overlaid in red. The red column in the CPLASS output table indicates a significant active segment missed by BCP
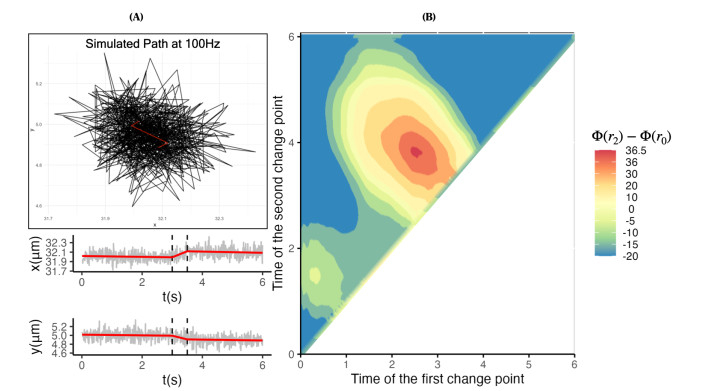
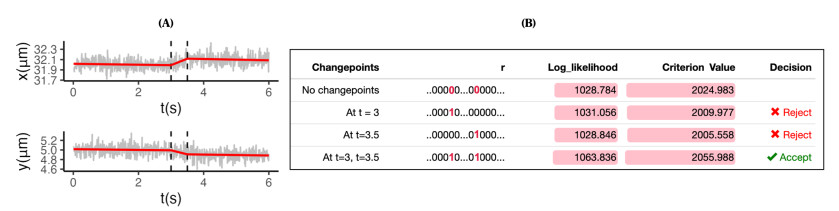
Example showing why gradient ascent is unsuitable for the change-in-speed problem. (A) A simulated 2D lysosomal trajectory (100 Hz, 6 s) with true changepoints at 3 and 3.5 s and segment speeds $ (0, 0.2, 0)\, \mu $m/s. Noisy $ t $–$ x $ and $ t $–$ y $ time series are shown in gray, with true changepoints (dashed) and the true segmentation (red). (B) Contours of CPLASS score differences between the two-changepoint model $ \Phi(r_2) $ and the no-changepoint model $ \Phi(r_0) $. Although the global maximum occurs at the true changepoints, gradient ascent can become trapped in local maxima and fail to recover them
Necessity of the new proposal function (Numerical Experiment 2.4.2). (A) A simulated 2D lysosomal trajectory (100 Hz, 6 s) with true changepoints at 3 and 3.5 s, shown in $ t $–$ x $ and $ t $–$ y $ coordinates. True changepoints are dashed; the fitted segmentation is overlaid in red. (B) Candidate changepoint models with their log-likelihoods, criterion values, and corresponding MH decisions (Algorithm 1)
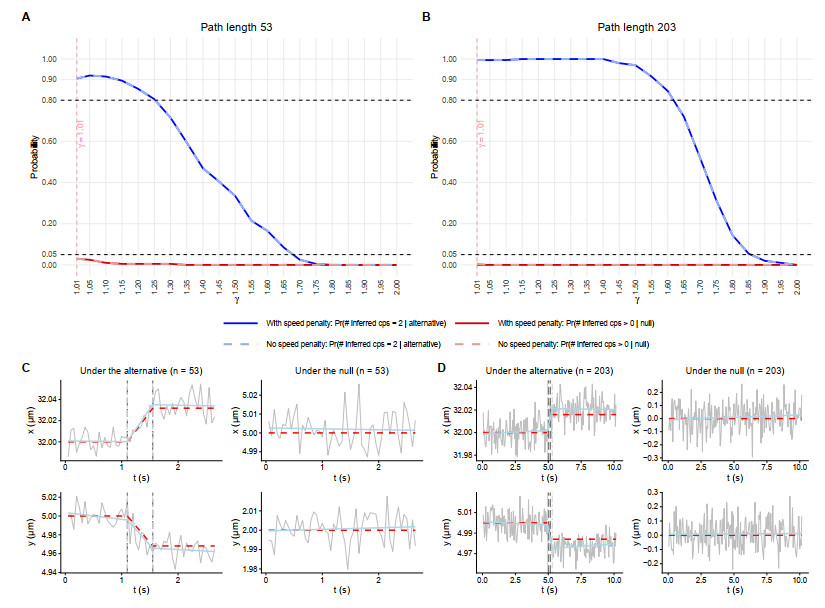
Sensitivity of CPLASS to $ \gamma $. (A) Detection probabilities for $ n = 53 $. (B) Corresponding results for $ n = 203 $. Blue curves show $ \Pr(\widehat{|r|} = 2\mid H_1) $, and red curves show $ \Pr(\widehat{|r|} > 0\mid H_0) $. Dark solid and light dashed curves denote CPLASS with and without the speed penalty, respectively. The vertical line marks $ \gamma = 1.01 $; horizontal lines mark probabilities 0.80 and 0.05. (C, D) Representative trajectories (path 1) for $ n = 53 $ and $ n = 203 $. Gray curves show observations, red dashed curves show the generating trajectories, and blue curves show CPLASS fits. Gray long-dashed and black double-dashed vertical lines mark inferred and true changepoints, respectively
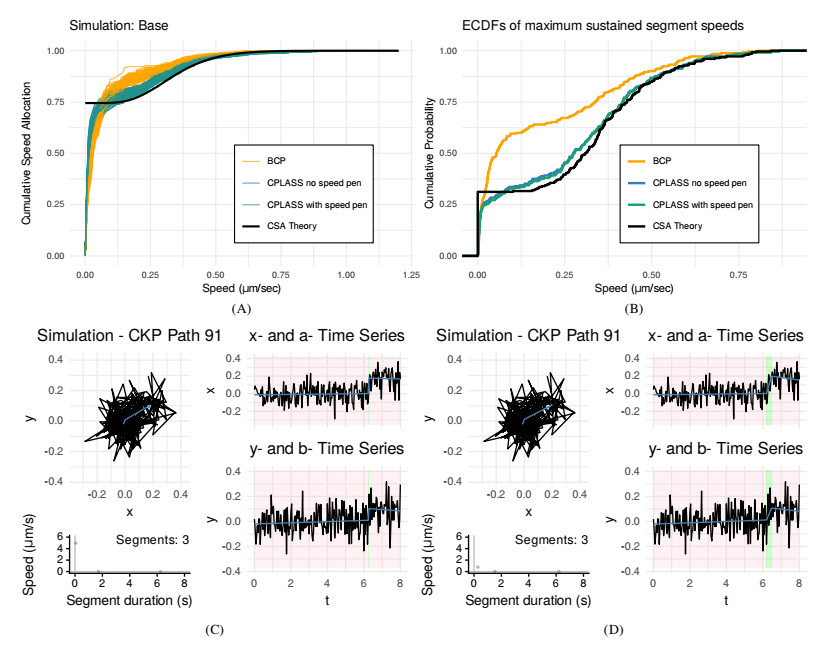
Necessity of the speed penalty (Section 3.1.2). We simulated 250 trajectories from the parameter sets in Table 1 of [29], sampled at 25 Hz. (A) CSA: theoretical CSA (black), CPLASS with speed penalty (green), CPLASS without speed penalty (blue), and BCP [25] (orange). (B) Empirical cumulative distributions of maximum sustained segment speeds (minimum duration $ 0.6 $ s) for BCP (orange), CPLASS with (green) and without (blue) the speed penalty, compared with the true values (black). (C, D) A representative trajectory after running CPLASS without/with speed penalty
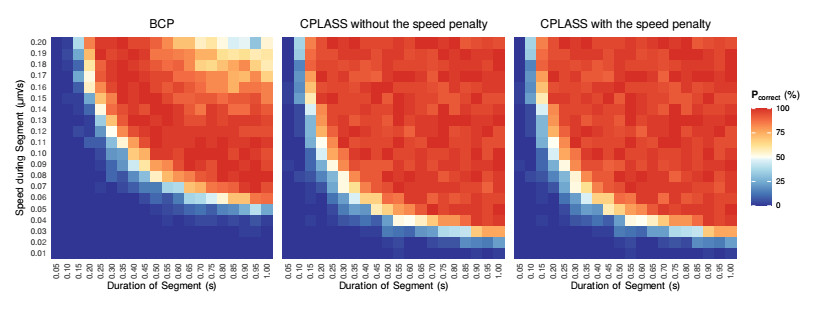
Power analysis comparing CPLASS and BCP (Section 3.2). A total of 20,000 trajectories were simulated at 20 Hz with two true changepoints ($ \sigma = 0.01 $). The first and third segments have fixed durations of 2 s, while the middle segment varies across 20 durations and 20 speeds ($ \mu $m/s). For each speed–duration pair, 50 trajectories were generated. The detection rate $ {\bf P}_{\text{correct}} $ is the percentage of paths for which the correct number of changepoints is identified. Trajectories follow the same simulation design as Figure 6(C), (D)
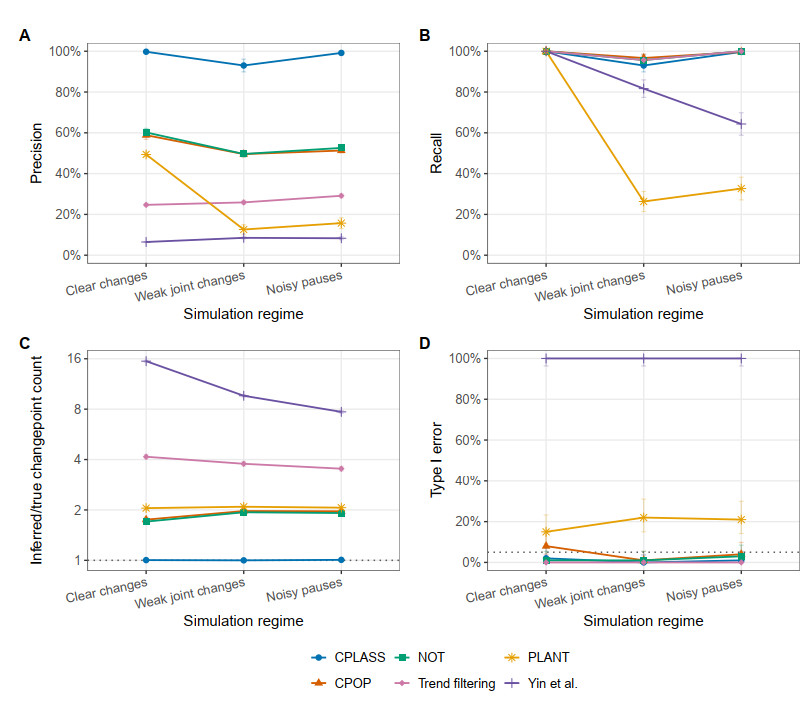
Comparison of CPLASS with alternative changepoint methods. Results are based on 100 frozen trajectories per method and simulation regime. (A) Precision, defined as the proportion of inferred changepoints matched to a generating changepoint. (B) Recall, defined as the proportion of generating changepoints successfully localized. In panels A and B, matches were determined one-to-one within five observations ($0.20$ s). (C) Ratio of the inferred to the true number of changepoints. The dotted line denotes the correct ratio of one, and the vertical axis is logarithmic. (D) Type Ⅰ error, defined as the proportion of null trajectories for which at least one changepoint was selected. The dotted line denotes $5\%$. Scalar methods were applied separately to the $x$- and $y$-coordinates, followed by exact union of the reported changepoints. Error bars in panels A–C show normal-approximation $95\%$ intervals for the trajectory-level means; error bars in panel D show $95\%$ Wilson intervals
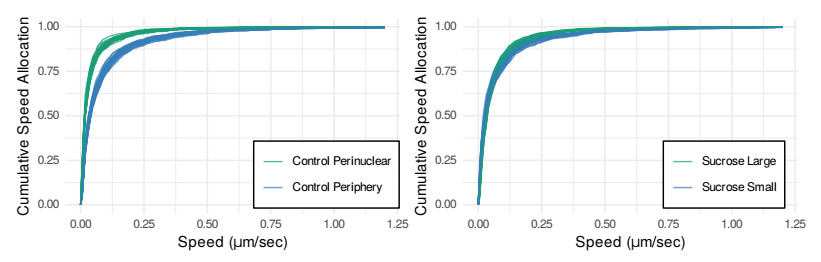
CSA plots for different group comparisons (Section 3.4). (Left) The CSA bootstrap ensemble curves compare lysosomal transport in perinuclear and periphery regions. (Right) The CSA bootstrap ensemble curves compare the sucrose-treated groups restricted to the periphery region of the cell from [25]
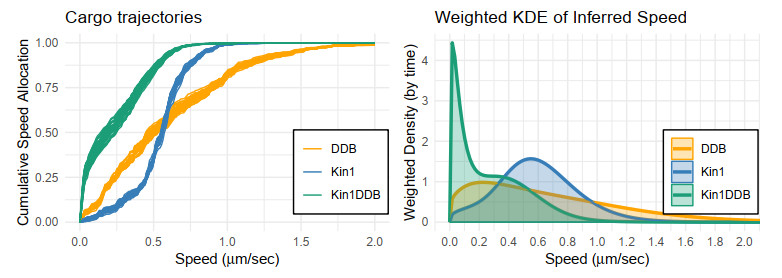
CSA plot for different motor families (Section 3.5). (Left) The CSA bootstrap ensemble curves compare cargo trajectories among three groups of motor transports: kinesin-1 (Kin1), dynein-dynactin-BicD2 (DDB), and kinesin-1/DDB pairs. (Right) WKDE of inferred segment speeds, duration-weighted, for the three groups
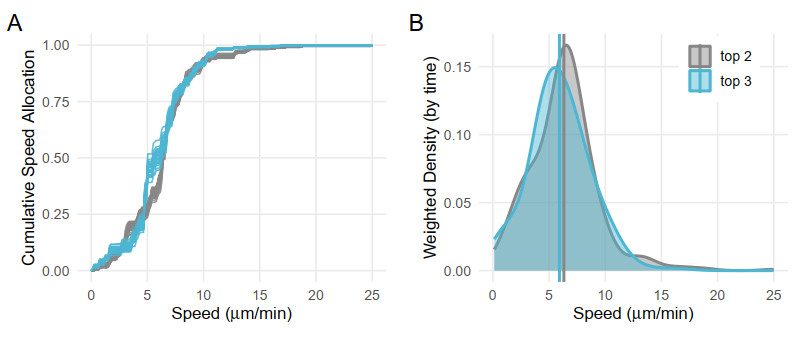
CSA and WKDE plots for EB1-GFP microtubule comet trajectories (Section 3.6). (A) CSA bootstrap ensemble curves compare inferred speeds across two larvae of the same cell type (top 2: 14 trajectories, gray; top 3: 16 trajectories, teal). (B) Duration-weighted kernel density estimates (WKDEs) of inferred segment speeds for the same two animals. Vertical lines indicate the duration-weighted mean speed for each animal (top 2: $ 6.32\, \mu\mathrm{m}/\mathrm{min} $, gray; top 3: $ 5.92\, \mu\mathrm{m}/\mathrm{min} $, teal). Both panels report speeds in $ \mu\mathrm{m}/\mathrm{min} $. The similar distributions across the two animals suggest that CPLASS provides a stable summary of EB1-GFP comet speed in this preliminary dataset
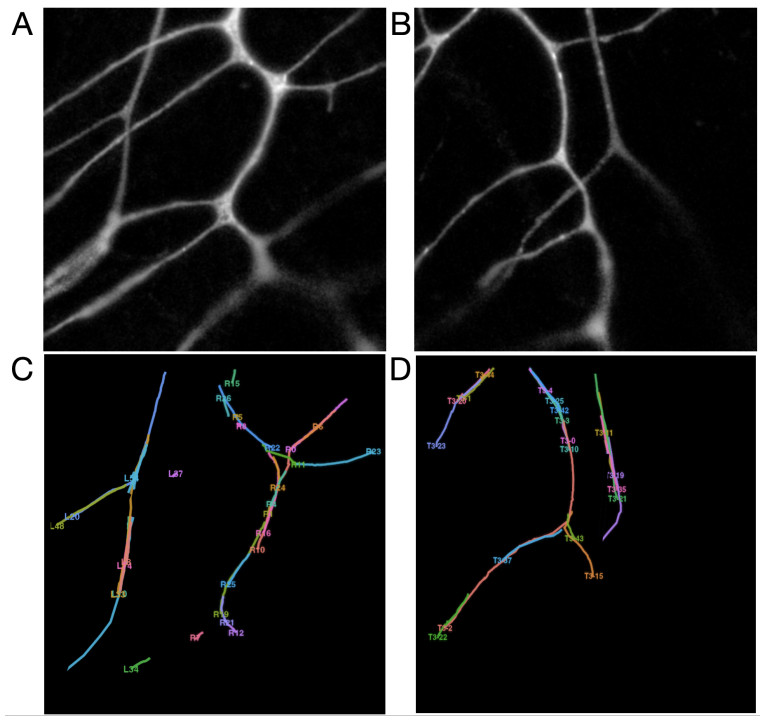
EB1-GFP microtubule comet imaging and TrackMate trajectory output (Section 3.6). (A, B) Representative first frames from two imaging videos of the same cell type (class Ⅰ da sensory neuron) from two different larvae of the same genotype (top 2 and top 3, respectively). Each video is a zoomed-in field of view of the dendritic arbor; the neuron's cell body (soma) lies outside the imaged region, above the field shown, and dendrite direction is defined relative to it ("top" denotes the side nearer the soma, used to establish comet travel direction). EB1-GFP labels the growing plus ends of microtubules within these dendrites. The bright branching structures illustrate the curved and spatially complex geometry along which comets were tracked. (C) Comet trajectories extracted from the top 2 video using TrackMate, with each color representing a distinct tracked comet. (D) Comet trajectories for the top 3 video. These trajectories serve as input to CPLASS, which segments each path into piecewise-linear velocity segments as summarized in Figure 12. The branched and curved trajectory shapes in panels C and D reflect the underlying dendritic geometry visible in panels A and B




 DownLoad: