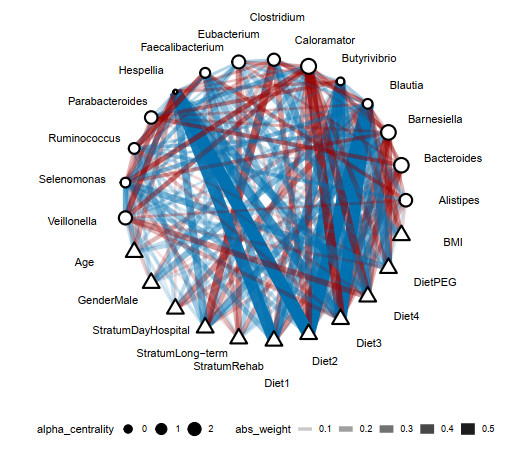
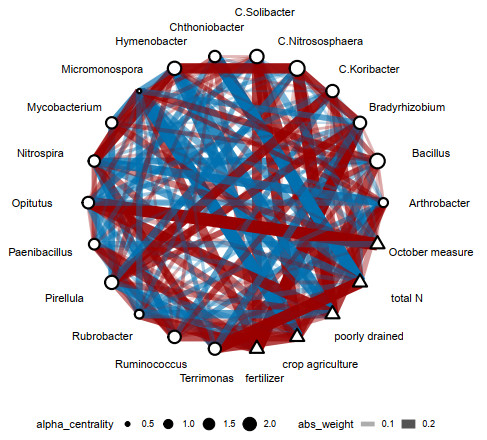
Microbiome data require statistical models that can simultaneously decode microbes' reaction to the environment and interactions among microbes. While a multiresponse linear regression model seems like a straight-forward solution, we argue that treating it as a graphical model is problematic given that the regression coefficient matrix does not encode the conditional dependence structure between response and predictor nodes. This observation is especially important in biological settings when we have prior knowledge on the edges from specific experimental interventions that can only be properly encoded under a conditional dependence model. Here, we propose a chain graph model with two sets of nodes (predictors and responses) whose solution yields a graph with edges that indeed represent conditional dependence, thus agreeing with the experimenter's intuition on the average behavior of nodes under treatment. The solution to our model is sparse via the Bayesian linear regression (LASSO). In addition, we propose an adaptive extension so that different shrinkages can be applied to different edges to incorporate edge-specific prior knowledge. Our model is computationally inexpensive through an efficient Gibbs sampling algorithm and can account for binary, counting, and compositional responses via an appropriate hierarchical structure. We test the performance of our model in a variety of simulated datasets, thereby showing superior performance to state-of-the-art approaches. We further apply our model to human gut and soil microbial compositional datasets, and we highlight that CG-LASSO can estimate biologically meaningful network structures in the data. Our software is available as an R package at https://github.com/YunyiShen/CAR-LASSO.
Citation: Yunyi Shen, Claudia Solís-Lemus. Bayesian chain graph models to characterize microbe-environment dynamics[J]. Mathematical Biosciences and Engineering, 2026, 23(2): 499-546. doi: 10.3934/mbe.2026020
Microbiome data require statistical models that can simultaneously decode microbes' reaction to the environment and interactions among microbes. While a multiresponse linear regression model seems like a straight-forward solution, we argue that treating it as a graphical model is problematic given that the regression coefficient matrix does not encode the conditional dependence structure between response and predictor nodes. This observation is especially important in biological settings when we have prior knowledge on the edges from specific experimental interventions that can only be properly encoded under a conditional dependence model. Here, we propose a chain graph model with two sets of nodes (predictors and responses) whose solution yields a graph with edges that indeed represent conditional dependence, thus agreeing with the experimenter's intuition on the average behavior of nodes under treatment. The solution to our model is sparse via the Bayesian linear regression (LASSO). In addition, we propose an adaptive extension so that different shrinkages can be applied to different edges to incorporate edge-specific prior knowledge. Our model is computationally inexpensive through an efficient Gibbs sampling algorithm and can account for binary, counting, and compositional responses via an appropriate hierarchical structure. We test the performance of our model in a variety of simulated datasets, thereby showing superior performance to state-of-the-art approaches. We further apply our model to human gut and soil microbial compositional datasets, and we highlight that CG-LASSO can estimate biologically meaningful network structures in the data. Our software is available as an R package at https://github.com/YunyiShen/CAR-LASSO.

| [1] |
N. Fierer, C. L. Lauber, K. S. Ramirez, J. Zaneveld, M. A. Bradford, R. Knight, Comparative metagenomic, phylogenetic and physiological analyses of soil microbial communities across nitrogen gradients, ISME J., 6 (2012), 1007–1017. https://doi.org/10.1038/ismej.2011.159 doi: 10.1038/ismej.2011.159

|
| [2] |
T. Whitman, R. Neurath, A. Perera, I. Chu-Jacoby, D. Ning, J. Zhou, et al., Microbial community assembly differs across minerals in a rhizosphere microcosm, Environ. Microbiol., 20 (2018), 4444–4460. https://doi.org/10.1111/1462-2920.14366 doi: 10.1111/1462-2920.14366
|
| [3] |
A. M. Cates, M. J. Braus, T. L. Whitman, R. D. Jackson, Separate drivers for microbial carbon mineralization and physical protection of carbon, Soil Biol. Biochem., 133 (2019), 72–82. https://doi.org/10.1016/j.soilbio.2019.02.014 doi: 10.1016/j.soilbio.2019.02.014
|
| [4] |
C. Kranz, T. Whitman, Short communication: Surface charring from prescribed burning has minimal effects on soil bacterial community composition two weeks post-fire in jack pine barrens, Appl. Soil Ecol., 144 (2019), 134–138. https://doi.org/10.1016/j.apsoil.2019.07.004 doi: 10.1016/j.apsoil.2019.07.004
|
| [5] |
T. Whitman, E. Whitman, J. Woolet, M. D. Flannigan, D. K. Thompson, M. Parisien, Soil bacterial and fungal response to wildfires in the canadian boreal forest across a burn severity gradient, Soil Biol. Biochem., 138 (2019), 107571. https://doi.org/10.1016/j.soilbio.2019.107571 doi: 10.1016/j.soilbio.2019.107571
|
| [6] |
C. Allsup, R. Lankau, Migration of soil microbes may promote tree seedling tolerance to drying conditions, Ecology, 100 (2019), e02729. https://doi.org/10.1002/ecy.2729 doi: 10.1002/ecy.2729
|
| [7] | R. A. Rioux, C. M. Stephens, J. P. Kerns, Factors affecting pathogenicity of the turfgrass dollar spot pathogen in natural and model hosts, preprint, bioRxiv. https://doi.org/10.1101/630582 |
| [8] |
P. J. Turnbaugh, R. E. Ley, M. Hamady, C. M. Fraser-Liggett, R. Knight, J. I. Gordon, The human microbiome project, Nature, 449 (2007), 804–810. https://doi.org/10.1038/nature06244 doi: 10.1038/nature06244
|
| [9] |
M. Dave, P. D. Higgins, S. Middha, K. P. Rioux, The human gut microbiome: Current knowledge, challenges, and future directions, Transl. Res., 160 (2012), 246–257. https://doi.org/10.1016/j.trsl.2012.05.003 doi: 10.1016/j.trsl.2012.05.003
|
| [10] |
M. Layeghifard, D. M. Hwang, D. S. Guttman, Disentangling interactions in the microbiome: A network perspective, Trends Microbiol., 25 (2017), 217–228. https://doi.org/10.1016/j.tim.2016.11.008 doi: 10.1016/j.tim.2016.11.008
|
| [11] |
J. Friedman, T. Hastie, R. Tibshirani, Sparse inverse covariance estimation with the graphical lasso, Biostatistics, 9 (2008), 432–441. https://doi.org/10.1093/biostatistics/kxm045 doi: 10.1093/biostatistics/kxm045
|
| [12] |
H. Wang, Bayesian graphical lasso models and eficient posterior computation, Bayesian Anal., 7 (2012), 867–886. https://doi.org/10.1214/12-BA729 doi: 10.1214/12-BA729
|
| [13] |
C. Lo, R. Marculescu, Mplasso: Inferring microbial association networks using prior microbial knowledge, PLoS Comput. Biol., 13 (2017), e1005915. https://doi.org/10.1371/journal.pcbi.1005915 doi: 10.1371/journal.pcbi.1005915
|
| [14] |
S. L. Lauritzen, N. Wermuth, Graphical models for associations between variables, some of which are qualitative and some quantitative, Ann. Statist., 17 (1989), 31–57. https://doi.org/10.1214/aos/1176347003 doi: 10.1214/aos/1176347003
|
| [15] |
S. L. Lauritzen, T. S. Richardson, Chain graph models and their causal interpretations, J. R. Stat. Soc. Ser. B Stat. Methodol., 64 (2002), 321–348. https://doi.org/10.1111/1467-9868.00340 doi: 10.1111/1467-9868.00340
|
| [16] |
S. A. Andersson, D. Madigan, M. D. Perlman, Alternative markov properties for chain graphs, Scand. J. Stat., 28 (2001), 33–85. https://doi.org/10.1111/1467-9469.00224 doi: 10.1111/1467-9469.00224
|
| [17] | M. Frydenberg, The chain graph markov property, Scand. J. Stat., 17 (1990), 333–353. |
| [18] |
M. Chen, Z. Ren, H. Zhao, H. Zhou, Asymptotically normal and efficient estimation of covariate-adjusted gaussian graphical model, J. Am. Stat. Assoc., 111 (2016), 394–406. https://doi.org/10.1080/01621459.2015.1010039 doi: 10.1080/01621459.2015.1010039
|
| [19] | J. Zhang, Y. Li, High-dimensional gaussian graphical regression models with covariates, J. Am. Stat. Assoc., (2022), 2088–2100. https://doi.org/10.1080/01621459.2022.2034632 |
| [20] |
C. Leng, M. N. Tran, D. Nott, Bayesian adaptive Lasso, Ann. Inst. Stat. Math., 66 (2014), 221–244. https://doi.org/10.1007/s10463-013-0429-6 doi: 10.1007/s10463-013-0429-6
|
| [21] |
J. Fan, Y. Feng, Y. Wu, Network exploration via the adaptive lasso and scad penalties, Ann. Appl. Stat., 3 (2009), 521–541. https://doi.org/10.1214/08-AOAS215 doi: 10.1214/08-AOAS215
|
| [22] |
S. Xie, D. Zeng, Y. Wang, Integrative network learning for multimodality biomarker data, Ann. Appl. Stat., 15 (2021), 64–87. https://doi.org/10.1214/20-AOAS1382 doi: 10.1214/20-AOAS1382
|
| [23] |
M. J. Claesson, I. B. Jeffery, S. Conde, S. E. Power, E. M. O'connor, S. Cusack, et al., Gut microbiota composition correlates with diet and health in the elderly, Nature, 488 (2012), 178–184. https://doi.org/10.1038/nature11319 doi: 10.1038/nature11319
|
| [24] | P. W. O'Toole, Gut microbiota in the irish elderly and its links to health and diet (mgp154), 2008. Available: https://www.mg-rast.org/mgmain.html?mgpage = project & project = mgp154. |
| [25] |
F. G. Blanchet, K. Cazelles, D. Gravel, Co-occurrence is not evidence of ecological interactions, Ecol. Lett., 23 (2020), 1050–1063. https://doi.org/10.1111/ele.13525 doi: 10.1111/ele.13525
|
| [26] |
F. Meyer, D. Paarmann, M. D'Souza, R. Olson, E. M. Glass, M. Kubal, et al., The metagenomics rast server–A public resource for the automatic phylogenetic and functional analysis of metagenomes, BMC Bioinf., 9 (2008), 386. https://doi.org/10.1186/1471-2105-9-386 doi: 10.1186/1471-2105-9-386
|
| [27] |
P. Bonacich, P. Lloyd, Eigenvector-like measures of centrality for asymmetric relations, Soc. Networks, 23 (2001), 191–201. https://doi.org/10.1016/S0378-8733(01)00038-7 doi: 10.1016/S0378-8733(01)00038-7
|
| [28] | K. Hofmockel, Hofmockel soil aggregate cob kbase (mgp2592), 2012. Available from: https://www.mg-rast.org/mgmain.html?mgpage = project & project = mgp2592. |
| [29] |
E. M. Bach, R. J. Williams, S. K.Hargreaves, F. Yang, K. S. Hofmockel, Greatest soil microbial diversity found in micro-habitats, Soil Biol. Biochem., 118 (2018), 217–226. https://doi.org/10.1016/j.soilbio.2017.12.018 doi: 10.1016/j.soilbio.2017.12.018
|
| [30] | J. M. Blander, R. S. Longman, I. D. Iliev, G. F. Sonnenberg, D. Artis, Regulation of inflammation by microbiota interactions with the host. Nat. Immunol., 18 (2017), 851–860. https://doi.org/10.1038/ni.3780 |
| [31] |
N. Shoemaker, H. Vlamakis, K. Hayes, A. Salyers, Evidence for extensive resistance gene transfer amongbacteroides spp, and among bacteroides and other genera in the human colon, Appl. Environ. Microbiol., 67 (2001), 561–568. https://doi.org/10.1128/AEM.67.2.561-568.2001 doi: 10.1128/AEM.67.2.561-568.2001
|
| [32] |
M. Tourna, M. Stieglmeier, A. Spang, M. Könneke, A. Schintlmeister, T. Urich, et al., Nitrososphaera viennensis, an ammonia oxidizing archaeon from soil, Proc. Natl. Acad. Sci., 108 (2011), 8420–8425. https://doi.org/10.1073/pnas.1013488108 doi: 10.1073/pnas.1013488108
|
| [33] |
D. Lambert, Zero-inflated poisson regression, with an application to defects in manufacturing, Technometrics, 34 (1992), 1–14. https://doi.org/10.2307/1269547 doi: 10.2307/1269547
|
| [34] |
Y. Shen, C. Solís-Lemus, The effect of the prior and the experimental design on the inference of the precision matrix in gaussian chain graph models, J. Agric. Biol. Environ. Stat., 30 (2025), 800–869. https://doi.org/10.1007/s13253-024-00621-1 doi: 10.1007/s13253-024-00621-1
|
| [35] | L. Malagò, G. Pistone, Information geometry of the gaussian distribution in view of stochastic optimization, in Proceedings of the 2015 ACM Conference on Foundations of Genetic Algorithms XIII, (2015), 150–162. https://doi.org/10.1145/2725494.2725510 |
| [36] | K. Chaloner, I. Verdinelli, Bayesian experimental design: A review, Stat. Sci., 10 (1995), 273–304. |
| [37] | R Core Team, R: A language and environment for statistical computing, 2020. Available from: https://cran.rstudio.com/manuals.html. |
| [38] | T. Park, G. Casella, The Bayesian lasso, J. Am. Stat. Assoc., 103 (2008), 681–686. https://doi.org/10.1198/016214508000000337 |
| [39] |
D. F. Andrews, C. L. Mallows, Scale mixtures of normal distributions, J. R. Stat. Soc Series B, 36 (1974), 99–102. https://doi.org/10.1111/j.2517-6161.1974.tb00989.x doi: 10.1111/j.2517-6161.1974.tb00989.x
|
| [40] |
C. M. Carvalho, N. G. Polson, J. G. Scott, The horseshoe estimator for sparse signals, Biometrika, 97 (2010), 465–480. https://doi.org/10.1093/biomet/asq017 doi: 10.1093/biomet/asq017
|
| [41] |
B. Jones, C. Carvalho, A. Dobra, C. Hans, C. Carter, M. West, Experiments in stochastic computation for high-dimensional graphical models, Stat. Sci., 20 (2005), 388–400. https://doi.org/10.1214/088342305000000304 doi: 10.1214/088342305000000304
|
| [42] |
J. Aitchison, C. H. Ho, The multivariate Poisson-log normal distribution, Biometrika, 76 (1989), 643–653. https://doi.org/10.1093/biomet/76.4.643 doi: 10.1093/biomet/76.4.643
|
| [43] |
W. R. Gilks, P. Wild, Adaptive rejection sampling for gibbs sampling, J. R. Stat. Soc. Ser. C, 41 (1992), 337–348. https://doi.org/10.2307/2347565 doi: 10.2307/2347565
|
| [44] |
F. Xia, J. Chen, W. K. Fung, H. Li, A logistic normal multinomial regression model for microbiome compositional data analysis, Biometrics, 69 (2013), 1053–1063. https://doi.org/10.1111/biom.12079 doi: 10.1111/biom.12079
|
| [45] |
W. Hörmann, J. Leydold, Generating generalized inverse gaussian random variates, Stat. Comput., 24 (2014), 547–557. https://doi.org/10.1007/s11222-013-9387-3 doi: 10.1007/s11222-013-9387-3
|
| [46] | B. Jorgensen, Statistical Properties of the Generalized Inverse Gaussian Distribution, Springer, 1982. |
Figures(26)

Yunyi Shen, Claudia Solís-Lemus. Bayesian chain graph models to characterize microbe-environment dynamics[J]. Mathematical Biosciences and Engineering, 2026, 23(2): 499-546. doi: 10.3934/mbe.2026020


 DownLoad: