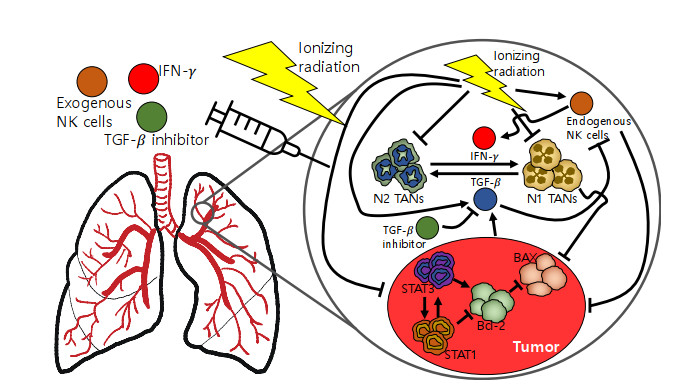
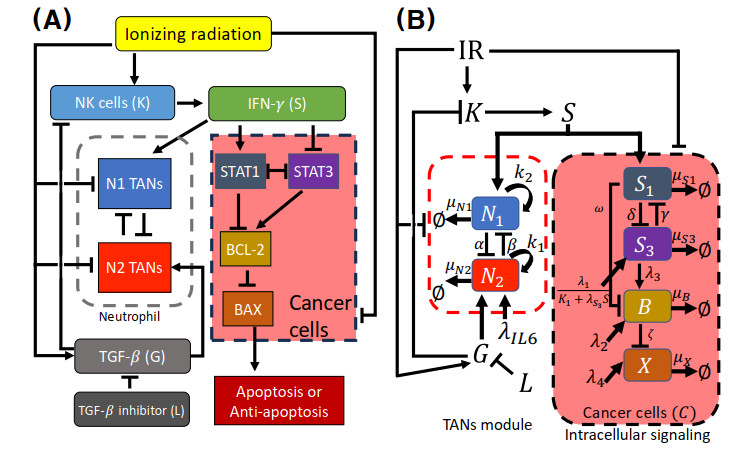
Neutrophils play a crucial role in the innate immune response as a first line of defense in many diseases, including cancer. Tumor-associated neutrophils (TANs) can either promote or inhibit tumor growth in various steps of cancer progression via mutual interactions with cancer cells in a complex tumor microenvironment (TME). In this study, we developed and analyzed mathematical models to investigate the role of natural killer cells (NK cells) and the dynamic transition between N1 and N2 TAN phenotypes in killing cancer cells through key signaling networks and how adjuvant therapy with radiation can be used in combination to increase anti-tumor efficacy. We examined the complex immune-tumor dynamics among N1/N2 TANs, NK cells, and tumor cells, communicating through key extracellular mediators (Transforming growth factor (TGF-$ \beta $), Interferon gamma (IFN-$ \gamma $)) and intracellular regulation in the apoptosis signaling network. We developed several tumor prevention strategies to eradicate tumors, including combination (IFN-$ \gamma $, exogenous NK, TGF-$ \beta $ inhibitor) therapy and optimally-controlled ionizing radiation in a complex TME. Using this model, we investigated the fundamental mechanism of radiation-induced changes in the TME and the impact of internal and external immune composition on the tumor cell fate and their response to different treatment schedules.
Citation: Donggu Lee, Sunju Oh, Sean Lawler, Yangjin Kim. Bistable dynamics of TAN-NK cells in tumor growth and control of radiotherapy-induced neutropenia in lung cancer treatment[J]. Mathematical Biosciences and Engineering, 2025, 22(4): 744-809. doi: 10.3934/mbe.2025028
Neutrophils play a crucial role in the innate immune response as a first line of defense in many diseases, including cancer. Tumor-associated neutrophils (TANs) can either promote or inhibit tumor growth in various steps of cancer progression via mutual interactions with cancer cells in a complex tumor microenvironment (TME). In this study, we developed and analyzed mathematical models to investigate the role of natural killer cells (NK cells) and the dynamic transition between N1 and N2 TAN phenotypes in killing cancer cells through key signaling networks and how adjuvant therapy with radiation can be used in combination to increase anti-tumor efficacy. We examined the complex immune-tumor dynamics among N1/N2 TANs, NK cells, and tumor cells, communicating through key extracellular mediators (Transforming growth factor (TGF-$ \beta $), Interferon gamma (IFN-$ \gamma $)) and intracellular regulation in the apoptosis signaling network. We developed several tumor prevention strategies to eradicate tumors, including combination (IFN-$ \gamma $, exogenous NK, TGF-$ \beta $ inhibitor) therapy and optimally-controlled ionizing radiation in a complex TME. Using this model, we investigated the fundamental mechanism of radiation-induced changes in the TME and the impact of internal and external immune composition on the tumor cell fate and their response to different treatment schedules.

| [1] |
H. Sung, J. Ferlay, R. Siegel, M. Laversanne, I. Soerjomataram, A. Jemal, et al., Global cancer statistics 2020: GLOBOCAN estimates of incidence and mortality worldwide for 36 cancers in 185 countries, CA Cancer J. Clin., 71 (2021), 209–249. https://doi.org/10.3322/caac.21660 doi: 10.3322/caac.21660

|
| [2] |
J. Molina, P. Yang, S. Cassivi, S. Schild, A. Adjei, Non-small cell lung cancer: epidemiology, risk factors, treatment, and survivorship, Mayo Clin. Proc., 83 (2008), 584–594. https://doi.org/10.4065/83.5.584 doi: 10.4065/83.5.584
|
| [3] |
N. Altorki, G. Markowitz, D. Gao, J. Port, A. Saxena, B. Stiles, et al., The lung microenvironment: an important regulator of tumour growth and metastasis, Nat. Rev. Cancer, 19 (2019), 9–31. https://doi.org/10.1038/s41568-018-0081-9 doi: 10.1038/s41568-018-0081-9
|
| [4] |
X. Yan, S. Jiao, G. Zhang, Y. Guan, J. Wang, Tumor-associated immune factors are associated with recurrence and metastasis in non-small cell lung cancer, Cancer Gene Ther., 24 (2017), 57–63. https://doi.org/10.1038/cgt.2016.40 doi: 10.1038/cgt.2016.40
|
| [5] |
D. Lambrechts, E. Wauters, B. Boeckx, S. Aibar, D. Nittner, O. Burton, et al., Phenotype molding of stromal cells in the lung tumor microenvironment, Nat. Med., 24 (2018), 1277–1289. https://doi.org/10.1038/s41591-018-0096-5 doi: 10.1038/s41591-018-0096-5
|
| [6] |
A. Mantovani, S. Sozzani, M. Locati, P. Allavena, A. Sica, Macrophage polarization: tumor-associated macrophages as a paradigm for polarized M2 mononuclear phagocytes, Trends Immunol., 23 (2002), 549–555. https://doi.org/10.1016/S1471-4906(02)02302-5 doi: 10.1016/S1471-4906(02)02302-5
|
| [7] |
A. Kilic, R. Landreneau, J. Luketich, A. Pennathur, M. Schuchert, Density of tumor-infiltrating lymphocytes correlates with disease recurrence and survival in patients with large non-small-cell lung cancer tumors, J. Surg. Res., 167 (2011), 207–210. https://doi.org/10.1016/j.jss.2009.08.029 doi: 10.1016/j.jss.2009.08.029
|
| [8] |
Y. Kim, H. Jeon, H. Othmer, The role of the tumor microenvironment in glioblastoma: A mathematical model, IEEE Trans. Biomed. Eng., 64 (2017), 519–527. https://doi.org/10.1109/TBME.2016.2637828 doi: 10.1109/TBME.2016.2637828
|
| [9] |
A. Yuan, Y. Hsiao, H. Chen, H. Chen, C. Ho, Y. Chen, et al., Opposite effects of M1 and M2 macrophage subtypes on lung cancer progression, Sci. Rep., 5 (2015), 14273. https://doi.org/10.1038/srep14273 doi: 10.1038/srep14273
|
| [10] |
M. Shaul, L. Levy, J. Sun, I. Mishalian, S. Singhal, V. Kapoor, et al., Tumor-associated neutrophils display a distinct N1 profile following TGFbeta modulation: A transcriptomics analysis of pro- vs. antitumor TANs, Oncoimmunology, 5 (2016), e1232221. https://doi.org/10.1080/2162402X.2016.1232221 doi: 10.1080/2162402X.2016.1232221
|
| [11] |
C. Hagerling, Z. Werb, Neutrophils: Critical components in experimental animal models of cancer, Semin. Immunol., 28 (2016), 197–204. https://doi.org/10.1016/j.smim.2016.02.003 doi: 10.1016/j.smim.2016.02.003
|
| [12] |
R. Sionov, Z. Fridlender, Z. Granot, The multifaceted roles neutrophils play in the tumor microenvironment, Cancer Microenviron., 8 (2015), 125–158. https://doi.org/10.1007/s12307-014-0147-5 doi: 10.1007/s12307-014-0147-5
|
| [13] |
A. Swierczak, K. Mouchemore, J. Hamilton, R. Anderson, Neutrophils: important contributors to tumor progression and metastasis, Cancer Metast. Rev., 34 (2015), 735–751. https://doi.org/10.1007/s10555-015-9594-9 doi: 10.1007/s10555-015-9594-9
|
| [14] |
W. Liang, N. Ferrara, The complex role of neutrophils in tumor angiogenesis and metastasis, Cancer Immunol. Res., 4 (2016), 83–91. https://doi.org/10.1158/2326-6066.CIR-15-0313 doi: 10.1158/2326-6066.CIR-15-0313
|
| [15] |
Z. G. Fridlender, J. Sun, S. Kim, V. Kapoor, G. Cheng, L. Ling, et al., Polarization of tumor-associated neutrophil phenotype by TGF-beta: N1 versus N2 TAN, Cancer Cell, 16 (2009), 183–194, https://doi.org/10.1016/j.ccr.2009.06.017. doi: 10.1016/j.ccr.2009.06.017
|
| [16] | J. Foekens, C. Ries, M. Look, C. Gippner-Steppert, J. Klijn, M. Jochum, The prognostic value of polymorphonuclear leukocyte elastase in patients with primary breast cancer, Cancer Res., 63 (2003), 337–441. |
| [17] | A. Bellocq, M. Antoine, A. Flahault, C. Philippe, B. Crestani, J. Bernaudin, et al., Neutrophil alveolitis in bronchioloalveolar carcinoma: induction by tumor-derived interleukin-8 and relation to clinical outcome, Am. J. Pathol., 152 (1998), 83–92. |
| [18] |
J. Atzpodien, M. Reitz, Peripheral blood neutrophils as independent immunologic predictor of response and long-term survival upon immunotherapy in metastatic renal-cell carcinom, Cancer Biother. Radiopharm., 23 (2008), 129–134. https://doi.org/10.1089/cbr.2007.0429 doi: 10.1089/cbr.2007.0429
|
| [19] |
H. Schmidt, L. Bastholt, P. Geertsen, I. Christensen, S. Larsen, J. Gehl, et al., Elevated neutrophil and monocyte counts in peripheral blood are associated with poor survival in patients with metastatic melanoma: a prognostic model, Br. J. Cancer, 93 (2005), 273–278. https://doi.org/10.1038/sj.bjc.6602702 doi: 10.1038/sj.bjc.6602702
|
| [20] | A. J. Templeton, M. G. McNamara, B. Šeruga, F. Vera-Badillo, P. Aneja, A. Ocaña, et al., Prognostic role of neutrophil-to-lymphocyte ratio in solid tumors: a systematic review and meta-analysis, J. Natl. Cancer Inst., 106 (2014), dju124. |
| [21] |
H. Maymani, K. Hess, R. Groisberg, D. Hong, A. Naing, S. Piha-Paul, et al., Predicting outcomes in patients with advanced non-small cell lung cancer enrolled in early phaseimmunotherapy trials, Lung Cancer, 120 (2018), 137–141. https://doi.org/10.1016/j.lungcan.2018.03.020 doi: 10.1016/j.lungcan.2018.03.020
|
| [22] |
J. Wang, Y. Jia, N. Wang, X. Zhang, B. Tan, G. Zhang, et al., The clinical significance of tumor-infiltrating neutrophils and neutrophil-to-CD8+ lymphocyte ratio in patients with resectable esophageal squamous cell carcinoma, J. Transl. Med., 12 (2014), 7. https://doi.org/10.1186/1479-5876-12-7 doi: 10.1186/1479-5876-12-7
|
| [23] |
R. Dolan, S. McSorley, J. Park, D. Watt, C. Roxburgh, P. Horgan, et al., The prognostic value of systemic inflammation in patients undergoing surgery for colon cancer: comparison of composite ratios and cumulative scores, Br. J. Cancer, 119 (2018), 40–51. https://doi.org/10.1038/s41416-018-0095-9 doi: 10.1038/s41416-018-0095-9
|
| [24] |
Y. Tao, L. Ding, G. Yang, J. Qiu, D. Wang, H. Wang, et al., Predictive impact of the inflammation-based indices in colorectal cancer patients with adjuvantchemotherapy, Cancer Med., 7 (2018), 2876–2886. https://doi.org/10.1002/cam4.1542 doi: 10.1002/cam4.1542
|
| [25] |
T. Tham, Y. Bardash, S. Herman, P. Costantino, Neutrophil-to-lymphocyte ratio as a prognostic indicator in head and neck cancer: A systematicreview and meta-analysis, Head Neck, 40 (2018), 2546–2557. https://doi.org/10.1002/hed.25324 doi: 10.1002/hed.25324
|
| [26] |
Z. Huang, Y. Liu, C. Yang, X. Li, C. Pan, J. Rao, et al., Combined neutrophil/platelet/lymphocyte/differentiation score predicts chemosensitivity in advanced gastric cancer, BMC Cancer, 18 (2018), 515. https://doi.org/10.1186/s12885-018-4414-6 doi: 10.1186/s12885-018-4414-6
|
| [27] | D. Galun, A. Bogdanovic, J. D. Kovac, P. Bulajic, Z. Loncar, M. Zuvela, Preoperative neutrophil-to-lymphocyte ratio as a prognostic predictor after curative-intent surgeryfor hepatocellular carcinoma: experience from a developing country, Cancer Manage. Res., 10 (2018), 977–988. |
| [28] | J. Kaiser, H. Li, S. North, R. Leibowitz-Amit, J. Seah, N. Morshed, et al., The prognostic role of the change in neutrophil-to-lymphocyte ratio during neoadjuvantchemotherapy in patients with muscle-invasive bladder cancer: A retrospective, multi-institutional study, Bladder Cancer, 4 (2018), 185–194. |
| [29] |
M. Zhu, M. Feng, F. He, B. Han, K. Ma, X. Zeng, et al., Pretreatment neutrophil-lymphocyte and platelet-lymphocyte ratio predict clinical outcome and prognosis for cervical cancer, Clin. Chim. Acta, 483 (2018), 296–302. https://doi.org/10.1016/j.cca.2018.05.025 doi: 10.1016/j.cca.2018.05.025
|
| [30] | P. Xue, M. Kanai, Y. Mori, T. Nishimura, N. Uza, Y. Kodama, et al., Neutrophil-to-lymphocyte ratio for predicting palliative chemotherapy outcomes in advancedpancreatic cancer patients, Cancer Med., 3 (2014), 406–415. |
| [31] |
W. Park, G. Lopes, Perspectives: Neutrophil-to-lymphocyte ratio as a potential biomarker in immune checkpoint inhibitor for non-small-cell lung cancer, Clin. Lung Cancer, 20 (2019), 143–147. https://doi.org/10.1016/j.cllc.2018.12.003 doi: 10.1016/j.cllc.2018.12.003
|
| [32] |
T. Tuting, K. de Visser, How neutrophils promote metastasis, Science, 352 (2016), 145–146. https://doi.org/10.1126/science.aaf7300 doi: 10.1126/science.aaf7300
|
| [33] |
E. Jalilian, F. Abolhasani-Zadeh, A. Afgar, A. Samoudi, H. Zeinalynezhad, L. Langroudi, Neutralizing tumor-related inflammation and reprogramming of cancer-associated fibroblasts by curcumin in breast cancer therapy, Sci. Rep., 13 (2023), 20770. https://doi.org/10.1038/s41598-023-48073-w doi: 10.1038/s41598-023-48073-w
|
| [34] |
G. Evan, E. Harrington, A. Fanidi, H. Land, B. Amati, M. Bennett, Integrated control of cell proliferation and cell death by the c-myc oncogene, Philos. Trans. R. Soc. Lond. B Biol. Sci., 345 (1994), 269–275. https://doi.org/10.1098/rstb.1994.0105 doi: 10.1098/rstb.1994.0105
|
| [35] |
T. Libermann, L. Zerbini, Targeting transcription factors for cancer gene therapy, Curr. Gene Ther., 6 (2006), 17–33. https://doi.org/10.2174/156652306775515501 doi: 10.2174/156652306775515501
|
| [36] |
M. Marin, A. Karis, P. Visser, F. Grosveld, S. Philipsen, Transcription factor Sp1 is essential for early embryonic development but dispensable for cell growth and differentiation, Cell, 89 (1997), 619–628. https://doi.org/10.1016/S0092-8674(00)80243-3 doi: 10.1016/S0092-8674(00)80243-3
|
| [37] |
S. Akira, Functional roles of stat family proteins: lessons from knockout mice, Stem Cells, 17 (1999), 138–146. https://doi.org/10.1002/stem.170138 doi: 10.1002/stem.170138
|
| [38] |
H. Yu, D. Pardoll, R. Jove, STATs in cancer inflammation and immunity: a leading role for STAT3, Nat. Rev. Cancer, 9 (2009), 798–809. https://doi.org/10.1038/nrc2734 doi: 10.1038/nrc2734
|
| [39] |
J. Chen, J. Zhao, L. Chen, N. Dong, Z. Ying, Z. Cai, et al., STAT1 modification improves therapeutic effects of interferons on lung cancer cells, J. Transl. Med., 13 (2015), 293. https://doi.org/10.1186/s12967-015-0656-0 doi: 10.1186/s12967-015-0656-0
|
| [40] |
J. Yang, Y. Liu, X. Mai, S. Lu, L. Jin, X. Tai, STAT1-induced upregulation of LINC00467 promotes the proliferation migration of lung adenocarcinoma cells by epigenetically silencing DKK1 to activate Wnt/$\beta$-catenin signaling pathway, Biochem. Biophys. Res. Commun., 514 (2019), 118–126. https://doi.org/10.1016/j.bbrc.2019.04.107 doi: 10.1016/j.bbrc.2019.04.107
|
| [41] | C. L. Yang, Y. Y. Liu, Y. G. Ma, Y. X. Xue, D. G. Liu, Y. Ren, et al., Curcumin blocks small cell lung cancer cells migration, invasion, angiogenesis, cell cycle and neoplasia through janus kinase-STAT3 signalling pathway, PLoS One, 7 (2012), e37960. |
| [42] |
F. Pezzella, H. Turley, I. Kuzu, M. Tungekar, M. Dunnill, C. Pierce, et al., bcl-2 protein in non-small-cell lung carcinoma, N. Engl. J. Med., 329 (1993), 690–694. https://doi.org/10.1056/NEJM199309023291003 doi: 10.1056/NEJM199309023291003
|
| [43] |
J. Pawlowski, A. Kraft, Bax-induced apoptotic cell death, Proc. Natl. Acad. Sci. U.S.A., 97 (2000), 529–531. https://doi.org/10.1073/pnas.97.2.529 doi: 10.1073/pnas.97.2.529
|
| [44] | I. Porebska, E. Wyrodek, M. Kosacka, J. Adamiak, R. Jankowska, A. Harlozinska-Szmyrka, Apoptotic markers p53, Bcl-2 and Bax in primary lung cancer, In Vivo, 20 (2006), 599–604. |
| [45] |
M. Nielsen, C. Kaestel, K. Eriksen, A. Woetmann, T. Stokkedal, K. Kaltoft, et al., Inhibition of constitutively activated Stat3 correlates with altered Bcl-2/Bax expression and induction of apoptosis in mycosis fungoides tumor cells, Leukemia, 13 (1999), 735–738. https://doi.org/10.1038/sj.leu.2401415 doi: 10.1038/sj.leu.2401415
|
| [46] | J. Massague, TGFbeta in cancer, Cell, 134 (2008), 215–230. |
| [47] |
C. David, J. Massague, Contextual determinants of TGF$\beta$ action in development, immunity and cancer, Nat. Rev. Mol. Cell Biol., 19 (2018), 419–435. https://doi.org/10.1038/s41580-018-0007-0 doi: 10.1038/s41580-018-0007-0
|
| [48] |
R. Akhurst, A. Hata, Targeting the TGF$\beta$ signalling pathway in disease, Nat. Rev. Drug Discov., 11 (2012), 790–811. https://doi.org/10.1038/nrd3810 doi: 10.1038/nrd3810
|
| [49] |
R. Akhurst, R. Derynck, TGF-$\beta$ signaling in cancer–a double-edged sword, Trends Cell Biol., 11 (2001), S44–S51. https://doi.org/10.1016/S0962-8924(01)82259-5 doi: 10.1016/S0962-8924(01)82259-5
|
| [50] |
M. Li, R. Flavell, TGF-$\beta$: a master of all T cell trades, Cell, 134 (2008), 392–404. https://doi.org/10.1016/j.cell.2008.07.025 doi: 10.1016/j.cell.2008.07.025
|
| [51] |
C. Bellomo, L. Caja, A. Moustakas, Transforming growth factor $\beta$ as regulator of cancer stemness and metastasis, Br. J. Cancer, 115 (2016), 761–769. https://doi.org/10.1038/bjc.2016.255 doi: 10.1038/bjc.2016.255
|
| [52] |
O. Aktas, A. Ozturk, B. Erman, S. Erus, S. Tanju, S. Dilege, Role of natural killer cells in lung cancer, J. Cancer Res. Clin. Oncol., 144 (2018), 997–1003. https://doi.org/10.1007/s00432-018-2635-3 doi: 10.1007/s00432-018-2635-3
|
| [53] |
R. Castriconi, C. Cantoni, M. Chiesa, M. Vitale, E. Marcenaro, R. Conte, et al., Transforming growth factor $\beta$1 inhibits expression of NKp30 and NKG2D receptors: consequences for the NK-mediated killing of dendritic cells, Proc. Natl. Acad. Sci. U.S.A., 100 (2003), 4120–4125. https://doi.org/10.1073/pnas.0730640100 doi: 10.1073/pnas.0730640100
|
| [54] |
M. Shaul, Z. Fridlender, Cancer related circulating and tumor-associated neutrophils - subtypes, sources and function, FEBS J., 285 (2018), 4316–4342. https://doi.org/10.1111/febs.14524 doi: 10.1111/febs.14524
|
| [55] |
S. Saha, S. Biswas, Tumor-associated neutrophils show phenotypic and functional divergence in human lung cancer, Cancer Cell, 30 (2016), 11–13. https://doi.org/10.1016/j.ccell.2016.06.016 doi: 10.1016/j.ccell.2016.06.016
|
| [56] |
L. Shen, J. Smith, Z. Shen, M. Eriksson, C. Sentman, C. Wira, Inhibition of human neutrophil degranulation by transforming growth factor-$\beta$1, Clin. Exp. Immunol., 149 (2007), 155–161. https://doi.org/10.1111/j.1365-2249.2007.03376.x doi: 10.1111/j.1365-2249.2007.03376.x
|
| [57] |
L. Andzinski, N. Kasnitz, S. Stahnke, C. Wu, M. Gereke, M. von Kockritz-Blickwede, et al., Type Ⅰ IFNs induce anti-tumor polarization of tumor associated neutrophils in mice and human, Int. J. Cancer, 138 (2016), 1982–1993. https://doi.org/10.1002/ijc.29945 doi: 10.1002/ijc.29945
|
| [58] |
J. Jablonska, S. Leschner, K. Westphal, S. Lienenklaus, S. Weiss, Neutrophils responsive to endogenous IFN-$\beta$ regulate tumor angiogenesis and growth in a mouse tumor model, J. Clin. Invest., 120 (2010), 1151–1164. https://doi.org/10.1172/JCI37223 doi: 10.1172/JCI37223
|
| [59] |
F. Wang, S. Zhang, R. Jeon, I. Vuckovic, X. Jiang, A. Lerman, et al., Interferon gamma induces reversible metabolic reprogramming of M1 macrophages to sustain cell viability and pro-inflammatory activity, EBioMedicine, 30 (2018), 303–316. https://doi.org/10.1016/j.ebiom.2018.02.009 doi: 10.1016/j.ebiom.2018.02.009
|
| [60] |
J. Catani, R. Medrano, A. Hunger, P. D. Valle, S. Adjemian, D. Zanatta, et al., Intratumoral immunization by p19Arf and interferon-$\beta$ gene transfer in a heterotopic mouse model of lung carcinoma, Transl. Oncol., 9 (2016), 565–574. https://doi.org/10.1016/j.tranon.2016.09.011 doi: 10.1016/j.tranon.2016.09.011
|
| [61] |
J. Swann, Y. Hayakawa, N. Zerafa, K. Sheehan, B. Scott, R. Schreiber, et al., Type Ⅰ IFN contributes to NK cell homeostasis, activation, and antitumor function, J. Immunol., 178 (2007), 7540–7549. https://doi.org/10.4049/jimmunol.178.12.7540 doi: 10.4049/jimmunol.178.12.7540
|
| [62] |
Q. Lin, L. Rong, X. Jia, R. Li, B. Yu, J. Hu, et al., IFN-$\gamma$-dependent NK cell activation is essential to metastasis suppression by engineered salmonella, Nat. Commun., 12 (2021), 2537. https://doi.org/10.1038/s41467-021-22755-3 doi: 10.1038/s41467-021-22755-3
|
| [63] |
M. Masucci, M. Minopoli, M. Carriero, Tumor associated neutrophils. their role in tumorigenesis, metastasis, prognosis and therapy, Front. Oncol., 9 (2019), 1146. https://doi.org/10.3389/fonc.2019.01146 doi: 10.3389/fonc.2019.01146
|
| [64] |
Y. Gao, J. Yang, Y. Cai, S. Fu, N. Zhang, X. Fu, et al., IFN-$\gamma$-mediated inhibition of lung cancer correlates with PD‐L1 expression and is regulated by PI3K-AKT signaling, Int. J. Cancer, 143 (2018), 931–943. https://doi.org/10.1002/ijc.31357 doi: 10.1002/ijc.31357
|
| [65] |
D. Jorgovanovic, M. Song, L. Wang, Y. Zhang, Roles of IFN-$\gamma$ in tumor progression and regression: a review, Biomark Res., 8 (2020), 49. https://doi.org/10.1186/s40364-020-00228-x doi: 10.1186/s40364-020-00228-x
|
| [66] |
J. Cong, H. Wei, Natural killer cells in the lungs, Front. Immunol., 10 (2019), 1416. https://doi.org/10.3389/fimmu.2019.01416 doi: 10.3389/fimmu.2019.01416
|
| [67] |
M. Vitale, C. Cantoni, G. Pietra, M. Mingari, L. Moretta, Effect of tumor cells and tumor microenvironment on NK-cell function, Eur. J. Immunol., 44 (2014), 1582–1592. https://doi.org/10.1002/eji.201344272 doi: 10.1002/eji.201344272
|
| [68] |
D. Pardoll, The blockade of immune checkpoints in cancer immunotherapy, Nat. Rev. Cancer, 12 (2012), 252–264. https://doi.org/10.1038/nrc3239 doi: 10.1038/nrc3239
|
| [69] |
J. Gao, J. Ward, C. Pettaway, L. Shi, S. Subudhi, L. Vence, et al., Vista is an inhibitory immune checkpoint that is increased after ipilimumab therapy in patients with prostate cancer, Nat. Med., 23 (2017), 551–555. https://doi.org/10.1038/nm.4308 doi: 10.1038/nm.4308
|
| [70] |
R. Tallerico, C. Garofalo, E. Carbone, A new biological feature of natural killer cells: The recognition of solid tumor-derived cancer stem cells, Front. Immunol., 7 (2016), 179. https://doi.org/10.3389/fimmu.2016.00179 doi: 10.3389/fimmu.2016.00179
|
| [71] |
S. Viel, A. Marçais, F. Guimaraes, R. Loftus, J. Rabilloud, M. Grau, et al., TGF-$\beta$ inhibits the activation and functions of NK cells by repressing the mTOR pathway, Sci. Signal, 9 (2016), ra19. https://doi.org/10.1126/scisignal.aad1884 doi: 10.1126/scisignal.aad1884
|
| [72] |
F. Otegbeye, E. Ojo, S. Moreton, N. Mackowski, D. Lee, M. de Lima, et al., Inhibiting TGF-beta signaling preserves the function of highly activated, in vitro expanded natural killer cells in aml and colon cancer models, PLoS One, 13 (2018), e0191358. https://doi.org/10.1371/journal.pone.0191358 doi: 10.1371/journal.pone.0191358
|
| [73] |
R. Sun, J. Luo, D. Li, Y. Shu, C. Luo, S. Wang, et al., Neutrophils with protumor potential could efficiently suppress tumor growth after cytokine priming and in presence of normal NK cells, Oncotarget, 5 (2014), 12621–12634. https://doi.org/10.18632/oncotarget.2181 doi: 10.18632/oncotarget.2181
|
| [74] |
Y. Kim, J. Yoo, T. Lee, J. Liu, J. Yu, M. Caligiuri, et al., Complex role of NK cells in regulation of oncolytic virus-bortezomib therapy, Proc. Natl. Acad. Sci. U.S.A., 115 (2018), 4927–4932. https://doi.org/10.1073/pnas.1715295115 doi: 10.1073/pnas.1715295115
|
| [75] |
S. Lim, T. Kim, J. Lee, C. Sonn, K. Kim, J. Kim, et al., Ex vivo expansion of highly cytotoxic human NK cells by cocultivation with irradiated tumor cells for adoptive immunotherapy, Cancer Res., 73 (2013), 2598–2607. https://doi.org/10.1158/0008-5472.CAN-12-2893 doi: 10.1158/0008-5472.CAN-12-2893
|
| [76] |
A. Aspirin, A. de Los Reyes V, Y. Kim, Polytherapeutic strategies with oncolytic virus-bortezomib and adjuvant NK cells in cancer treatment, J. R. Soc. Interface, 18 (2021), 20200669. https://doi.org/10.1098/rsif.2020.0669 doi: 10.1098/rsif.2020.0669
|
| [77] |
J. Sia, R. Szmyd, E. Hau, H. Gee, Molecular mechanisms of radiation-induced cancer cell death: A primer, Front. Cell Dev. Biol., 8 (2020), 41. https://doi.org/10.3389/fcell.2020.00041 doi: 10.3389/fcell.2020.00041
|
| [78] |
A. Koushik, K. Harish, H. Avinash, Principles of radiation oncology: a beams eye view for a surgeon, Indian J. Surg. Oncol., 4 (2013), 255–262. https://doi.org/10.1007/s13193-013-0231-1 doi: 10.1007/s13193-013-0231-1
|
| [79] |
J. Chen, X. Liu, Z. Zeng, J. Li, Y. Luo, W. Sun, et al., Immunomodulation of NK cells by ionizing radiation, Front. Oncol., 10 (2020), 874. https://doi.org/10.3389/fonc.2020.00874 doi: 10.3389/fonc.2020.00874
|
| [80] |
S. Formenti, S. Demaria, Combining radiotherapy and cancer immunotherapy: a paradigm shift, J. Natl. Cancer Inst., 105 (2013), 256–265. https://doi.org/10.1093/jnci/djs629 doi: 10.1093/jnci/djs629
|
| [81] |
X. Lai, A. Friedman, Mathematical modeling of cancer treatment with radiation and PD-L1 inhibitor, Sci. China Math., 63 (2020), 465–484. https://doi.org/10.1007/s11425-019-1648-6 doi: 10.1007/s11425-019-1648-6
|
| [82] |
D. Lonergan, A. Mikulec, M. Hanasono, M. Kita, R. Koch, Growth factor profile of irradiated human dermal fibroblasts using a serum-free method, Plast Reconstr. Surg., 111 (2003), 1960–1968. https://doi.org/10.1097/01.PRS.0000055065.41599.75 doi: 10.1097/01.PRS.0000055065.41599.75
|
| [83] |
J. Santibanez, M. Quintanilla, C. Bernabeu, TGF-$\beta$/TGF-$\beta$ receptor system and its role in physiological and pathological conditions, Clin. Sci., 121 (2011), 233–251. https://doi.org/10.1042/CS20110086 doi: 10.1042/CS20110086
|
| [84] |
D. Powell, A. Huttenlocher, Neutrophils in the tumor microenvironment, Trends Immunol., 37 (2016), 41–52. https://doi.org/10.1016/j.it.2015.11.008 doi: 10.1016/j.it.2015.11.008
|
| [85] |
Y. Kim, D. Lee, J. Lee, S. Lee, S. Lawler, Role of tumor-associated neutrophils in regulation of tumor growth in lung cancer development: A mathematical model, PLoS One, 14 (2019), e0211041. https://doi.org/10.1371/journal.pone.0211041 doi: 10.1371/journal.pone.0211041
|
| [86] | E. Demidenko, Mixed Models: Theory and Applications with R, 2nd edition, Wiley Series, 2013. |
| [87] | V. Collins, R. Loeffler, H. Tivey, Observations on growth rates of human tumors, Am. J. Roentgenol. Radium. Ther. Nucl. Med., 76 (1956), 988–1000. |
| [88] |
A. Tsoularis, J. Wallace, Analysis of logistic growth models, Math. Biosci., 179 (2002), 21–55. https://doi.org/10.1016/S0025-5564(02)00096-2 doi: 10.1016/S0025-5564(02)00096-2
|
| [89] |
P. Charles, The gompertz curve as a growth curve, Proc. Natl. Acad. Sci. U.S.A., 18 (1932), 1–8. https://doi.org/10.1073/pnas.18.1.1 doi: 10.1073/pnas.18.1.1
|
| [90] |
H. Murphy, H. Jaafari, H. Dobrovolny, Differences in predictions of ode models of tumor growth: a cautionary example, BMC Cancer, 16 (2016), 163. https://doi.org/10.1186/s12885-016-2164-x doi: 10.1186/s12885-016-2164-x
|
| [91] |
Y. Kim, J. Wallace, F. Li, M. Ostrowski, A. Friedman, Transformed epithelial cells and fibroblasts/myofibroblasts interaction in breast tumor: a mathematical model and experiments, J. Math. Biol., 61 (2010), 401–421. https://doi.org/10.1007/s00285-009-0307-2 doi: 10.1007/s00285-009-0307-2
|
| [92] |
A. Stein, T. Demuth, D. Mobley, M. Berens, L. Sander, A mathematical model of glioblastoma tumor spheroid invasion in a three-dimensional in vitro experiment, Biophys. J., 92 (2007), 356–365. https://doi.org/10.1529/biophysj.106.093468 doi: 10.1529/biophysj.106.093468
|
| [93] |
H. Enderling, A. Anderson, M. Chaplain, A. Munro, J. Vaidya, Mathematical modelling of radiotherapy strategies for early breast cancer, J. Theor. Biol., 241 (2006), 158–71. https://doi.org/10.1016/j.jtbi.2005.11.015 doi: 10.1016/j.jtbi.2005.11.015
|
| [94] |
J. Weis, M. Miga, T. Yankeelov, Three-dimensional image-based mechanical modeling for predicting the response of breast cancer to neoadjuvant therapy, Comput. Methods Appl. Mech. Eng., 314 (2017), 494–512. https://doi.org/10.1016/j.cma.2016.08.024 doi: 10.1016/j.cma.2016.08.024
|
| [95] |
Y. Kim, J. Lee, C. Lee, S. Lawler, Role of senescent tumor cells in building a cytokine shield in the tumor microenvironment: mathematical modeling, J. Math. Biol., 86 (2022), 14. https://doi.org/10.1007/s00285-022-01850-z doi: 10.1007/s00285-022-01850-z
|
| [96] |
Y. Kim, D. Lee, S. Lawler, Collective invasion of glioma cells through OCT1 signalling and interaction with reactive astrocytes after surgery, Phil. Trans. R. Soc. B, 375 (2020), 20190390. https://doi.org/10.1098/rstb.2019.0390 doi: 10.1098/rstb.2019.0390
|
| [97] |
Y. Kim, J. Lee, D. Lee, H. Othmer, Synergistic effects of bortezomib-OV therapy and anti-invasive strategies in glioblastoma: a mathematical model, Cancers, 11 (2019), 215. https://doi.org/10.3390/cancers11020215 doi: 10.3390/cancers11020215
|
| [98] |
H. Enderling, M. Chaplain, A. Anderson, J. Vaidya, A mathematical model of breast cancer development, local treatment and recurrence, J. Theor. Biol., 246 (2007), 245–259. https://doi.org/10.1016/j.jtbi.2006.12.010 doi: 10.1016/j.jtbi.2006.12.010
|
| [99] |
D. Corwin, C. Holdsworth, R. Rockne, A. Trister, M. Mrugala, J. Rockhill, et al., Toward patient-specific, biologically optimized radiation therapy plans for the treatment of glioblastoma, PLoS One, 8 (2013), e79115. https://doi.org/10.1371/journal.pone.0079115 doi: 10.1371/journal.pone.0079115
|
| [100] |
Y. Kim, A. Friedman, Interaction of tumor with its microenvironment: A mathematical model, Bull. Math. Biol., 72 (2010), 1029–1068. https://doi.org/10.1007/s11538-009-9481-z doi: 10.1007/s11538-009-9481-z
|
| [101] | P. Maini, Modelling aspects of tumour metabolism, in Proceedings of the International Congress of Mathematicians 2010 (ICM 2010), (2011), 3091–3104. https://doi.org/10.1142/9789814324359_0181 |
| [102] |
Y. Kim, H. Lee, N. Dmitrieva, J. Kim, B. Kaur, A. Friedman, Choindroitinase ABC Ⅰ-mediated enhancement of oncolytic virus spread and anti-tumor efficacy: A mathematical model, PLoS One, 9 (2014), e102499. https://doi.org/10.1371/journal.pone.0102499 doi: 10.1371/journal.pone.0102499
|
| [103] |
K. Swanson, E. Alvord, J. Murray, Virtual resection of gliomas: Effect of extent of resection on recurrence, Math. Comput. Modell., 37 (2003), 1177–1190. https://doi.org/10.1016/S0895-7177(03)00129-8 doi: 10.1016/S0895-7177(03)00129-8
|
| [104] |
Y. Kim, S. Roh, S. Lawler, A. Friedman, miR451 and AMPK/MARK mutual antagonism in glioma cells migration and proliferation, PLoS One, 6 (2011), e28293. https://doi.org/10.1371/journal.pone.0028293 doi: 10.1371/journal.pone.0028293
|
| [105] |
K. Kotredes, A. Gamero, Interferons as inducers of apoptosis in malignant cells, J. Interferon Cytokine Res., 33 (2013), 162–170. https://doi.org/10.1089/jir.2012.0110 doi: 10.1089/jir.2012.0110
|
| [106] |
A. Groeger, V. Esposito, A. D. Luca, R. Cassandro, G. Tonini, V. Ambrogi, et al., Prognostic value of immunohistochemical expression of p53, bax, Bcl‐2 and Bcl‐xL in resected non‐small‐cell lung cancers, Histopathology, 44 (2004), 54–63. https://doi.org/10.1111/j.1365-2559.2004.01750.x doi: 10.1111/j.1365-2559.2004.01750.x
|
| [107] |
J. Lee, D. Lee, Y. Kim, Mathematical model of stat signalling pathways in cancer development and optimal control approaches, R. Soc. Open Sci., 9 (2021), 210594. https://doi.org/10.1098/rsos.210594 doi: 10.1098/rsos.210594
|
| [108] |
C. Huang, C. Chung, T. Hu, J. Chen, P. Liu, C. Chen, Recent progress in TGF-$\beta$ inhibitors for cancer therapy, Biomed. Pharmacother., 134 (2021), 111046. https://doi.org/10.1016/j.biopha.2020.111046 doi: 10.1016/j.biopha.2020.111046
|
| [109] | S. Herbertz, J. S. Sawyer, A. J. Stauber, I. Gueorguieva, K. E. Driscoll, S. T. Estrem, et al., Clinical development of galunisertib (LY2157299 monohydrate), a small molecule inhibitor of transforming growth factor-beta signaling pathway, Drug Des. Dev. Ther., 9 (2015), 4479–4499. |
| [110] |
R. Kelley, E. Gane, E. Assenat, J. Siebler, P. Galle, P. Merle, et al., A phase 2 study of galunisertib (TGF-$\beta$1 receptor type Ⅰ inhibitor) and sorafenib in patients with advanced hepatocellular carcinoma, Clin. Transl. Gastroenterol., 10 (2019), e00056. https://doi.org/10.14309/ctg.0000000000000056 doi: 10.14309/ctg.0000000000000056
|
| [111] |
N. Bjorkstrom, H. Ljunggren, J. Michaelsson, Emerging insights into natural killer cells in human peripheral tissues, Nat. Rev. Immunol., 16 (2016), 310–320. https://doi.org/10.1038/nri.2016.34 doi: 10.1038/nri.2016.34
|
| [112] |
J. Lee, K. Park, J. Ryu, H. Bae, A. Choi, H. Lee, et al., Natural killer cell activity for IFN-gamma production as a supportive diagnostic marker for gastric cancer, Oncotarget, 8 (2017), 70431–70440. https://doi.org/10.18632/oncotarget.19712 doi: 10.18632/oncotarget.19712
|
| [113] |
Y. Rocca, M. Roberti, E. Julia, M. Pampena, L. Bruno, S. Rivero, et al., Phenotypic and functional dysregulated blood NK cells in colorectal cancer patients can be activated by cetuximab plus IL-2 or IL-15, Front. Immunol., 7 (2016), 413. https://doi.org/10.3389/fimmu.2016.00413 doi: 10.3389/fimmu.2016.00413
|
| [114] |
M. Lodoen, L. Lanier, Natural killer cells as an initial defense against pathogens, Curr. Opin. Immunol., 18 (2006), 391–398. https://doi.org/10.1080/08913810608443667 doi: 10.1080/08913810608443667
|
| [115] |
J. Siren, T. Sareneva, J. Pirhonen, M. Strengell, V. Veckman, I. Julkunen, et al., Cytokine and contact-dependent activation of natural killer cells by influenza a or sendai virus-infected macrophages, J. Gen. Virol., 85 (2004), 2357–2364. https://doi.org/10.1099/vir.0.80105-0 doi: 10.1099/vir.0.80105-0
|
| [116] |
A. Iversen, P. Norris, C. Ware, C. Benedict, Human NK cells inhibit cytomegalovirus replication through a noncytolytic mechanism involving lymphotoxin-dependent induction of IFN-beta, J. Immunol., 175 (2005), 7568–7574. https://doi.org/10.4049/jimmunol.175.11.7568 doi: 10.4049/jimmunol.175.11.7568
|
| [117] |
M. Studeny, F. Marini, J. Dembinski, C. Zompetta, M. Cabreira-Hansen, B. Bekele, et al., Mesenchymal stem cells: potential precursors for tumor stroma and targeted-delivery vehicles for anticancer agents, J. Natl. Cancer Inst., 96 (2004), 1593–603. https://doi.org/10.1093/jnci/djh299 doi: 10.1093/jnci/djh299
|
| [118] |
M. Chiantore, S. Vannucchi, R. Accardi, M. Tommasino, Z. Percario, G. Vaccari, et al., Interferon-$\beta$ induces cellular senescence in cutaneous human papilloma virus-transformed human keratinocytes by affecting p53 transactivating activity, PLoS One, 7 (2012), e36909. https://doi.org/10.1371/journal.pone.0036909 doi: 10.1371/journal.pone.0036909
|
| [119] |
A. Takaoka, S. Hayakawa, H. Yanai, D. Stoiber, H. Negishi, H. Kikuchi, et al., Integration of interferon-$\alpha$/$\beta$ signalling to p53 responses in tumour suppression and antiviral defence, Nature, 424 (2003), 516–523. https://doi.org/10.1038/nature01850 doi: 10.1038/nature01850
|
| [120] |
F. Zhang, S. Sriram, Identification and characterization of the interferon-beta-mediated p53 signal pathway in human peripheral blood mononuclear cells, Immunology, 128 (2009), e905–e918. https://doi.org/10.1111/j.1365-2567.2009.03104.x doi: 10.1111/j.1365-2567.2009.03104.x
|
| [121] |
D. Ghosh, P. Parida, Interferon therapy in lung cancer: Current perspectives, Curr. Cancer Ther. Rev., 12 (2016), 237–245. https://doi.org/10.1016/j.explore.2016.04.001 doi: 10.1016/j.explore.2016.04.001
|
| [122] |
B. Liu, X. Zhu, L. Kong, M. Wang, C. Spanoudis, P. Chaturvedi, et al., Bifunctional TGF-$\beta$ trap/IL-15 protein complex elicits potent NK cell and CD8+ T cell immunity against solid tumors, Mol. Ther., 29 (2021), 2949–2962. https://doi.org/10.1109/TFUZZ.2020.3009755 doi: 10.1109/TFUZZ.2020.3009755
|
| [123] |
J. Marcoe, J. Lim, K. Schaubert, N. Fodil-Cornu, M. Matka, A. McCubbrey, et al., TGF-$\beta$ is responsible for NK cell immaturity during ontogeny and increased susceptibility to infection during mouse infancy, Nat. Immunol., 13 (2012), 843–850. https://doi.org/10.1038/ni.2388 doi: 10.1038/ni.2388
|
| [124] |
R. Rouce, H. Shaim, T. Sekine, G. Weber, B. Ballard, S. Ku, et al., The TGF-$\beta$/SMAD pathway is an important mechanism for NK cell immune evasion in childhood B-acute lymphoblastic leukemia, Leukemia, 30 (2016), 800–811. https://doi.org/10.1038/leu.2015.327 doi: 10.1038/leu.2015.327
|
| [125] |
S. Regis, A. Dondero, F. Caliendo, C. Bottino, R. Castriconi, NK cell function regulation by TGF-$\beta$-induced epigenetic mechanisms, Front. Immunol., 11 (2020), 311. https://doi.org/10.3389/fimmu.2020.00311 doi: 10.3389/fimmu.2020.00311
|
| [126] |
T. Laskowski, A. Biederstadt, K. Rezvani, Natural killer cells in antitumour adoptive cell immunotherapy, Nat. Rev. Cancer, 22 (2022), 557–575. https://doi.org/10.1038/s41568-022-00491-0 doi: 10.1038/s41568-022-00491-0
|
| [127] |
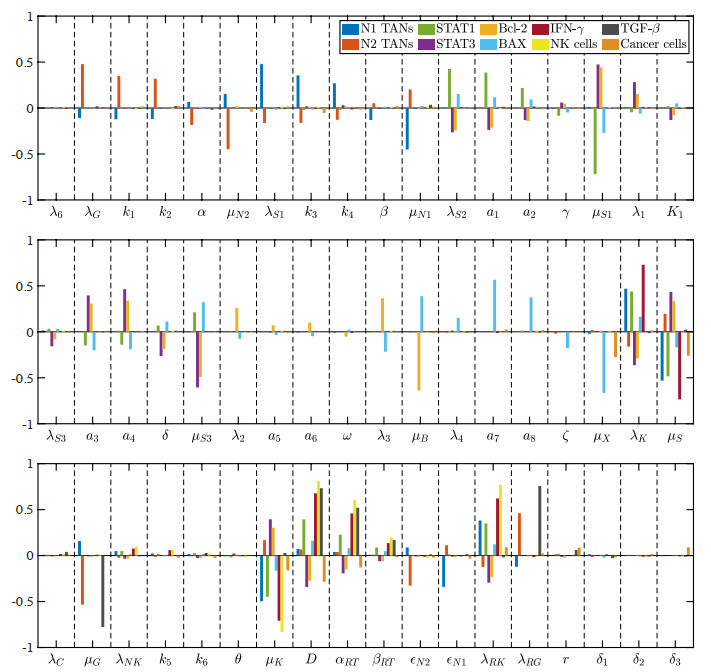
S. Marino, I. Hogue, C. Ray, D. Kirschner, A methodology for performing global uncertainty and sensitivity analysis in systems biology, J. Theor. Biol., 254 (2008), 178–196. https://doi.org/10.1016/j.jtbi.2008.04.011 doi: 10.1016/j.jtbi.2008.04.011
|
| [128] |
J. Fowler, The linear-quadratic formula and progress in fractionated radiotherapy, Br. J. Radiol., 62 (1989), 679–694. https://doi.org/10.1259/0007-1285-62-740-679 doi: 10.1259/0007-1285-62-740-679
|
| [129] | G. Wiernik, Fractionation in radiotherapy, Anticancer Res., 3 (1983), 283–297. |
| [130] |
S. McMahon, The linear quadratic model: usage, interpretation and challenges, Phys. Med. Biol., 64 (2019), 01TR01. https://doi.org/10.1088/1361-6560/aaf26a doi: 10.1088/1361-6560/aaf26a
|
| [131] |
H. Enderling, M. Chaplain, P. Hahnfeldt, Quantitative modeling of tumor dynamics and radiotherapy, Acta Biotheor., 58 (2010), 341–353. https://doi.org/10.1007/s10441-010-9111-z doi: 10.1007/s10441-010-9111-z
|
| [132] |
J. Harrold, P. Gisleskog, I. Delor, P. Jacqmin, J. Perez-Ruixo, A. Narayanan, et al., Quantification of radiation injury on neutropenia and the link between absolute neutrophil count time course and overall survival in nonhuman primates treated with G-CSF, Pharm. Res., 37 (2020), 102. https://doi.org/10.1007/s11095-020-02839-3 doi: 10.1007/s11095-020-02839-3
|
| [133] |
A. Wisdom, C. Hong, A. Lin, Y. Xiang, D. Cooper, J. Zhang, et al., Neutrophils promote tumor resistance to radiation therapy, Proc. Natl. Acad. Sci. U.S.A., 116 (2019), 18584–18589. https://doi.org/10.1073/pnas.1901562116 doi: 10.1073/pnas.1901562116
|
| [134] |
H. Thames, S. Bentzen, I. Turesson, M. Overgaard, W. V. den Bogaert, Time-dose factors in radiotherapy: a review of the human data, Radiother. Oncol., 19 (1990), 219–235. https://doi.org/10.1016/0167-8140(90)90149-Q doi: 10.1016/0167-8140(90)90149-Q
|
| [135] |
P. Blake, A. Swart, J. Orton, H. Kitchener, T. Whelan, H. Lukka, et al., Adjuvant external beam radiotherapy in the treatment of endometrial cancer (MRC ASTEC and NCIC CTG EN. 5 randomised trials): pooled trial results, systematic review, and meta-analysis, Lancet, 373 (2009), 137–146. https://doi.org/10.1016/S0140-6736(08)61767-5 doi: 10.1016/S0140-6736(08)61767-5
|
| [136] |
S. Faria, W. Schlupp, H. Chiminazzo Jr, Radiotherapy in the treatment of vertebral hemangiomas, Int. J. Radiat. Oncol. Biol. Phys., 11 (1985), 387–390. https://doi.org/10.1016/0360-3016(85)90162-2 doi: 10.1016/0360-3016(85)90162-2
|
| [137] | S. Lenhart, J. Workman, Optimal Control Applied to Biological Models, 1st edition, Chapman and Hall/CRC, 2007. |
| [138] |
A. Jarrett, D. Faghihi, D. Ii, E. Lima, J. Virostko, G. Biros, et al., Optimal control theory for personalized therapeutic regimens in oncology: Background, history, challenges, and opportunities, J. Clin. Med., 9 (2020), 1314. https://doi.org/10.3390/jcm9051314 doi: 10.3390/jcm9051314
|
| [139] |
K. Bahrami, M. Kim, Optimal control of multiplicative control systems arising from cancer therapy, IEEE Trans. Autom. Control, 20 (1975), 537–542. https://doi.org/10.1109/TAC.1975.1101019 doi: 10.1109/TAC.1975.1101019
|
| [140] |
G. W. Swan, T. L. Vincent, Optimal control analysis in the chemotherapy of IGG multiple myeloma, Bull. Math. Biol., 39 (1977), 317–337. https://doi.org/10.1016/S0092-8240(77)80070-0 doi: 10.1016/S0092-8240(77)80070-0
|
| [141] |
G. W. Swan, Optimal control applications in the chemotherapy of multiple myeloma, Math. Med. Biol., 2 (1985), 139–160. https://doi.org/10.1093/imammb/2.3.139 doi: 10.1093/imammb/2.3.139
|
| [142] |
A. Ergun, K. Camphausen, L. Wein, Optimal scheduling of radiotherapy and angiogenic inhibitors, Bull. Math. Biol., 65 (2003), 407–424. https://doi.org/10.1016/S0092-8240(03)00006-5 doi: 10.1016/S0092-8240(03)00006-5
|
| [143] |
D. Lee, A. de Los Reyes V, Y. Kim, Optimal strategies of oncolytic virus-bortezomib therapy via the apoptotic, necroptotic, and oncolysis signaling network, Math. Biosci. Eng., 21 (2024), 3876–3909. https://doi.org/10.3934/mbe.2024173 doi: 10.3934/mbe.2024173
|
| [144] |
E. Ratajczyk, U. Ledzewicz, H. Schattler, Optimal control for a mathematical model of glioma treatment with oncolytic therapy and TNF-$\alpha$ inhibitors, J. Optim. Theory Appl., 176 (2018), 456–477. https://doi.org/10.1007/s10957-018-1218-4 doi: 10.1007/s10957-018-1218-4
|
| [145] | H. Schattler, Y. Kim, U. Ledzewicz, A. los Reyes V, E. Jung, On the control of cell migration and proliferation in glioblastoma, in Proceeding of the IEEE Conference on Decision and Control, (2013), 1810–1815. https://doi.org/10.1109/CDC.2013.6760145 |
| [146] |
E. Jung, A. los Reyes, K. Pumares, Y. Kim, Strategies in regulating glioblastoma signaling pathways and anti-invasion therapy, PLoS One, 14 (2019), e0215547. https://doi.org/10.1371/journal.pone.0215547 doi: 10.1371/journal.pone.0215547
|
| [147] |
A. L. Reyes, E. Jung, Y. Kim, Optimal control strategies of eradicating invisible glioblastoma cells after conventional surgery, J. Roy. Soc. Interface, 12 (2015), 20141392. https://doi.org/10.1098/rsif.2014.1392 doi: 10.1098/rsif.2014.1392
|
| [148] |
A. Reyes, Y. Kim, Optimal regulation of tumour-associated neutrophils in cancer progression, R. Soc. Open Sci., 9 (2022), 210705. https://doi.org/10.1098/rsos.210705 doi: 10.1098/rsos.210705
|
| [149] |
G. Boivin, P. Ancey, R. de Silly, P. Kalambaden, C. Contat, B. Petit, et al., Anti-Ly6G binding and trafficking mediate positive neutrophil selection to unleash the anti-tumor efficacy of radiation therapy, Oncoimmunology, 10 (2021), 1876597. https://doi.org/10.1080/2162402X.2021.1876597 doi: 10.1080/2162402X.2021.1876597
|
| [150] |
Z. Zhang, X. Liu, D. Chen, J. Yu, Radiotherapy combined with immunotherapy: the dawn of cancer treatment, Signal Transduction Targeted Ther., 7 (2022), 258. https://doi.org/10.1038/s41392-022-01102-y doi: 10.1038/s41392-022-01102-y
|
| [151] |
M. Grinde, J. Vik, K. Camilio, I. Martinez-Zubiaurre, T. Hellevik, Ionizing radiation abrogates the pro-tumorigenic capacity of cancer-associated fibroblasts co-implanted in xenografts, Sci. Rep., 7 (2017), 46714. https://doi.org/10.1038/srep46714 doi: 10.1038/srep46714
|
| [152] |
O. Al-Assar, F. Demiciorglu, S. Lunardi, M. Gaspar-Carvalho, W. McKenna, R. Muschel, et al., Contextual regulation of pancreatic cancer stem cell phenotype and radioresistance by pancreatic stellate cells, Radiother. Oncol., 111 (2014), 243–251. https://doi.org/10.1016/j.radonc.2014.03.014 doi: 10.1016/j.radonc.2014.03.014
|
| [153] |
C. Arteaga, J. Engelman, ERBB receptors: from oncogene discovery to basic science to mechanism-based cancer therapeutics, Cancer Cell, 25 (2014), 282–303. https://doi.org/10.1016/j.ccr.2014.02.025 doi: 10.1016/j.ccr.2014.02.025
|
| [154] |
S. Du, S. Bouquet, C. Lo, I. Pellicciotta, S. Bolourchi, R. Parry, et al., Attenuation of the dna damage response by transforming growth factor-beta inhibitors enhances radiation sensitivity of non-small-cell lung cancer cells in vitro and in vivo, Int. J. Radiat. Oncol. Biol. Phys., 91 (2015), 91–99. https://doi.org/10.1016/j.ijrobp.2014.09.026 doi: 10.1016/j.ijrobp.2014.09.026
|
| [155] |
E. Dieleman, A. Uitterhoeve, M. van Hoek, R. van Os, J. Wiersma, M. Koolen, et al., Concurrent daily cisplatin and high-dose radiation therapy in patients with stage iii non-small cell lung cancer, Int. J. Radiat. Oncol. Biol. Phys., 102 (2018), 543–551. https://doi.org/10.1016/j.ijrobp.2018.07.188 doi: 10.1016/j.ijrobp.2018.07.188
|
| [156] |
S. Vora, B. Daly, L. Blaszkowsky, J. McGrath, M. Bankoff, S. Supran, et al., High dose radiation therapy and chemotherapy as induction treatment for stage iii nonsmall cell lung carcinoma, Cancer, 89 (2000), 1946–1952. https://doi.org/10.1002/1097-0142(20001101)89:9<1946::AID-CNCR10>3.0.CO;2-1 doi: 10.1002/1097-0142(20001101)89:9<1946::AID-CNCR10>3.0.CO;2-1
|
| [157] |
F. Kong, R. T. Haken, M. Schipper, M. Sullivan, M. Chen, C. Lopez, et al., High-dose radiation improved local tumor control and overall survival in patients with inoperable/unresectable non-small-cell lung cancer: long-term results of a radiation dose escalation study, Int. J. Radiat. Oncol. Biol. Phys., 63 (2005), 324–333. https://doi.org/10.1016/j.ijrobp.2005.02.010 doi: 10.1016/j.ijrobp.2005.02.010
|
| [158] |
M. Manus, K. Lamborn, W. Khan, A. Varghese, L. Graef, S. Knox, Radiotherapy-associated neutropenia and thrombocytopenia: analysis of risk factors and development of a predictive model, Blood, 89 (1997), 2303–2310. https://doi.org/10.1182/blood.V89.7.2303 doi: 10.1182/blood.V89.7.2303
|
| [159] |
R. Prabhu, R. Cassidy, J. Landry, Radiation therapy and neutropenia, Curr. Probl. Cancer, 39 (2015), 292–296. https://doi.org/10.1016/j.currproblcancer.2015.07.010 doi: 10.1016/j.currproblcancer.2015.07.010
|
| [160] |
T. Smith, J. Khatcheressian, G. Lyman, H. Ozer, J. Armitage, L. Balducci, et al., 2006 update of recommendations for the use of white blood cell growth factors: an evidence-based clinical practice guideline, J. Clin. Oncol., 24 (2006), 3187–3205. https://doi.org/10.1200/JCO.2006.06.4451 doi: 10.1200/JCO.2006.06.4451
|
| [161] |
J. Crawford, C. Caserta, F. Roila, Hematopoietic growth factors: ESMO clinical practice guidelines for the applications, Ann. Oncol., 21 (2010), 248–251. https://doi.org/10.1093/annonc/mdq195 doi: 10.1093/annonc/mdq195
|
| [162] |
P. Mauch, L. Constine, J. Greenberger, W. Knospe, J. Sullivan, J. Liesveld, et al., Hematopoietic stem cell compartment: acute and late effects of radiation therapy and chemotherapy, Int. J. Radiat. Oncol. Biol. Phys., 31 (1995), 1319–1339. https://doi.org/10.1016/0360-3016(94)00430-S doi: 10.1016/0360-3016(94)00430-S
|
| [163] |
A. Farese, T. MacVittie, Filgrastim for the treatment of hematopoietic acute radiation syndrome, Drugs Today (Barc), 51 (2015), 537–548. https://doi.org/10.1358/dot.2015.51.9.2386730 doi: 10.1358/dot.2015.51.9.2386730
|
| [164] |
P. Cornes, P. Gascon, S. Chan, K. Hameed, C. Mitchell, P. Field, et al., Systematic review and meta-analysis of short- versus long-acting granulocyte colony-stimulating factors for reduction of chemotherapy-induced febrile neutropenia, Adv. Ther., 35 (2018), 1816–1829. https://doi.org/10.1007/s12325-018-0798-6 doi: 10.1007/s12325-018-0798-6
|
| [165] |
Y. Zeng, X. Lv, J. Du, Natural killer cell-based immunotherapy for lung cancer: Challenges and perspectives (review), Oncol. Rep., 46 (2021), 232. https://doi.org/10.3892/or.2021.8183 doi: 10.3892/or.2021.8183
|
| [166] |
P. Carrega, B. Morandi, R. Costa, G. Frumento, G. Forte, G. Altavilla, et al., Natural killer cells infiltrating human nonsmall-cell lung cancer are enriched in CD56 bright CD16(-) cells and display an impaired capability to kill tumor cells, Cancer, 112 (2008), 863–875. https://doi.org/10.1002/cncr.23239 doi: 10.1002/cncr.23239
|
| [167] |
S. Platonova, J. Cherfils-Vicini, D. Damotte, L. Crozet, V. Vieillard, P. Validire, et al., Profound coordinated alterations of intratumoral NK cell phenotype and function in lung carcinoma, Cancer Res., 71 (2011), 5412–5422. https://doi.org/10.1158/0008-5472.CAN-10-4179 doi: 10.1158/0008-5472.CAN-10-4179
|
| [168] |
Y. Laouar, F. Sutterwala, L. Gorelik, R. Flavell, Transforming growth factor-$\beta$ controls T helper type 1 cell development through regulation of natural killer cell interferon-$\gamma$, Nat. Immunol., 6 (2005), 600–607. https://doi.org/10.1038/ni1197 doi: 10.1038/ni1197
|
| [169] |
B. Bassani, D. Baci, M. Gallazzi, A. Poggi, A. Bruno, L. Mortara, Natural killer cells as key players of tumor progression and angiogenesis: Old and novel tools to divert their pro-tumor activities into potent anti-tumor effects, Cancers (Basel), 11 (2019), 461. https://doi.org/10.3390/cancers11040461 doi: 10.3390/cancers11040461
|
| [170] |
M. Balsamo, W. Vermi, M. Parodi, G. Pietra, C. Manzini, P. Queirolo, et al., Melanoma cells become resistant to NK-cell-mediated killing when exposed to NK-cell numbers compatible with NK-cell infiltration in the tumor, Eur. J. Immunol., 42 (2012), 1833–1842. https://doi.org/10.1002/eji.201142179 doi: 10.1002/eji.201142179
|
| [171] |
T. Li, Y. Yang, X. Hua, G. Wang, W. Liu, C. Jia, et al., Hepatocellular carcinoma-associated fibroblasts trigger NK cell dysfunction via PGE2 and IDO, Cancer Lett., 318 (2012), 154–161. https://doi.org/10.1016/j.canlet.2011.12.020 doi: 10.1016/j.canlet.2011.12.020
|
| [172] |
T. Li, S. Yi, W. Liu, C. Jia, G. Wang, X. Hua, et al., Colorectal carcinoma-derived fibroblasts modulate natural killer cell phenotype and antitumor cytotoxicity, Med. Oncol., 30 (2013), 663. https://doi.org/10.1007/s12032-013-0663-z doi: 10.1007/s12032-013-0663-z
|
| [173] |
C. Granville, R. Memmott, A. Balogh, J. Mariotti, S. Kawabata, W. Han, et al., A central role for Foxp3+ regulatory T cells in K-Ras-driven lung tumorigenesis, PLoS One, 4 (2009), e5061. https://doi.org/10.1371/journal.pone.0005061 doi: 10.1371/journal.pone.0005061
|
| [174] |
M. J. Smyth, M. W. Teng, J. Swann, K. Kyparissoudis, D. I. Godfrey, Y. Hayakawa, CD4+ CD25+T regulatory cells suppress NK cell-mediated immunotherapy of cancer, J. Immunol., 176 (2006), 1582–1587. https://doi.org/10.4049/jimmunol.176.3.1582 doi: 10.4049/jimmunol.176.3.1582
|
| [175] |
F. Ghiringhelli, C. Menard, M. Terme, C. Flament, J. Taieb, N. Chaput, et al., CD4+CD25+ regulatory T cells inhibit natural killer cell functions in a transforming growth factor-beta-dependent manner, J. Exp. Med., 202 (2005), 1075–1085. https://doi.org/10.1084/jem.20051511 doi: 10.1084/jem.20051511
|
| [176] |
A. Page, N. Chuvin, J. Valladeau-Guilemond, S. Depil, Development of NK cell-based cancer immunotherapies through receptor engineering, Cell Mol. Immunol., 21 (2024), 315–331. https://doi.org/10.1038/s41423-024-01145-x doi: 10.1038/s41423-024-01145-x
|
| [177] |
J. Markert, P. Liechty, W. Wang, S. Gaston, E. Braz, M. Karrasch, et al., Phase Ib trial of mutant herpes simplex virus G207 inoculated pre-and post-tumor resection for recurrent GBM, Mol. Ther., 17 (2009), 199–207. https://doi.org/10.1038/mt.2008.228 doi: 10.1038/mt.2008.228
|
| [178] |
M. Grimes, B. Hall, L. Foltz, T. Levy, K. Rikova, J. Gaiser, et al., Integration of protein phosphorylation, acetylation, and methylation data sets to outline lung cancer signaling networks, Sci. Signal., 11 (2018), eaaq1087. https://doi.org/10.1126/scisignal.aaq1087 doi: 10.1126/scisignal.aaq1087
|
| [179] |
J. Qu, Y. Zhang, X. Chen, H. Yang, C. Zhou, N. Yang, Newly developed anti-angiogenic therapy in non-small cell lung cancer, Oncotarget, 9 (2017), 10147–10163. https://doi.org/10.18632/oncotarget.23755 doi: 10.18632/oncotarget.23755
|
| [180] |
S. Revels, J. Lee, Anti-angiogenic therapy in nonsquamous non-small cell lung cancer (NSCLC) with tyrosine kinase inhibition (TKI) that targets the VEGF receptor (VEGFR): perspective on phase Ⅲ clinical trials, J. Thorac. Dis., 10 (2018), 617–620. https://doi.org/10.21037/jtd.2018.01.105 doi: 10.21037/jtd.2018.01.105
|
| [181] |
M. Stratigos, A. Matikas, A. Voutsina, D. Mavroudis, V. Georgoulias, Targeting angiogenesis in small cell lung cancer, Transl. Lung Cancer Res., 5 (2016), 389–400. https://doi.org/10.21037/tlcr.2016.08.04 doi: 10.21037/tlcr.2016.08.04
|
| [182] |
S. Lee, H. Kwak, M. Kang, Y. Park, G. Jeong, Fibroblast-associated tumour microenvironment induces vascular structure-networked tumouroid, Sci. Rep., 8 (2018), 2365. https://doi.org/10.1038/s41598-018-20886-0 doi: 10.1038/s41598-018-20886-0
|
| [183] |
B. Lee, J. Konen, S. Wilkinson, A. Marcus, Y. Jiang, Local alignment vectors reveal cancer cell-induced ECM fiber remodeling dynamics, Sci. Rep., 7 (2017), 39498. https://doi.org/10.1038/srep39498 doi: 10.1038/srep39498
|
| [184] |
S. Pyonteck, L. Akkari, A. Schuhmacher, R. Bowman, L. Sevenich, D. Quail, et al., CSF-1R inhibition alters macrophage polarization and blocks glioma progression, Nat. Med., 19 (2013), 1264–1272. https://doi.org/10.1038/nm.3337 doi: 10.1038/nm.3337
|
| [185] |
S. Arelaki, A. Arampatzioglou, K. Kambas, C. Papagoras, P. Miltiades, I. Angelidou, et al., Gradient infiltration of neutrophil extracellular traps in colon cancer and evidence for their involvement in tumour growth, PLoS One, 11 (2016), e0154484. https://doi.org/10.1371/journal.pone.0154484 doi: 10.1371/journal.pone.0154484
|
| [186] |
A. Houghton, D. Rzymkiewicz, H. Ji, A. Gregory, E. Egea, H. Metz, et al., Neutrophil elastase-mediated degradation of IRS-1 accelerates lung tumor growth, Nat. Med., 16 (2010), 219–223. https://doi.org/10.1038/nm.2084 doi: 10.1038/nm.2084
|
| [187] |
J. Park, R. Wysocki, Z. Amoozgar, L. Maiorino, M. Fein, J. Jorns, et al., Cancer cells induce metastasis-supporting neutrophil extracellular DNA traps, Sci. Transl. Med., 8 (2016), 361ra138. https://doi.org/10.1126/scitranslmed.aag1711 doi: 10.1126/scitranslmed.aag1711
|
| [188] |
A. Chapgier, S. Boisson-Dupuis, E. Jouanguy, G. Vogt, J. Feinberg, A. Prochnicka-Chalufour, et al., Novel STAT1 alleles in otherwise healthy patients with mycobacterial disease, PLoS Genet., 2 (2006), e131. https://doi.org/10.1371/journal.pgen.0020131 doi: 10.1371/journal.pgen.0020131
|
| [189] |
P. Klover, W. Muller, G. Robinson, R. Pfeiffer, D. Yamaji, L. Hennighausen, Loss of STAT1 from mouse mammary epithelium results in an increased Neu-induced tumor burden, Neoplasia, 12 (2010), 899–905. https://doi.org/10.1593/neo.10716 doi: 10.1593/neo.10716
|
| [190] |
R. Noy, J. Pollard, Tumor-associated macrophages: from mechanisms to therapy, Immunity, 41 (2014), 49–61. https://doi.org/10.1016/j.immuni.2014.06.010 doi: 10.1016/j.immuni.2014.06.010
|
| [191] |
A. Mantovani, S. Biswas, M. Galdiero, A. Sica, M. Locati, Macrophage plasticity and polarization in tissue repair and remodelling, J. Pathol., 229 (2013), 176–185. https://doi.org/10.1002/path.4133 doi: 10.1002/path.4133
|
| [192] |
B. Yan, J. Wei, Y. Yuan, R. Sun, D. Li, J. Luo, et al., IL-6 cooperates with G-CSF to induce protumor function of neutrophils in bone marrow by enhancing STAT3 activation, J. Immunol., 190 (2013), 5882–5893. https://doi.org/10.4049/jimmunol.1201881 doi: 10.4049/jimmunol.1201881
|
| [193] |
K. Steinbach, P. Schick, F. Trepel, H. Raffler, J. Dohrmann, G. Heilgeist, et al., Estimation of kinetic parameters of neutrophilic, eosinophilic, and basophilic granulocytes in human blood, Blut, 39 (1979), 27–38. https://doi.org/10.1007/BF01008072 doi: 10.1007/BF01008072
|
| [194] |
D. Dale, W. C. Liles, C. Llewellyn, E. Rodger, T. H. Price, Neutrophil transfusions: kinetics and functions of neutrophils mobilized with granulocyte-colony-stimulating factor and dexamethasone, Transfusion, 38 (1998), 713–721. https://doi.org/10.1046/j.1537-2995.1998.38898375509.x doi: 10.1046/j.1537-2995.1998.38898375509.x
|
| [195] |
Y. Kim, H. Othmer, A hybrid model of tumor-stromal interactions in breast cancer, Bull. Math. Biol., 75 (2013), 1304–1350. https://doi.org/10.1007/s11538-012-9787-0 doi: 10.1007/s11538-012-9787-0
|
| [196] |
J. Diao, E. Winter, C. Cantin, W. Chen, L. Xu, D. Kelvin, et al., In situ replication of immediate dendritic cell (DC) precursors contributes to conventional DC homeostasis in lymphoid tissue, J. Immunol., 176 (2006), 7196–7206. https://doi.org/10.4049/jimmunol.176.12.7196 doi: 10.4049/jimmunol.176.12.7196
|
| [197] |
P. Salmon, J. L. Cotonnec, A. Galazka, A. Abdul-Ahad, A. Darragh, Pharmacokinetics and pharmacodynamics of recombinant human interferon-beta in healthy male volunteers, J. Interferon Cytokine Res., 16 (1996), 759–964. https://doi.org/10.1089/jir.1996.16.759 doi: 10.1089/jir.1996.16.759
|
| [198] |
Y. Zhang, D. Wallace, C. de Lara, H. Ghattas, B. Asquith, A. Worth, et al., In vivo kinetics of human natural killer cells: the effects of ageing and acute and chronic viral infection, Immunology, 121 (2007), 258–265. https://doi.org/10.1111/j.1365-2567.2007.02573.x doi: 10.1111/j.1365-2567.2007.02573.x
|
| [199] |
K. Stringaris, Orphan NKs! the mystery of the self-renewing NK cells, Blood, 129 (2017), 1890–1891. https://doi.org/10.1182/blood-2016-12-755546 doi: 10.1182/blood-2016-12-755546
|
| [200] |
N. Stute, V. Santana, J. Rodman, M. Schell, J. Ihle, W. Evans, Pharmacokinetics of subcutaneous recombinant human granulocyte colony-stimulating factor in children, Blood, 79 (1992), 2849–2854. https://doi.org/10.1182/blood.V79.11.2849.2849 doi: 10.1182/blood.V79.11.2849.2849
|
| [201] |
E. Shochat, V. Rom-Kedar, L. Segel, G-CSF control of neutrophils dynamics in the blood, Bull. Math. Biol., 69 (2007), 2299–2338. https://doi.org/10.1007/s11538-007-9221-1 doi: 10.1007/s11538-007-9221-1
|
| [202] |
L. Deng, H. Liang, M. Xu, X. Yang, B. Burnette, A. Arina, et al., Sting-dependent cytosolic dna sensing promotes radiation-induced type Ⅰ interferon-dependent antitumor immunity in immunogenic tumors, Immunity, 41 (2014), 843–52. https://doi.org/10.1016/j.immuni.2014.10.019 doi: 10.1016/j.immuni.2014.10.019
|
| [203] |
J. Andrejeva, D. Young, S. Goodbourn, R. Randall, Degradation of STAT1 and STAT2 by the Ⅴ proteins of simian virus 5 and human parainfluenza virus type 2, respectively: consequences for virus replication in the presence of alpha/beta and gamma interferons, J. Virol., 76 (2002), 2159–2167. https://doi.org/10.1128/jvi.76.5.2159-2167.2002 doi: 10.1128/jvi.76.5.2159-2167.2002
|
| [204] | L. Yang, R. Wang, Z. Ma, Y. Xiao, Y. Nan, Y. Wang, et al., Porcine reproductive and respiratory syndrome virus antagonizes JAK/STAT3 signaling via nsp5 by inducing STAT3 degradation, J. Virol., 91 (2017), e02087–16. |
| [205] |
R. Rooswinkel, B. van de Kooij, E. de Vries, M. Paauwe, R. Braster, et al., Antiapoptotic potency of Bcl-2 proteins primarily relies on their stability, not binding selectivity, Blood, 123 (2014), 2806–2815. https://doi.org/10.1182/blood-2013-08-519470 doi: 10.1182/blood-2013-08-519470
|
| [206] |
M. Blagosklonny, M. Alvarez, A. Fojo, L. Neckers, bcl-2 protein downregulation is not required for differentiation of multidrug resistant HL60 leukemia cells, Leuk. Res., 20 (1996), 101–107. https://doi.org/10.1016/0145-2126(95)00103-4 doi: 10.1016/0145-2126(95)00103-4
|
| [207] |
S. Magal, A. Jackman, S. Ish-Shalom, L. Botzer, P. Gonen, R. Schlegel, et al., Downregulation of Bax mRNA expression and protein stability by the E6 protein of human papillomavirus 16, J. Gen. Virol., 86 (2005), 611–621. https://doi.org/10.1099/vir.0.80453-0 doi: 10.1099/vir.0.80453-0
|
| [208] |
M. Xin, X. Deng, Nicotine inactivation of the proapoptotic function of Bax through phosphorylation, J. Biol. Chem., 280 (2005), 10781–10789. https://doi.org/10.1074/jbc.M500084200 doi: 10.1074/jbc.M500084200
|
| [209] |
E. Gaffney, K. Pugh, P. Maini, F. Arnold, Investigating a simple model of cutaneous wound healing angiogenesis, J. Math. Biol., 45 (2002), 337–374. https://doi.org/10.1007/s002850200161 doi: 10.1007/s002850200161
|
| [210] |
G. Pettet, H. Byrne, D. McElwain, J. Norbury, A model of wound-healing angiogenesis in soft tissue, Math. Biosci., 136 (1996), 35–63. https://doi.org/10.1016/0025-5564(96)00044-2 doi: 10.1016/0025-5564(96)00044-2
|
| [211] |
P. Moghe, R. Nelson, R. Tranquillo, Cytokine-stimulated chemotaxis of human neutrophils in a 3-D conjoined fibrin gel assay, J. Immunol. Methods, 180 (1995), 193–211. https://doi.org/10.1016/0022-1759(94)00314-M doi: 10.1016/0022-1759(94)00314-M
|
| [212] |
D. Brown, Dependence of neurones on astrocytes in a coculture system renders neurones sensitive to transforming growth factor beta1-induced glutamate toxicity, J. Neurochem., 72 (1999), 943–953. https://doi.org/10.1046/j.1471-4159.1999.0720943.x doi: 10.1046/j.1471-4159.1999.0720943.x
|
| [213] | S. Koka, J. Vance, G. Maze, Bone growth factors: potential for use as an osseointegration enhancement technique (OET), J. West Soc. Periodontol. Periodontal. Abstr., 43 (1995), 97–104. |
| [214] |
E. Woodcock, S. Land, R. Andrews, A low affinity, low molecular weight endothelin-a receptor present in neonatal rat heart, Clin. Exp. Pharmacol. Physiol., 20 (1993), 331–334. https://doi.org/10.1111/j.1440-1681.1993.tb01697.x doi: 10.1111/j.1440-1681.1993.tb01697.x
|
| [215] |
M. Serizawa, T. Takahashi, N. Yamamoto, Y. Koh, Combined treatment with erlotinib and a transforming growth factor-$\beta$ type Ⅰ receptor inhibitor effectively suppresses the enhanced motility of erlotinib-resistant non-small-cell lung cancer cells, J. Thorac. Oncol., 8 (2013), 259–269. https://doi.org/10.1097/JTO.0b013e318279e942 doi: 10.1097/JTO.0b013e318279e942
|
| [216] |
J. Maher, R. Zhang, G. Palanisamy, K. Perkins, L. Liu, P. Brassil, et al., Lung-restricted ALK5 inhibition avoids systemic toxicities associated with TGF$\beta$ pathway inhibition, Toxicol. Appl. Pharmacol., 438 (2022), 115905. https://doi.org/10.1016/j.taap.2022.115905 doi: 10.1016/j.taap.2022.115905
|
| [217] |
L. Spender, G. J. Ferguson, G. Hughes, B. Davies, F. Goldberg, B. Herrera, et al., Preclinical evaluation of AZ12601011 and AZ12799734, inhibitors of transforming growth factor $\beta$ superfamily type 1 receptors, Mol. Pharmacol., 95 (2019), 222–234. https://doi.org/10.1124/mol.118.112946 doi: 10.1124/mol.118.112946
|
| [218] |
A. Friedman, J. P. Tian, G. Fulci, E. A. Chiocca, J. Wang, Glioma virotherapy: effects of innate immune suppression and increased viral replication capacity, Cancer Res., 66 (2006), 2314–2319. https://doi.org/10.1158/0008-5472.CAN-05-2661 doi: 10.1158/0008-5472.CAN-05-2661
|
| [219] |
X. Liu, Z. Wang, Y. Yang, L. Wang, R. Sun, Y. Zhao, et al., Active components with inhibitory activities on IFN-$\gamma$/STAT1 and IL-6/ATAT3 signaling pathways from caulis trachelospermi, Molecules, 19 (2014), 11560–11571. https://doi.org/10.3390/molecules190811560 doi: 10.3390/molecules190811560
|
| [220] |
L. Chen, S. Willis, A. Wei, B. Smith, J. Fletcher, M. Hinds, et al., Differential targeting of prosurvival Bcl-2 proteins by their BH3-only ligands allows complementary apoptotic function, Mol. Cell, 17 (2005), 393–403. https://doi.org/10.1016/j.molcel.2004.12.030 doi: 10.1016/j.molcel.2004.12.030
|
| [221] |
M. Shanmugam, H. Shen, F. Tang, F. Arfuso, M. Rajesh, L. Wang, et al., Potential role of genipin in cancer therapy, Pharmacol. Res., 133 (2018), 195–200. https://doi.org/10.1016/j.phrs.2018.05.007 doi: 10.1016/j.phrs.2018.05.007
|
| [222] |
P. Gascon, U. Fuhr, F. Sorgel, M. Kinzig-Schippers, A. Makhson, S. Balser, et al., Development of a new G-CSF product based on biosimilarity assessment, Ann. Oncol., 21 (2010), 1419–1429. https://doi.org/10.1093/annonc/mdp574 doi: 10.1093/annonc/mdp574
|
| [223] |
Z. Tekdemir, A. Seckin, T. Kacar, E. Yilmaz, S. Bekiroglu, Evaluation of structural, biological, and functional similarity of biosimilar granulocyte colony stimulating factor to its reference product, Pharm. Res., 37 (2020), 215. https://doi.org/10.1007/s11095-020-02932-7 doi: 10.1007/s11095-020-02932-7
|
Figures(22) / Tables(5)

Donggu Lee, Sunju Oh, Sean Lawler, Yangjin Kim. Bistable dynamics of TAN-NK cells in tumor growth and control of radiotherapy-induced neutropenia in lung cancer treatment[J]. Mathematical Biosciences and Engineering, 2025, 22(4): 744-809. doi: 10.3934/mbe.2025028


 DownLoad: