Infectious diseases continue to pose a grave threat to humanity. Beyond uncontrollable factors like climate change and viral evolution, understanding the effect of human mobility on the infectious disease's dominant period is of great significance. In this study, we develop a two-patch SIS model with demographic dynamics using a Markov modeling approach. By applying the Fourier transform, we derive the power spectral density of the infected population. Model parameters are estimated by fitting the model to influenza data from Beijing and Shanghai for the period 2004–2018. Our numerical results demonstrate that the diffusion rate only generates a dominant period for influenza within a specific parameter range. Furthermore, a nonlinear relationship exists between the diffusion rate and the dominant period under specific parameter values: As the diffusion rate increases, the dominant period initially decreases before increasing, yet the above results depend on the model structure and the parameter values.
Citation: Hong Yang, Fenfen Zhang. Modeling the dominant period of infectious disease: The effect of human dispersal in a coupled two-patch SIS model[J]. AIMS Mathematics, 2026, 11(11): 37355-37376. doi: 10.3934/math.20261445
Infectious diseases continue to pose a grave threat to humanity. Beyond uncontrollable factors like climate change and viral evolution, understanding the effect of human mobility on the infectious disease's dominant period is of great significance. In this study, we develop a two-patch SIS model with demographic dynamics using a Markov modeling approach. By applying the Fourier transform, we derive the power spectral density of the infected population. Model parameters are estimated by fitting the model to influenza data from Beijing and Shanghai for the period 2004–2018. Our numerical results demonstrate that the diffusion rate only generates a dominant period for influenza within a specific parameter range. Furthermore, a nonlinear relationship exists between the diffusion rate and the dominant period under specific parameter values: As the diffusion rate increases, the dominant period initially decreases before increasing, yet the above results depend on the model structure and the parameter values.

| [1] |
S. P. de Jong, A. J. Conlan, A. X. Han, C. A. Russell, Competition between transmission lineages mediated by human mobility shapes seasonal influenza epidemics in the US, Nat. Commun., 16 (2025), 4605. https://doi.org/10.1038/s41467-025-59757-4 doi: 10.1038/s41467-025-59757-4
|
| [2] |
S. Pei, S. Kandula, W. Yang, J. Shaman, Forecasting the spatial transmission of influenza in the United States, P. Natl. A. Sci. USA, 115 (2018), 2752–2757. https://doi.org/10.1073/pnas.1708856115 doi: 10.1073/pnas.1708856115
|
| [3] |
P. Agarwal, J. J. Nieto, D. F. M. Torres, Mathematical analysis of infectious diseases, Academic Press, Cambridge, MA, 2022. |
| [4] |
A. ul Rehman, R. Singh, P. Agarwal, Modeling, analysis and prediction of new variants of Covid-19 and dengue co-infection on complex network, Chaos Soliton. Fract., 150 (2021), 111008. https://doi.org/10.1016/j.chaos.2021.111008 doi: 10.1016/j.chaos.2021.111008
|
| [5] |
S. Chowdhury, J. Chowdhury, S. F. Ahmed, P. Agarwal, I. A. Badruddin, S. Kamangar, Mathematical modelling of COVID-19 disease dynamics: Interaction between immune system and SARS-CoV-2 within host, AIMS Math., 7 (2022), 2618–2633. https://doi.org/10.3934/math.2022147 doi: 10.3934/math.2022147
|
| [6] |
C. Castillo-Chavez, A. A. Yakubu, Dispersal, disease and life-history evolution, Math. Biosci., 173 (2001), 35–53. https://doi.org/10.1016/S0025-5564(01)00065-7 doi: 10.1016/S0025-5564(01)00065-7
|
| [7] |
F. Simini, M. C. González, A. Maritan, A. Barabási, A universal model for mobility and migration patterns, Nature, 484 (2012), 96–100. https://doi.org/10.1038/nature10856 doi: 10.1038/nature10856
|
| [8] |
D. Citron, C. Guerra, A. Dolgert, S. Wu, J. Henry, D. Smith, et al., Comparing metapopulation dynamics of infectious diseases under different models of human movement, P. Natl. A. Sci. USA, 118 (2021). https://doi.org/10.1073/pnas.2007488118 |
| [9] |
W. Wang, G. Mulone, Threshold of disease transmission in a patch environment, J. Math. Anal. Appl., 285 (2003), 321–335. https://doi.org/10.1016/S0022-247X(03)00428-1 doi: 10.1016/S0022-247X(03)00428-1
|
| [10] |
S. Chen, J. Shi, Z. Shuai, Y. Wu, Asymptotic profiles of the steady states for an SIS epidemic patch model with asymmetric connectivity matrix, J. Math. Biol., 80 (2020), 2327–2361. https://doi.org/10.1007/s00285-020-01497-8 doi: 10.1007/s00285-020-01497-8
|
| [11] |
D. Ayabina, H. Sevil, A. Kleczkowski, M. G. M. Gomes, A note on metapopulation models, J. Theor. Biol., 2025, 112213. https://doi.org/10.1016/j.jtbi.2025.112213 |
| [12] |
A. L. Krause, L. Kurowski, K. Yawar, R. A. Van Gorder, Stochastic epidemic metapopulation models on networks: SIS dynamics and control strategies, J. Theor. Biol., 449 (2018), 35–52. https://doi.org/10.1016/j.jtbi.2018.04.023 doi: 10.1016/j.jtbi.2018.04.023
|
| [13] |
H. Yu, W. J. Alonso, L. Feng, Y. Tan, Y. Shu, W. Yang, et al., Characterization of regional influenza seasonality patterns in China and implications for vaccination strategies: Spatio-temporal modeling of surveillance data, PLOS Med., 10 (2013), e1001552. https://doi.org/10.1371/journal.pmed.1001552 doi: 10.1371/journal.pmed.1001552
|
| [14] |
X. Si, Weather variability, socio-environmental factors and seasonal influenza transmission in mainland China: Spatiotemporal analyses, PhD thesis, Queensland University of Technology, 2025. |
| [15] |
C. Liu, H. Liu, X. Zhu, Z. Gangji, Q. Zhang, Y. Wei, Regional and seasonal analysis of influenza epidemics: A mathematical modeling study of 15 provinces in China, Int. J. Biomath., 2025, 2550099. https://doi.org/10.1142/S1793524525500998 |
| [16] |
C. Andreu-Vilarroig, G. González-Parra, R. J. Villanueva, Mathematical modeling of influenza dynamics: Integrating seasonality and gradual waning immunity, Bull. Math. Biol., 87 (2025), 75. https://doi.org/10.1007/s11538-025-01454-w doi: 10.1007/s11538-025-01454-w
|
| [17] |
K. M. Mohammad, A. A. Akhi, M. Kamrujjaman, Bifurcation analysis of an influenza A (H1N1) model with treatment and vaccination, PloS One, 20 (2025), e0315280. https://doi.org/10.1371/journal.pone.0315280 doi: 10.1371/journal.pone.0315280
|
| [18] |
X. Zhang, X. Zhang, D. Jiang, A study of a seasonal influenza model in deterministic and stochastic environments, J. Nonlinear Sci., 35 (2025), 37. https://doi.org/10.1007/s00332-025-10132-z doi: 10.1007/s00332-025-10132-z
|
| [19] |
R. Saadeh, A. A. Shokeralla, N. Al-Kuleab, W. S. Hamad, M. Ali, M. A. Abdoon, et al., Stochastic modelling of seasonal influenza dynamics: Integrating random perturbations and behavioural factors, Eur. J. Pure Appl. Math., 18 (2025), 6379–6379. https://doi.org/10.29020/nybg.ejpam.v18i3.6379 doi: 10.29020/nybg.ejpam.v18i3.6379
|
| [20] |
Y. Tan, R. Yao, Dynamics of an influenza epidemic model incorporating immune boosting and Ornstein–Uhlenbeck process, Chaos Soliton. Fract., 188 (2024), 115446. https://doi.org/10.1016/j.chaos.2024.115446 doi: 10.1016/j.chaos.2024.115446
|
| [21] |
J. Chaffee, R. Kuske, The effect of loss of immunity on noise-induced sustained oscillations in epidemics, Bull. Math. Biol., 73 (2011), 2552–2574. https://doi.org/10.1007/s11538-011-9635-7 doi: 10.1007/s11538-011-9635-7
|
| [22] |
P. D. Pra, E. Marini, Noise-induced oscillations for the mean-field dissipative contact process, Electron. J. Probab., 30 (2025), 1–31. https://doi.org/10.1214/25-EJP1295 doi: 10.1214/25-EJP1295
|
| [23] |
A. Hamdouni, M. E. Zidan, A. B. Mabrouk, M. Guettari, A wavelet time-frequency analysis of pandemic dynamics and impacts-Covid-19 case study, Int. J. Biomath., 2025. https://doi.org/10.1142/S1793524525500561 |
| [24] |
C. Mills, F. Falconi-Agapito, J. P. Carrera, C. Munayco, M. U. Kraemer, C. A. Donnelly, Multi-model approach to understand and predict past and future dengue epidemic dynamics, Roy. Soc. Open Sci., 12 (2025), 241870. https://doi.org/10.1098/rsos.241870 doi: 10.1098/rsos.241870
|
| [25] |
D. K. C. Vijaya, P. D. Gowda, B. Hadimani, A numerical study on the dynamics of SIR epidemic model through Genocchi wavelet collocation method, Sci. Rep., 15 (2025), 9780. https://doi.org/10.1038/s41598-025-93820-w doi: 10.1038/s41598-025-93820-w
|
| [26] |
R. H. Wang, Z. Jin, Q. X. Liu, J. V. D. Koppel, D. Alonso, A simple stochastic model with environmental transmission explains multi-year periodicity in outbreaks of avian flu, PLoS One, 7 (2012), e28873. https://doi.org/10.1371/journal.pone.0028873 doi: 10.1371/journal.pone.0028873
|
| [27] |
H. Yang, Z. Jin, A stochastic model explains the periodicity phenomenon of influenza on network, Sci. Rep., 11 (2021), 20996. https://doi.org/10.1038/s41598-021-00260-3 doi: 10.1038/s41598-021-00260-3
|
| [28] |
O. Diekmann, J. A. P. Heesterbeek, J. A. J. Metz, On the definition and the computation of the basic reproduction ratio r 0 in models for infectious diseases in heterogeneous populations, J. Math. Biol., 28 (1990), 365–382. |
| [29] |
P. Van den Driessche, J. Watmough, Reproduction numbers and sub-threshold endemic equilibria for compartmental models of disease transmission, Math. Biosci., 180 (2002), 29–48. https://doi.org/10.1016/S0025-5564(02)00108-6 doi: 10.1016/S0025-5564(02)00108-6
|
Figures(11) / Tables(2)

Hong Yang, Fenfen Zhang. Modeling the dominant period of infectious disease: The effect of human dispersal in a coupled two-patch SIS model[J]. AIMS Mathematics, 2026, 11(11): 37355-37376. doi: 10.3934/math.20261445

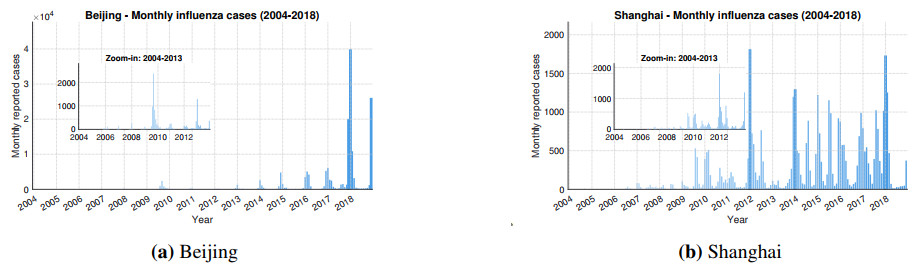
Monthly influenza data for Beijing and Shanghai
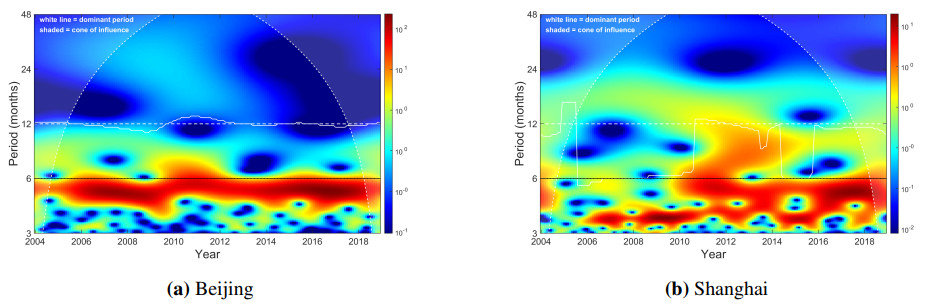
Morlet wavelet power spectrum for Beijing and Shanghai
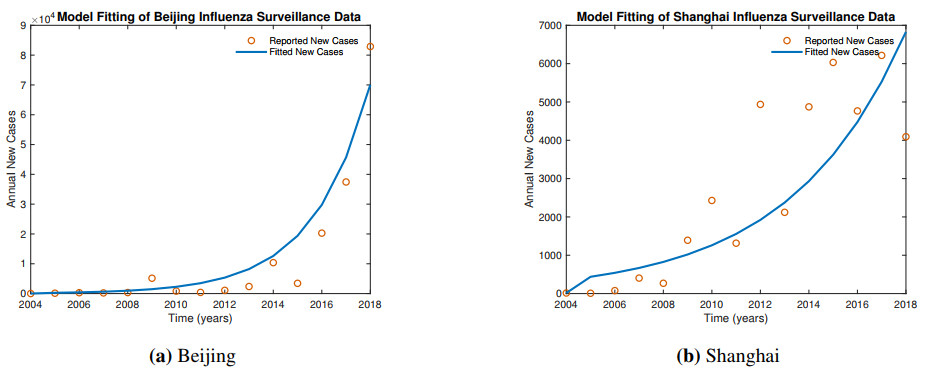
Fitting results of influenza data for Beijing and Shanghai
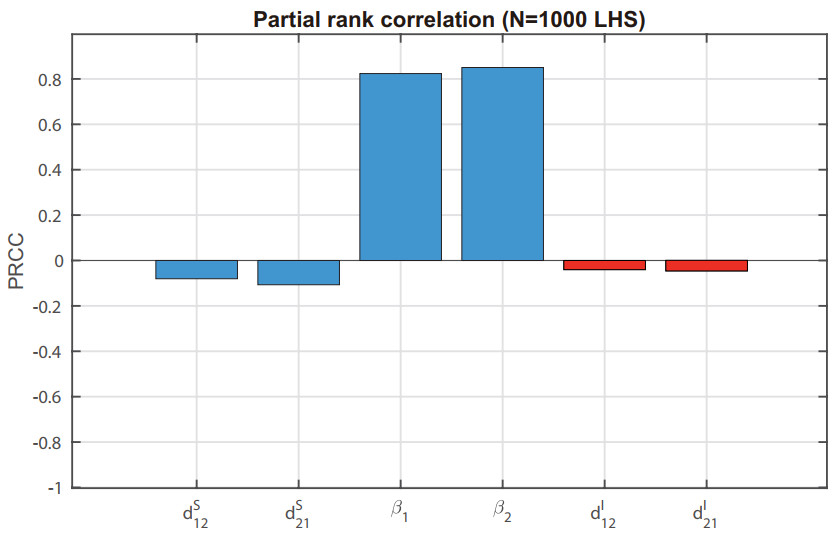
Partial rank correlation coefficients
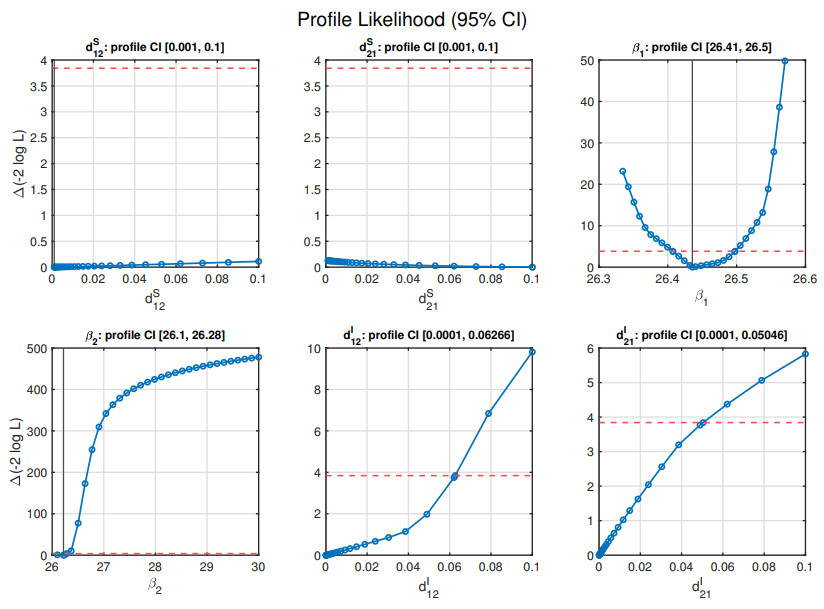
Profile likelihoods for the six fitted parameters. Blue curves: profile likelihood; red dashed line: $ \chi^2_{1, 0.95} = 3.84 $ threshold; black vertical line: MLE. The labeled interval above each panel gives the 95% profile confidence interval
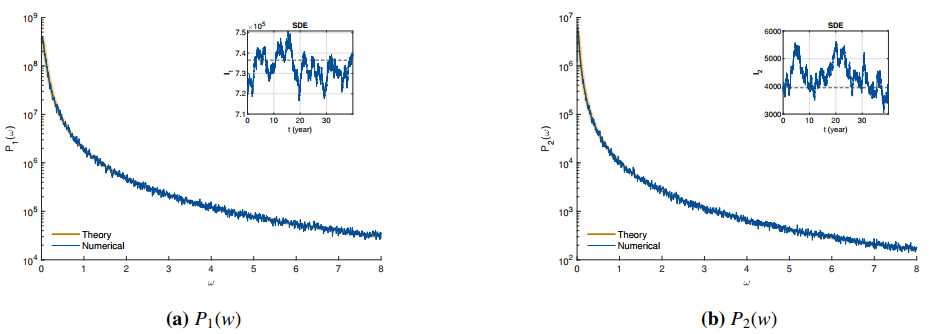
Comparison of the theoretical power spectrum with the numerical simulation results
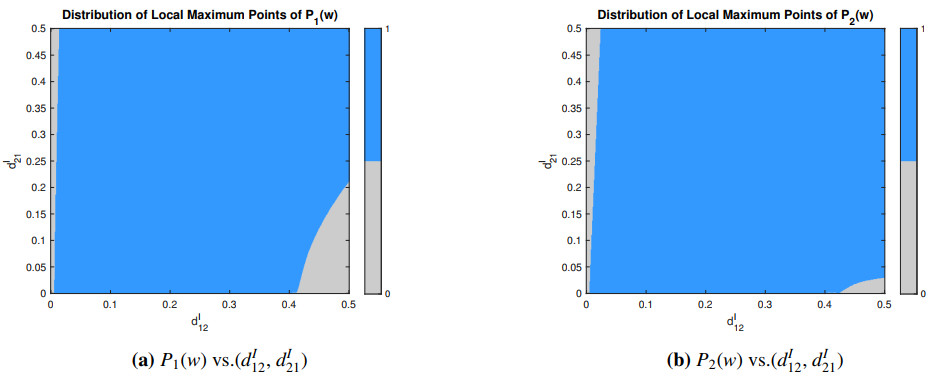
Distribution of maximum points of $ P_{1}(w) $ and $ P_{2}(w) $ in the ($ d_{12}^{I} $, $ d_{21}^{I} $) parameter plane. Gray: no local maximum; blue: one local maximum (a dominant peak is present)
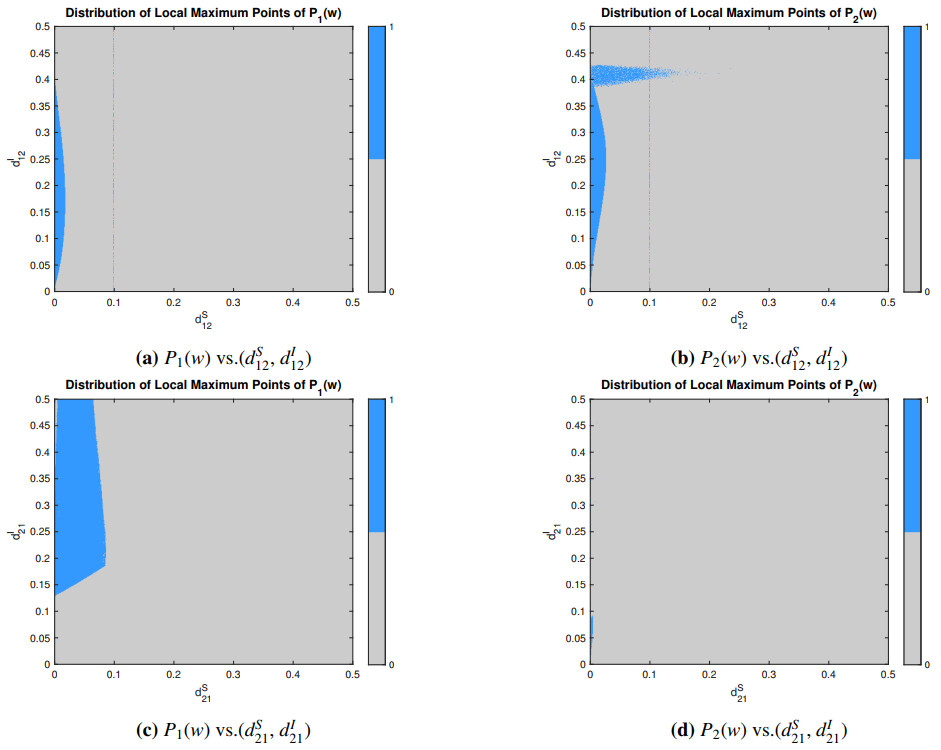
Distribution of maximum points of $ P_{1}(w) $ and $ P_{2}(w) $ in the ($ d_{12}^{S} $, $ d_{12}^{I} $) or ($ d_{21}^{S} $, $ d_{21}^{I} $) parameter plane. Gray: no local maximum; blue: one local maximum (a dominant peak is present)
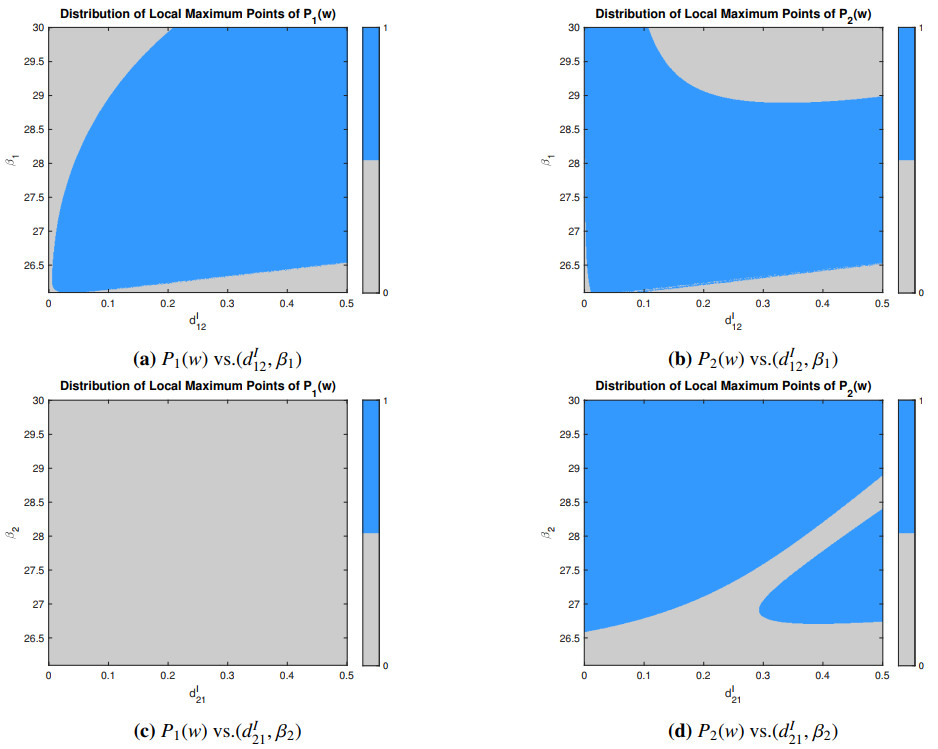
Distribution of maximum points of $ P_{1}(w) $ and $ P_{2}(w) $ in the ($ d_{12}^{I} $, $ \beta_{1} $) or ($ d_{21}^{I} $, $ \beta_{2} $) parameter plane. Gray: no local maximum; blue: one local maximum (a dominant peak is present)
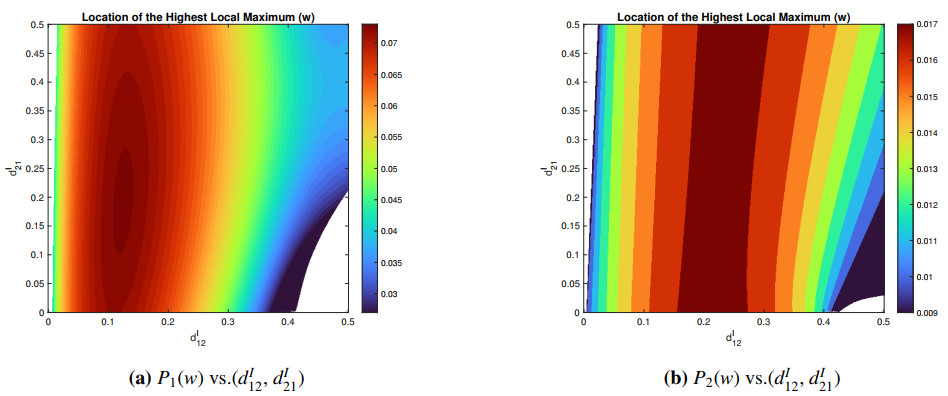
Location of the abscissa ($ w $) for $ P_{1}(w) $ and $ P_{2}(w) $ in the ($ d_{12}^{I} $, $ d_{21}^{I} $) parameter plane with one maximum. In each panel, warmer colors (red/orange) indicate larger $ \omega $ and cooler colors (blue/purple) indicate smaller $ \omega $; the color bar gives the corresponding values. The two panels use different color scales, so colors are not directly comparable between Figure 10(a) and Figure 10(b). White regions indicate parameter combinations for which no local maximum was detected; these are left blank, carry no value, and correspond to the gray regions in Figure 7
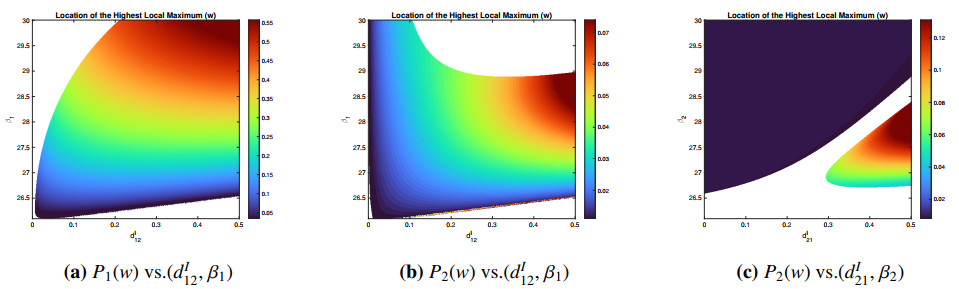
Location of the abscissa ($ w $) for $ P_{1}(w) $ and $ P_{2}(w) $ in the ($ d_{12}^{I} $, $ \beta_{1} $) or ($ d_{21}^{I} $, $ \beta_{2} $) parameter plane with one maximum. In each panel, warmer colors (red/orange) indicate larger $ \omega $ and cooler colors (blue/purple) indicate smaller $ \omega $; the color bar gives the corresponding values. The three panels use different color scales, so colors are not directly comparable between Figure 11(a), Figure 11(b), and Figure 11(c). White regions indicate parameter combinations for which no local maximum was detected; these are left blank, carry no value, and correspond to the gray regions in Figure 9(a), Figure 9(b), and Figure 9(d)




 DownLoad: