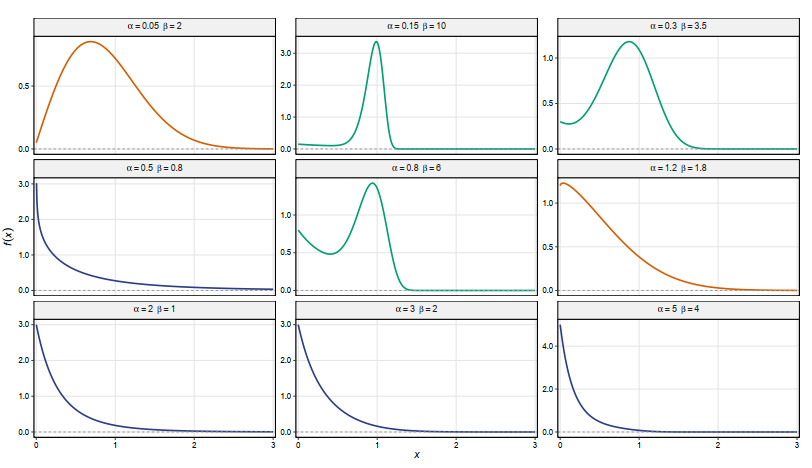
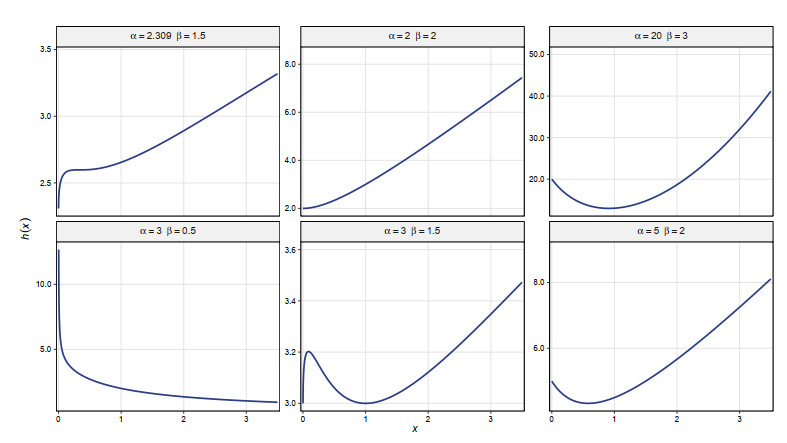
Accurately modeling complex lifetime data remains a central challenge in reliability and survival analysis, particularly when traditional models fail to capture diverse distributional behaviors. In this study, a novel and flexible distribution, referred to as the generalized Hjorth model, is introduced to address these limitations. Graphical illustrations demonstrate that the proposed model can exhibit different probability density function shapes under selected parameter configurations, while its hazard rate function accommodates a wide range of behaviors. A comprehensive theoretical investigation is conducted, including the derivation of key statistical properties and reliability measures. In particular, the shape characteristics of the hazard rate function are examined, demonstrating the ability of the model to represent increasing, decreasing, and non-monotonic hazard structures. Parameter estimation is performed using both maximum likelihood and Bayesian approaches, where the latter is implemented through Markov chain Monte Carlo techniques under the squared error loss function. The performance of the estimators is evaluated through a simulation study, showing generally improved estimation accuracy as the sample size increases under the parameter settings considered. The practical usefulness of the proposed model is further illustrated through the analysis of two real datasets. For the aircraft windshield data, the proposed model provides the closest empirical fit according to the goodness-of-fit measures, although the Hjorth model is favored by the information criteria. For the patient lifetime data, the proposed model is favored by the information criteria and provides the closest empirical fit among the considered models. Comparisons with its submodels and two competing models further demonstrate its modeling flexibility, although the extent of improvement depends on the characteristics of the data. Overall, the findings support the generalized Hjorth model as a flexible alternative for modeling lifetime data.
Citation: Mazen Nassar. A new generalization of Hjorth distribution: Theoretical properties, classical and Bayesian estimation, and applications[J]. AIMS Mathematics, 2026, 11(11): 36593-36633. doi: 10.3934/math.20261415
Accurately modeling complex lifetime data remains a central challenge in reliability and survival analysis, particularly when traditional models fail to capture diverse distributional behaviors. In this study, a novel and flexible distribution, referred to as the generalized Hjorth model, is introduced to address these limitations. Graphical illustrations demonstrate that the proposed model can exhibit different probability density function shapes under selected parameter configurations, while its hazard rate function accommodates a wide range of behaviors. A comprehensive theoretical investigation is conducted, including the derivation of key statistical properties and reliability measures. In particular, the shape characteristics of the hazard rate function are examined, demonstrating the ability of the model to represent increasing, decreasing, and non-monotonic hazard structures. Parameter estimation is performed using both maximum likelihood and Bayesian approaches, where the latter is implemented through Markov chain Monte Carlo techniques under the squared error loss function. The performance of the estimators is evaluated through a simulation study, showing generally improved estimation accuracy as the sample size increases under the parameter settings considered. The practical usefulness of the proposed model is further illustrated through the analysis of two real datasets. For the aircraft windshield data, the proposed model provides the closest empirical fit according to the goodness-of-fit measures, although the Hjorth model is favored by the information criteria. For the patient lifetime data, the proposed model is favored by the information criteria and provides the closest empirical fit among the considered models. Comparisons with its submodels and two competing models further demonstrate its modeling flexibility, although the extent of improvement depends on the characteristics of the data. Overall, the findings support the generalized Hjorth model as a flexible alternative for modeling lifetime data.

| [1] |
A. Azzalini, A class of distributions which includes the normal ones, Scand. J. Stat., 1985,171–178. |
| [2] |
G. S. Mudholkar, D. K. Srivastava, Exponentiated Weibull family for analyzing bathtub failure-rate data, IEEE T. Reliab., 42 (1993), 299–302. https://doi.org/10.1109/24.229504 doi: 10.1109/24.229504
|
| [3] |
A. W. Marshall, I. Olkin, A new method for adding a parameter to a family of distributions with application to the exponential and Weibull families, Biometrika, 84 (1997), 641-652. https://doi.org/10.1093/biomet/84.3.641 doi: 10.1093/biomet/84.3.641
|
| [4] |
A. Mahdavi, D. Kundu, A new method for generating distributions with an application to exponential distribution, Commun. Stat.-Theor. M., 46 (2017), 6543–6557. https://doi.org/10.1080/03610926.2015.1130839 doi: 10.1080/03610926.2015.1130839
|
| [5] |
N. Eugene, C. Lee, F. Famoye, Beta-normal distribution and its applications, Commun. Stat.-Theor. M., 31 (2002), 497–512. https://doi.org/10.1081/STA-120003130 doi: 10.1081/STA-120003130
|
| [6] |
A. Alzaatreh, C. Lee, F. Famoye, A new method for generating families of continuous distributions, Metron, 71 (2013), 63–79. https://doi.org/10.1007/s40300-013-0007-y doi: 10.1007/s40300-013-0007-y
|
| [7] |
C. Lee, F. Famoye, A. Y. Alzaatreh, Methods for generating families of univariate continuous distributions in the recent decades, WIRES Comput. Stat., 5 (2013), 219–238. https://doi.org/10.1002/wics.1255 doi: 10.1002/wics.1255
|
| [8] |
M. C. Jones, On families of distributions with shape parameters, Int. Stat. Rev., 83 (2015), 175–192. https://doi.org/10.1111/insr.12055 doi: 10.1111/insr.12055
|
| [9] |
M. A. Abdelaziz, G. M. Cordeiro, Z. M. Nofal, A. Z. Afify, A Comprehensive Survey of Weibull-Based Families, J. Stat. Model. Meth., 1 (2025), 98–118. https://doi.org/10.65905/zr8pgy41 doi: 10.65905/zr8pgy41
|
| [10] |
U. Hjorth, A reliability distribution with increasing, decreasing, constant and bathtub-shaped failure rates, Technometrics, 22 (1980), 99–107. |
| [11] |
F. Guess, K. H. Nam, Failure rate and mean residual life with trend changes, Asia Pac. J. Oper. Res., 15 (1998). |
| [12] |
A. S. Yadav, H. S. Bakouch, C. Chesneau, Bayesian estimation of the survival characteristics for Hjorth distribution under progressive type-Ⅱ censoring, Commun. Stat.-Simul. C., 51 (2020), 882–900. https://doi.org/10.1080/03610918.2019.1659363 doi: 10.1080/03610918.2019.1659363
|
| [13] |
N. Pushkarna, J. Saran, K. Verma, Progressively Type-Ⅱ right censored order statistics from Hjorth distribution and related inference, Statistics, Optim. Inform. Comput., 8 (2020), 481–498. https://doi.org/10.19139/soic-2310-5070-751 doi: 10.19139/soic-2310-5070-751
|
| [14] |
A. Elshahhat, M. Nassar, Bayesian survival analysis for adaptive Type-Ⅱ progressive hybrid censored Hjorth data, Computation. Stat., 36 (2021), 1965–1990. https://doi.org/10.1007/s00180-021-01065-8 doi: 10.1007/s00180-021-01065-8
|
| [15] |
R. Alotaibi, M. Nassar, A. Elshahhat, Analysis of unified hybrid Hjorth competing risk data and its application to multiple myeloma and electrical appliances, J. Math., 2025 (2025), 5089157. https://doi.org/10.1155/jom/5089157 doi: 10.1155/jom/5089157
|
| [16] |
M. Xie, C. D. Lai, Reliability analysis using an additive Weibull model with bathtub-shaped failure rate function, Reliab. Eng. Syst. Safe., 52 (1996), 87–93. https://doi.org/10.1016/0951-8320(95)00149-2 doi: 10.1016/0951-8320(95)00149-2
|
| [17] |
F. K. Wang, A new model with bathtub-shaped failure rate using an additive Burr XII distribution, Reliab. Eng. Syst. Safe., 70 (2000), 305–312. https://doi.org/10.1016/S0951-8320(00)00066-1 doi: 10.1016/S0951-8320(00)00066-1
|
| [18] |
B. Singh, An additive Perks–Weibull model with Bathtub-shaped hazard rate function, Commun. Math. Stat., 4 (2016), 473–493. https://doi.org/10.1007/s40304-016-0096-z doi: 10.1007/s40304-016-0096-z
|
| [19] |
L. C. Méndez-González, L. A. Rodríguez-Picón, I. J. C. Pérez-Olguín, L. R. Vidal Portilla, An additive Chen distribution with applications to lifetime data, Axioms, 12 (2023), 118. https://doi.org/10.3390/axioms12020118 |
| [20] |
M. G. M. Ghazal, Hamiltonian Monte Carlo–based inference for the flexible exponential power–Weibull distribution with applications in reliability analysis, AIMS Math., 11 (2026), 11659–11705. https://doi.org/10.3934/math.2026481 doi: 10.3934/math.2026481
|
| [21] |
A. J. Jr Hallinan, A review of the Weibull distribution, J. Qual. Technol., 25 (1993), 85–93. https://doi.org/10.1080/00224065.1993.11979431 doi: 10.1080/00224065.1993.11979431
|
| [22] |
H. Pham, C. D. Lai, On recent generalizations of the Weibull distribution, IEEE T. Reliab., 56 (2007), 454–458. https://doi.org/10.1109/TR.2007.903352 doi: 10.1109/TR.2007.903352
|
| [23] |
M. H. Tahir, G. M. Cordeiro, M. Mansoor, M. Zubair, The Weibull-Lomax distribution: Properties and applications, Hacet. J. Math. Stat., 44 (2015), 455–474. |
| [24] |
M. Bebbington, C. D. Lai, R. Zitikis, A flexible Weibull extension, Reliab. Eng. Syst. Safe., 92 (2007), 719–726. https://doi.org/10.1016/j.ress.2006.03.004 doi: 10.1016/j.ress.2006.03.004
|
| [25] |
T. Liu, R. Xue, A convergent multi-step efficient iteration method to solve nonlinear equation systems, J. Appl. Math. Comput., 71 (2025), 2571–2588. https://doi.org/10.1007/s12190-024-02324-9 doi: 10.1007/s12190-024-02324-9
|
| [26] |
N. Bouguila, D. Ziou, E. Monga, Practical Bayesian estimation of a finite beta mixture through Gibbs sampling and its applications, Stat. Comput., 16 (2006), 215–225. https://doi.org/10.1007/s11222-006-8451-7 doi: 10.1007/s11222-006-8451-7
|
| [27] |
M. J. Zyphur, F. L. Oswald, Bayesian estimation and inference: A user's guide, J. Manage., 41 (2015), 390–420. |
| [28] |
N. Metropolis, A. W. Rosenbluth, M. N. Rosenbluth, A. H. Teller, E. Teller, Equation of state calculations by fast computing machines, J. Chem. Phys., 21 (1953), 1087–1092. |
| [29] |
W. K. Hastings, Monte Carlo sampling methods using Markov chains and their applications, Biometrika, 57 (1970), 97–109. https://doi.org/10.1093/biomet/57.1.97 doi: 10.1093/biomet/57.1.97
|
| [30] |
D. P. Murthy, M. Xie, R. Jiang, Weibull models, John Wiley & Sons, 2004. |
| [31] |
A. M. Abouammoh, S. A. Abdulghani, I. S. Qamber, On partial orderings and testing of new better than renewal used classes, Reliab. Eng. Syst. Safe., 43 (1994), 37–41. https://doi.org/10.1016/0951-8320(94)90094-9 doi: 10.1016/0951-8320(94)90094-9
|
| [32] |
S. Alhidairah, F. M. A. Alam, M. Nassar, A new competing risks model with applications to blood cancer data, J. Radiat. Res. Appl. Sc., 17 (2024), 101001. 10.1016/j.jrras.2024.101001 doi: 10.1016/j.jrras.2024.101001
|
| [33] |
F. J. Rubio, J. A. Espindola, J. A. Montoya, On near‐redundancy and identifiability of parametric hazard regression models under censoring, Biometrical J., 65 (2023), 2300006. https://doi.org/10.1002/bimj.202300006 doi: 10.1002/bimj.202300006
|
Figures(21) / Tables(15)

Mazen Nassar. A new generalization of Hjorth distribution: Theoretical properties, classical and Bayesian estimation, and applications[J]. AIMS Mathematics, 2026, 11(11): 36593-36633. doi: 10.3934/math.20261415

Illustrative shapes of the GHj PDF under different parameter configurations with $ \lambda = 1 $
Illustrative shapes of the GHj HRF under different parameter configurations with $ \lambda = 1 $
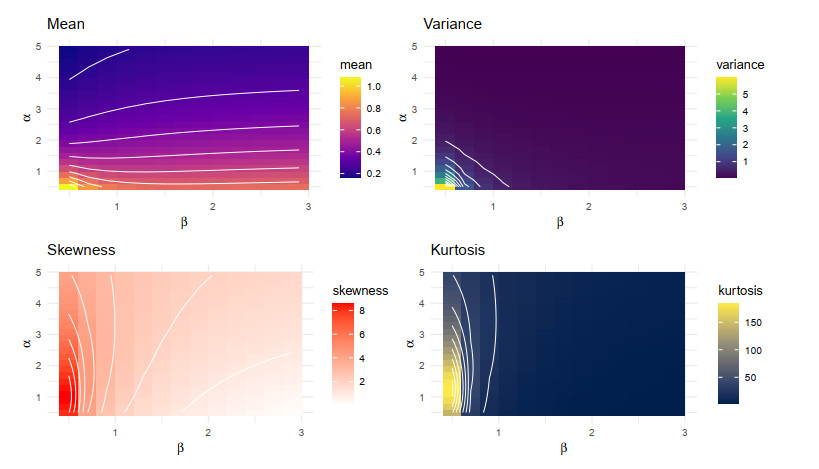
Surface plots of the mean, variance, skewness, and kurtosis of the GHj distribution as functions of the shape parameters $ \alpha $ and $ \beta $, with $ \lambda = 1 $
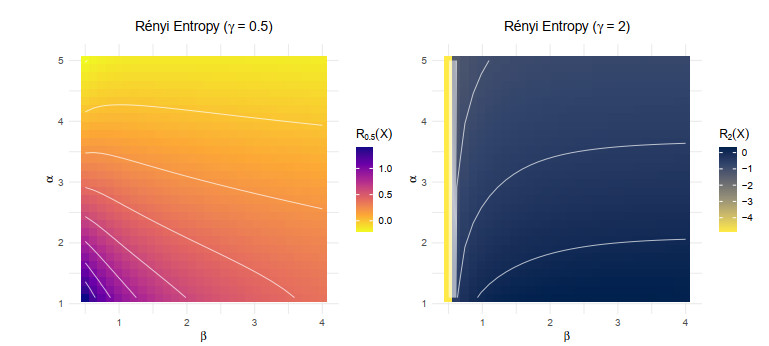
Rényi entropy of the GHj distribution for $ \gamma = 0.5 $ and $ \gamma = 2 $ as functions of the shape parameters $ \alpha $ and $ \beta $, with $ \lambda = 1 $
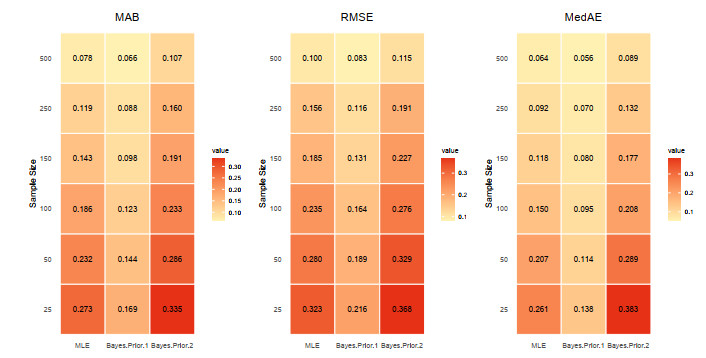
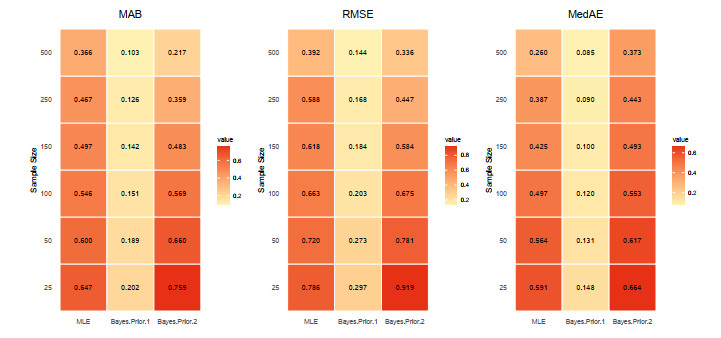
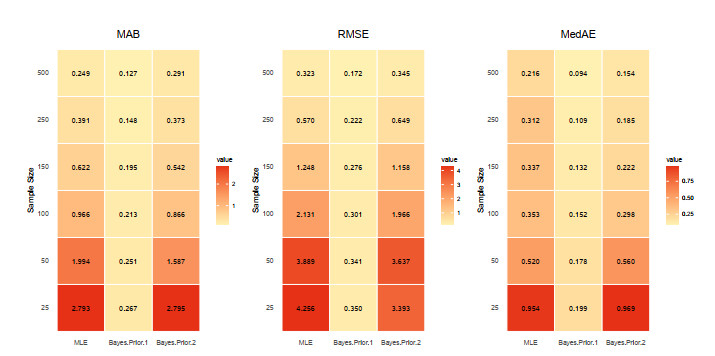
Heatmap representation of MAB, RMSE, and MedAE for the parameter $ \lambda $ under Set Ⅰ across different sample sizes and estimation methods
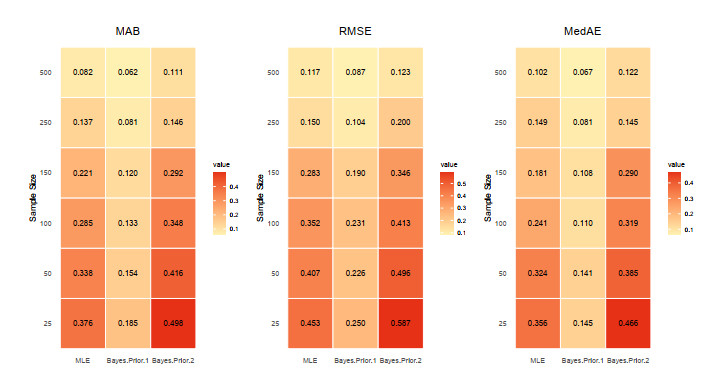
Heatmap representation of MAB, RMSE, and MedAE for the parameter $ \alpha $ under Set Ⅰ across different sample sizes and estimation methods
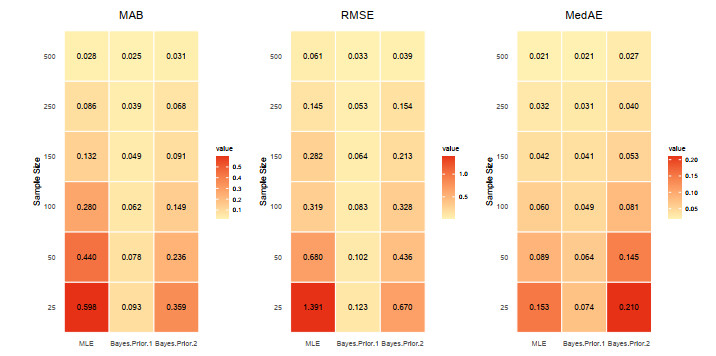
Heatmap representation of MAB, RMSE, and MedAE for the parameter $ \beta $ under Set Ⅰ across different sample sizes and estimation methods
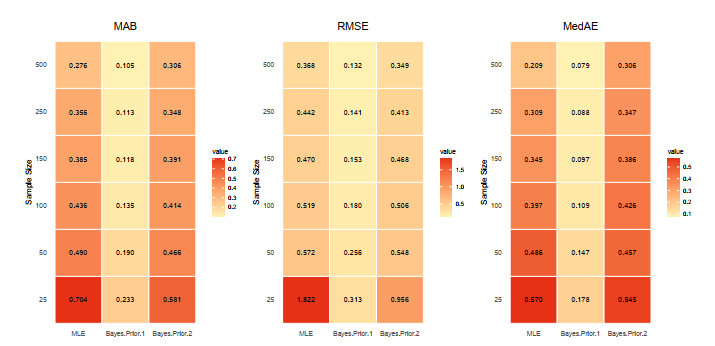
Heatmap representation of MAB, RMSE, and MedAE for the parameter $ \lambda $ under Set Ⅱ across different sample sizes and estimation methods
Heatmap representation of MAB, RMSE, and MedAE for the parameter $ \alpha $ under Set Ⅱ across different sample sizes and estimation methods
Heatmap representation of MAB, RMSE, and MedAE for the parameter $ \beta $ under Set Ⅱ across different sample sizes and estimation methods
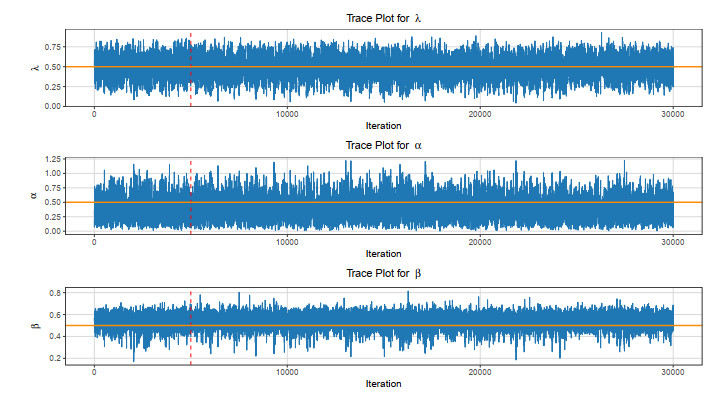
Trace plots for the MCMC samples of the parameters $ \lambda $, $ \alpha $, and $ \beta $ under Prior 1 based on Set Ⅰ
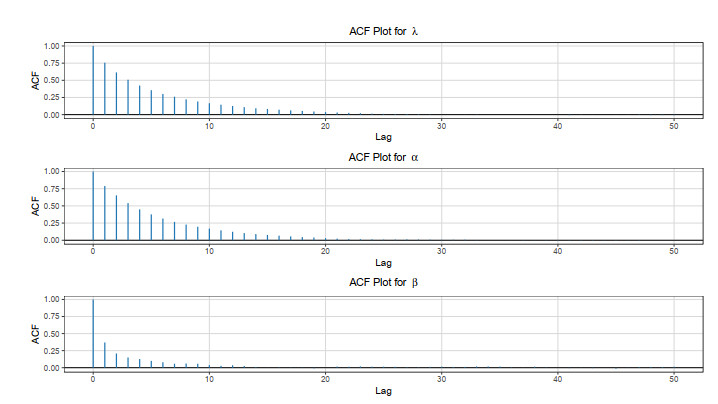
Autocorrelation function plots for the MCMC samples of the parameters $ \lambda $, $ \alpha $, and $ \beta $ under Prior 1 based on Set Ⅰ
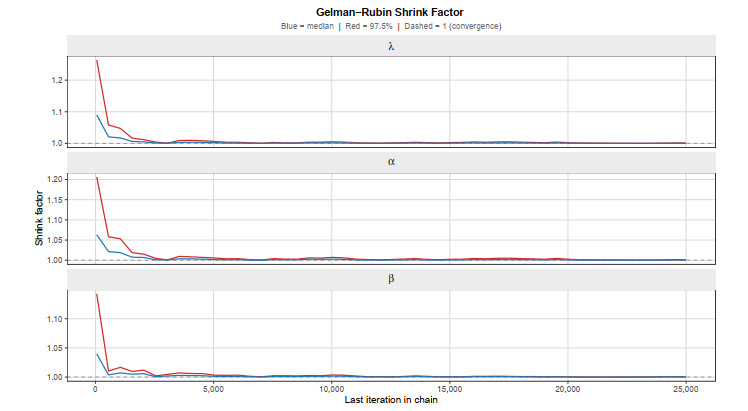
Gelman–Rubin shrink factor plots for the parameters $ \lambda $, $ \alpha $, and $ \beta $ under Prior 1 based on Set Ⅰ
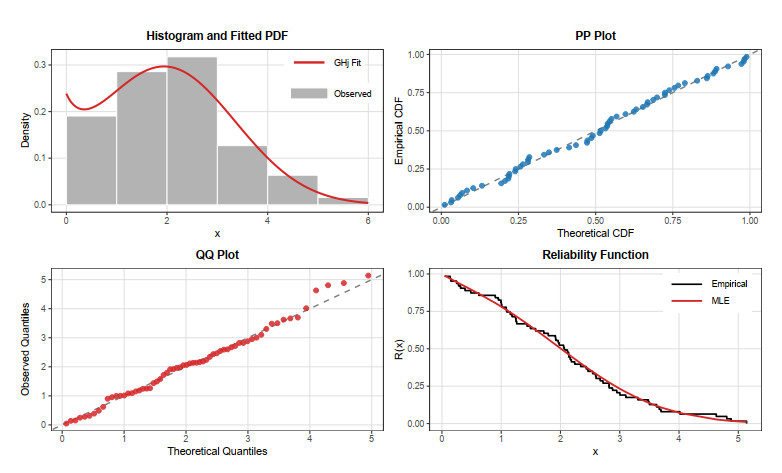
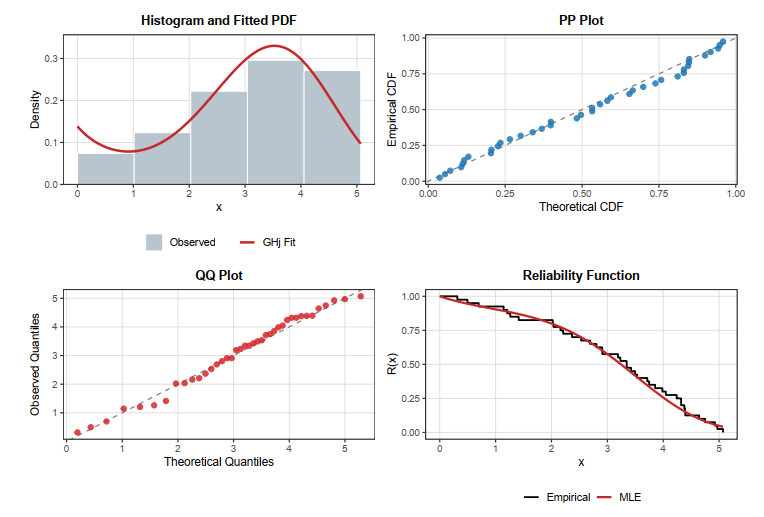
Graphical assessment of the GHj model's fit for the aircraft windshield data
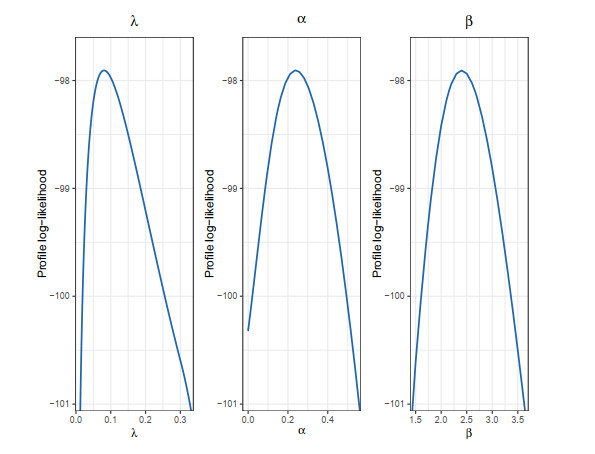
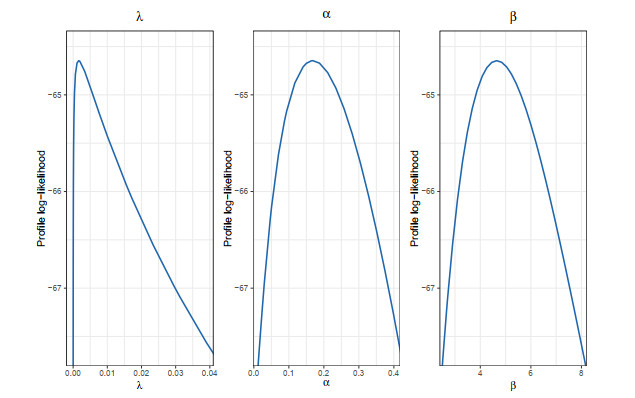
Profile log-likelihood curves for the GHj parameters based on the aircraft windshield data
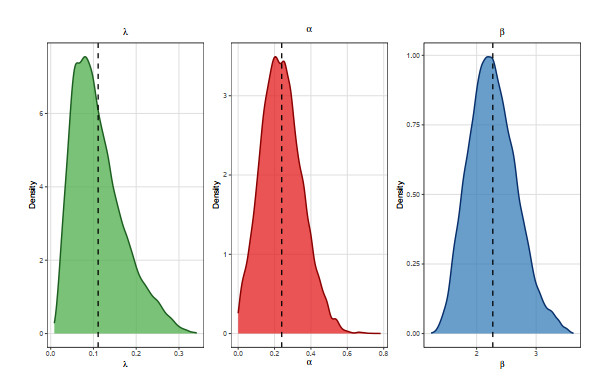
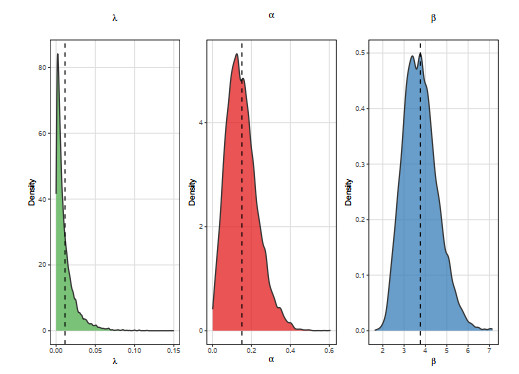
Posterior density estimates of $ \lambda $, $ \alpha $, and $ \beta $ for the aircraft windshield data. The dashed vertical lines indicate the corresponding posterior means
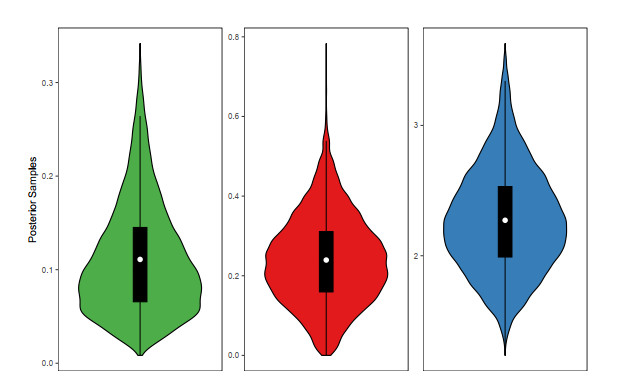
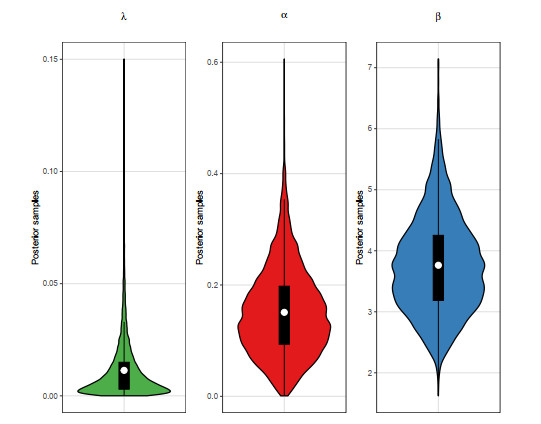
Violin plots of $ \lambda $ (left), $ \alpha $ (middle), and $ \beta $ (right) for the aircraft windshield data. The white dots represent the posterior means
Graphical assessment of the GHj model fit for the patient lifetime data
Profile log-likelihood curves for the GHj parameters based on the patient lifetime data
Posterior density estimates of $ \lambda $, $ \alpha $, and $ \beta $ for the patient lifetime data. The dashed vertical lines indicate the corresponding posterior means
Violin plots of $ \lambda $ (left), $ \alpha $ (middle), and $ \beta $ (right) for the patients' lifetime data. The white dots represent the posterior means




 DownLoad: