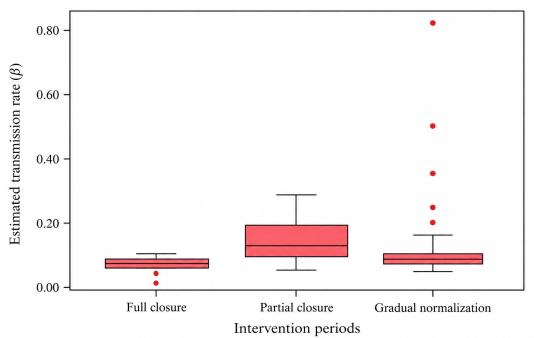
This study aims to investigate temporal changes in the transmission dynamics of the COVID-19 epidemic and to examine how these changes are associated with government intervention periods. For this purpose, a normalized dynamic SIR model is considered in which the recovery rate, $ \gamma $, is set to $ 1/14 $ day-1 in the primary analysis, while the transmission rate, $ \beta $, is allowed to vary across the periods identified in the analysis rather than being assumed constant. Changes in the case series are identified using change-point analysis, and the resulting model is solved using the Taylor collocation method. The estimated transmission rates are compared across the full-closure, partial-closure, and gradual-normalization periods using non-parametric statistical methods. The Kruskal–Wallis test revealed a statistically significant overall difference in the estimated transmission rates among the three intervention groups ($ H(2) = 14.353 $, $ p = 0.001 $). Subsequent pairwise comparisons using Dunn's post-hoc test with Bonferroni correction indicated significant differences between the full-closure and partial-closure periods and between the full-closure and gradual-normalization periods, whereas the difference between the partial-closure and gradual-normalization periods was not statistically significant. Sensitivity analyses using alternative recovery-rate assumptions ($ \gamma = 1/10 $ and $ \gamma = 1/20 $) yielded the same inferential pattern. These findings indicate that the estimated transmission rates varied across the intervention periods and illustrate the potential of the proposed dynamic SIR framework for characterizing temporal transmission patterns under changing intervention conditions.
Citation: Serpil Ünal, Elçin Çelik, Deniz Uçar. A dynamic SIR epidemic model with the Taylor collocation method: Analysis of transmission dynamics under intervention changes[J]. AIMS Mathematics, 2026, 11(11): 36379-36408. doi: 10.3934/math.20261408
This study aims to investigate temporal changes in the transmission dynamics of the COVID-19 epidemic and to examine how these changes are associated with government intervention periods. For this purpose, a normalized dynamic SIR model is considered in which the recovery rate, $ \gamma $, is set to $ 1/14 $ day-1 in the primary analysis, while the transmission rate, $ \beta $, is allowed to vary across the periods identified in the analysis rather than being assumed constant. Changes in the case series are identified using change-point analysis, and the resulting model is solved using the Taylor collocation method. The estimated transmission rates are compared across the full-closure, partial-closure, and gradual-normalization periods using non-parametric statistical methods. The Kruskal–Wallis test revealed a statistically significant overall difference in the estimated transmission rates among the three intervention groups ($ H(2) = 14.353 $, $ p = 0.001 $). Subsequent pairwise comparisons using Dunn's post-hoc test with Bonferroni correction indicated significant differences between the full-closure and partial-closure periods and between the full-closure and gradual-normalization periods, whereas the difference between the partial-closure and gradual-normalization periods was not statistically significant. Sensitivity analyses using alternative recovery-rate assumptions ($ \gamma = 1/10 $ and $ \gamma = 1/20 $) yielded the same inferential pattern. These findings indicate that the estimated transmission rates varied across the intervention periods and illustrate the potential of the proposed dynamic SIR framework for characterizing temporal transmission patterns under changing intervention conditions.

| [1] |
J. M. Last, A dictionary of epidemiology, 2 Eds., Oxford University Press, 1988. |
| [2] |
W. O. Kermack, A. G. McKendrick, A contribution to the mathematical theory of epidemics, Proc. R. Soc. Lond. A, 115 (1927), 700–721. http://dx.doi.org/10.1098/rspa.1927.0118 doi: 10.1098/rspa.1927.0118
|
| [3] |
W. O. Kermack, A. G. McKendrick, Contributions to the mathematical theory of epidemics. Ⅱ. The problem of endemicity, Proc. Roy. Soc. Lond. A, 138 (1932), 55–83. http://dx.doi.org/10.1098/rspa.1932.0171 doi: 10.1098/rspa.1932.0171
|
| [4] |
W. O. Kermack, A. G. McKendrick, Contributions to the mathematical theory of epidemics. Ⅲ. Further studies of the problem of endemicity, Proc. Roy. Soc. Lond. A, 141 (1933), 94–122. http://dx.doi.org/10.1098/rspa.1933.0106 doi: 10.1098/rspa.1933.0106
|
| [5] |
F. C. Hoppensteadt, Mathematical methods of population biology, Cambridge: Cambridge University Press, 2010. http://dx.doi.org/10.1017/CBO9780511624087 |
| [6] |
F. Shakeri, M. Dehghan, Solution of a model describing biological species living together using the variational iteration method, Math. Comput. Model., 48 (2008), 685–699. https://dx.doi.org/10.1016/j.mcm.2007.11.012 doi: 10.1016/j.mcm.2007.11.012
|
| [7] |
F. Shakeri, M. Dehghan, Solution of delay differential equations via a homotopy perturbation method, Math. Comput. Model., 48 (2008), 486–498. http://dx.doi.org/10.1016/j.mcm.2007.09.016 doi: 10.1016/j.mcm.2007.09.016
|
| [8] |
F. Shakeri, M. Dehghan, Application of the decomposition method of Adomian for solving the pantograph equation of order $m$, Z. Naturforsch. A, 65 (2010), 453–460. http://dx.doi.org/10.1515/zna-2010-0510 doi: 10.1515/zna-2010-0510
|
| [9] |
D. J. Evans, K. R. Raslan, The Adomian decomposition method for solving delay differential equation, Int. J. Comput. Math., 82 (2005), 49–54. http://dx.doi.org/10.1080/00207160412331286815 doi: 10.1080/00207160412331286815
|
| [10] |
A. Saadatmandi, M. Dehghan, Variational iteration method for solving a generalized pantograph equation, Comput. Math. Appl., 58 (2009), 2190–2196. http://dx.doi.org/10.1016/j.camwa.2009.03.017 doi: 10.1016/j.camwa.2009.03.017
|
| [11] |
F. S. Akinboro, S. Alao, F. O. Akinpelu, Numerical solution of SIR model using differential transformation method and variational iteration method, Gen. Math. Notes, 22 (2014), 82–92. |
| [12] |
D. Uçar, E. Çelik, Analysis of COVID 19 disease with SIR model and Taylor matrix method, AIMS Math., 7 (2022), 11188–11200. http://dx.doi.org/10.3934/math.2022626 doi: 10.3934/math.2022626
|
| [13] |
B. Shulgin, L. Stone, Z. Agur, Pulse vaccination strategy in the SIR epidemic model, Bull. Math. Biol., 60 (1998), 1123–1148. http://dx.doi.org/10.1016/S0092-8240(98)90005-2 doi: 10.1016/S0092-8240(98)90005-2
|
| [14] |
M. C. Schuette, H. W. Hethcote, Modeling of the effects of varicella vaccination programs on the incidence of chickenpox and shingles, Bull. Math. Biol., 61 (1999), 1031–1064. http://dx.doi.org/10.1006/bulm.1999.0126 doi: 10.1006/bulm.1999.0126
|
| [15] |
D. J. Daley, J. Gani, Epidemic modelling: An introduction, Cambridge: Cambridge University Press, 2009. http://dx.doi.org/10.1017/CBO9780511608834 |
| [16] |
M. Iannelli, The mathematical modeling of epidemics, In: Summer school on mathematical models in life science: Theory and simulation, 2005. |
| [17] |
M. Rafei, D. Ganji, H. Daniali, Solution of the epidemic model by homotopy perturbation method, Appl. Math. Comput., 187 (2007), 1056–1062. http://dx.doi.org/10.1016/j.amc.2006.09.019 doi: 10.1016/j.amc.2006.09.019
|
| [18] |
S. Ahmetolan, A. H. Bilge, A. Demirci, A. Peker-Dobie, O. Ergonul, What can we estimate from fatality and infectious case data using the Susceptible-Infected-Removed (SIR) model? A case study of COVID-19 pandemic, Front. Med., 7 (2020), 556366. http://dx.doi.org/10.3389/fmed.2020.556366 doi: 10.3389/fmed.2020.556366
|
| [19] |
U. Nguemdjo, F. Meno, A. Dongfack, B. Ventelou, Simulating the progression of the COVID-19 disease in Cameroon using SIR models, PLoS ONE, 15 (2020), e0237832. http://dx.doi.org/10.1371/journal.pone.0237832 doi: 10.1371/journal.pone.0237832
|
| [20] |
E. B. Postnikov, Estimation of COVID-19 dynamics "On a back-of-envelope": Does the simplest SIR model provide quantitative parameters and predictions?, Chaos Soliton. Fract., 135 (2020), 109841. http://dx.doi.org/10.1016/j.chaos.2020.109841 doi: 10.1016/j.chaos.2020.109841
|
| [21] |
N. R. Record, A. Pershing, A note on the effects of epidemic forecasts on epidemic dynamics, PeerJ, 8 (2020), e9649. http://dx.doi.org/10.7717/peerj.9649 doi: 10.7717/peerj.9649
|
| [22] |
N. S. Barlow, S. J. Weinstein, Accurate closed-form solution of the SIR epidemic model, Physica D, 408 (2020), 132540. http://dx.doi.org/10.1016/j.physd.2020.132540 doi: 10.1016/j.physd.2020.132540
|
| [23] |
N. A. Kudryashov, M. A. Chmykhov, M. Vigdorowitsch, Analytical features of the SIR model and their applications to COVID-19, Appl. Math. Model., 90 (2021), 466–473. http://dx.doi.org/10.1016/j.apm.2020.08.057 doi: 10.1016/j.apm.2020.08.057
|
| [24] |
N. A. Kudryashov, M. A. Chmykhov, M. Vigdorowitsch, An estimative (warning) model for recognition of pandemic nature of virus infections, Int. J. Nonlinear Sci. Numer. Simul., 24 (2023), 213–226. http://dx.doi.org/10.1515/ijnsns-2020-0154 doi: 10.1515/ijnsns-2020-0154
|
| [25] |
A. Spannaus, T. Papamarkou, S. Erwin, J. B. Christian, Inferring the spread of COVID-19: The role of time-varying reporting rate in epidemiological modelling, Sci. Rep., 12 (2022), 10761. https://doi.org/10.1038/s41598-022-14979-0 doi: 10.1038/s41598-022-14979-0
|
| [26] |
D. A. Buch, J. E. Johndrow, D. B. Dunson, Explaining transmission rate variations and forecasting epidemic spread in multiple regions with a semiparametric mixed effects SIR model, Biometrics, 79 (2023), 2987–2997. https://doi.org/10.1111/biom.13901 doi: 10.1111/biom.13901
|
| [27] |
R. Mbuvha, T. Marwala, Bayesian inference of COVID-19 spreading rates in South Africa, PLoS ONE, 15 (2020), e0237126. https://doi.org/10.1371/journal.pone.0237126 doi: 10.1371/journal.pone.0237126
|
| [28] |
N. Güzey, Türkiye'deki COVID-19 yayılımının SIR temelli modellenmesinde RSS yöntemi ile parametre kestirimi, GÜFBED, 11 (2021), 956–963. https://doi.org/10.17714/gumusfenbil.757291 doi: 10.17714/gumusfenbil.757291
|
| [29] |
H. Sjödin, A. Wilder-Smith, S. Osman, Z. Farooq, J. Rocklöv, Only strict quarantine measures can curb the coronavirus disease (COVID-19) outbreak in Italy, 2020, Eurosurveillance, 25 (2020), 2000280. http://dx.doi.org/10.2807/1560-7917.ES.2020.25.13.2000280 doi: 10.2807/1560-7917.ES.2020.25.13.2000280
|
| [30] |
A. S. Alshomrani, M. Z. Ullah, D. Baleanu, Caputo SIR model for COVID-19 under optimized fractional order, Adv. Differ. Equ., 2021 (2021), 185. http://dx.doi.org/10.1186/s13662-021-03345-5 doi: 10.1186/s13662-021-03345-5
|
| [31] |
M. Sezer, A method for the approximate solution of the second-order linear differential equations in terms of Taylor polynomials, Int. J. Math. Educ. Sci. Technol., 27 (1996), 821–834. http://dx.doi.org/10.1080/0020739960270606 doi: 10.1080/0020739960270606
|
| [32] |
M. Sezer, A. Karamete, M. Gülsu, Taylor polynomial solutions of systems of linear differential equations with variable coefficients, Int. J. Comput. Math., 82 (2005), 755–764. http://dx.doi.org/10.1080/00207160512331323336 doi: 10.1080/00207160512331323336
|
| [33] |
W. A. Taylor, Change-point analysis: A powerful new tool for detecting changes, Taylor Enterprises, Inc., 2012. |
| [34] |
G. Duan, H. Gong, B. Chen, X. Li, X. Pan, M. Shi, et al., Spatiotemporal heterogeneity of land subsidence in Beijing, Sci. Rep., 12 (2022), 15120. https://doi.org/10.1038/s41598-022-16674-6 doi: 10.1038/s41598-022-16674-6
|
| [35] |
W. A. Taylor, Change-point analyzer: Advanced options dialog box, Taylor Enterprises, Inc. Available from: https://variation.com/wp-content/change-point_analyzer_help/hs50.htm |
| [36] |
A. Dinno, Nonparametric pairwise multiple comparisons in independent groups using Dunn's test, Stata J., 15 (2015), 292–300. https://doi.org/10.1177/1536867X1501500117 doi: 10.1177/1536867X1501500117
|
| [37] |
S. Genç, M. I. Soysal, Parametrik ve parametrik olmayan çoklu karşılaştırma testleri, Black Sea J. Eng. Sci., 1 (2018), 18–27. |
| [38] |
Republic of Türkiye Ministry of Health, COVID-19 general coronavirus table, Available from: https://covid19.saglik.gov.tr/TR-66935/genel-koronavirus-tablosu.html |
| [39] |
J. Hu, W. Liang, H. Dai, Y. Bao, Efficient empirical likelihood inference for recovery rate of COVID-19 under double-censoring, J. Stat. Plann. Inference, 221 (2022), 172–187. https://doi.org/10.1016/j.jspi.2022.04.005 doi: 10.1016/j.jspi.2022.04.005
|
Figures(6) / Tables(10)

Serpil Ünal, Elçin Çelik, Deniz Uçar. A dynamic SIR epidemic model with the Taylor collocation method: Analysis of transmission dynamics under intervention changes[J]. AIMS Mathematics, 2026, 11(11): 36379-36408. doi: 10.3934/math.20261408

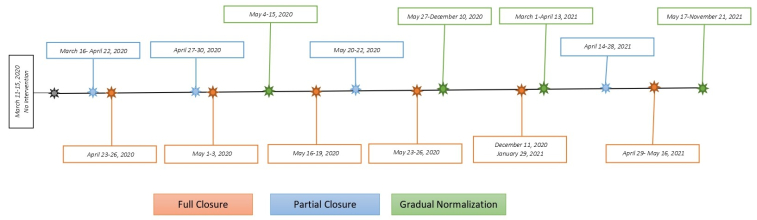
Timeline of the government interventions considered in the study
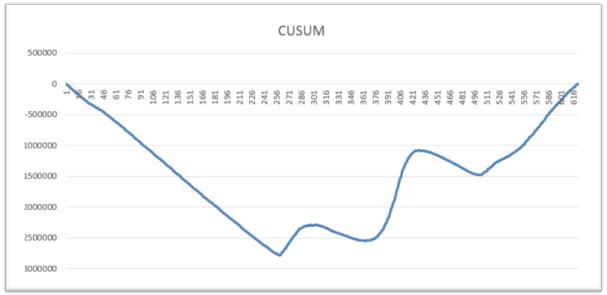
CUSUM chart for the COVID-19 case series
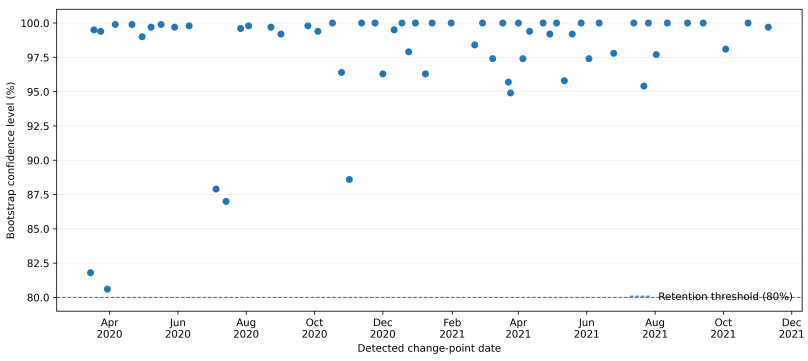
Detected change points and their corresponding bootstrap confidence levels. The dashed horizontal line indicates the 80% bootstrap confidence threshold used as the criterion for retaining detected change points
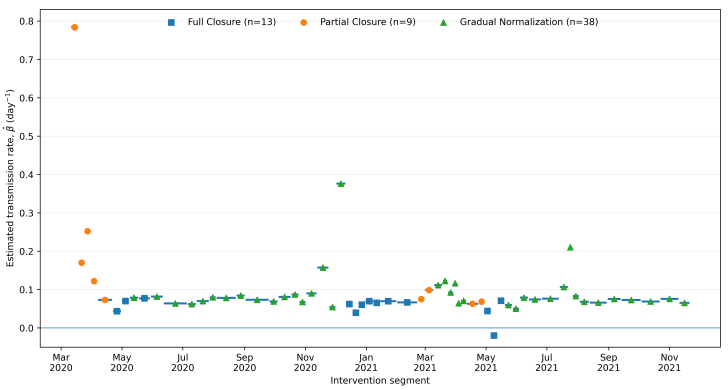
Estimated transmission rates across intervention segments. Horizontal segments indicate the time interval over which each estimated transmission rate was assumed constant
Box plots of the estimated transmission rates across the intervention groups
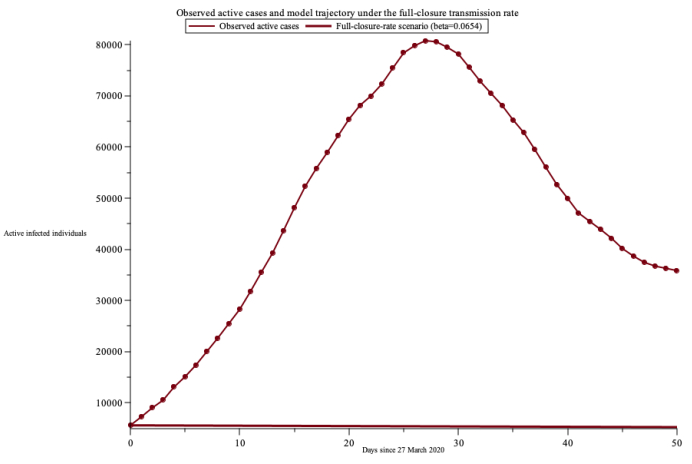
Observed active cases and the hypothetical epidemic trajectory obtained under the representative full-closure transmission rate $ \beta = 0.0654 $ with $ \gamma = 1/14 $. The simulation starts on 27 March 2020 and covers a 50-day period




 DownLoad: