Negative binomial (NB) regression is the standard model for overdispersed healthcare counts, but it usually assumes a common negative-binomial shape parameter, and hence a common level of extra-Poisson dispersion, for all individuals. This paper develops a score test of this assumption against a log-linear dispersion regression. The test requires only the constant-dispersion fit. The model is identified whether or not the dispersion covariates overlap with the mean covariates, and the expected information is block diagonal between the mean and dispersion parameters. As a result, the score statistic has a closed form and is exactly invariant to the dispersion link. It is asymptotically chi-squared under the null hypothesis, and under local alternatives its noncentrality depends only on a weighted variance of the dispersion covariates. In a Monte Carlo study, the expected-information version keeps its empirical size between 0.03 and 0.06 from $ n = 50 $ upward, whereas the observed-information and likelihood-ratio versions over-reject in small samples. The method is applied to 14,732 adults in the 2023 Medical Expenditure Panel Survey. Constant dispersion is rejected under all specifications, including design-based tests, and varying dispersion improves cross-validated predictive scores. Complementary diagnostics show that an apparently large insurance effect on dispersion is explained by the effect of insurance on the mean, by excess zeros, and by the choice of variance function. What remains robust is a modest income gradient in dispersion.
Citation: Mohieddine Rahmouni. Covariate-varying dispersion in negative binomial regression: a score-test diagnostic with an application to healthcare utilization[J]. AIMS Mathematics, 2026, 11(10): 35469-35501. doi: 10.3934/math.20261376
Negative binomial (NB) regression is the standard model for overdispersed healthcare counts, but it usually assumes a common negative-binomial shape parameter, and hence a common level of extra-Poisson dispersion, for all individuals. This paper develops a score test of this assumption against a log-linear dispersion regression. The test requires only the constant-dispersion fit. The model is identified whether or not the dispersion covariates overlap with the mean covariates, and the expected information is block diagonal between the mean and dispersion parameters. As a result, the score statistic has a closed form and is exactly invariant to the dispersion link. It is asymptotically chi-squared under the null hypothesis, and under local alternatives its noncentrality depends only on a weighted variance of the dispersion covariates. In a Monte Carlo study, the expected-information version keeps its empirical size between 0.03 and 0.06 from $ n = 50 $ upward, whereas the observed-information and likelihood-ratio versions over-reject in small samples. The method is applied to 14,732 adults in the 2023 Medical Expenditure Panel Survey. Constant dispersion is rejected under all specifications, including design-based tests, and varying dispersion improves cross-validated predictive scores. Complementary diagnostics show that an apparently large insurance effect on dispersion is explained by the effect of insurance on the mean, by excess zeros, and by the choice of variance function. What remains robust is a modest income gradient in dispersion.

| [1] |
A. C. Cameron, P. K. Trivedi, Regression analysis of count data, Cambridge: Cambridge University Press, 2013. https://doi.org/10.1017/CBO9781139013567 |
| [2] |
J. M. Hilbe, Negative binomial regression, Cambridge: Cambridge University Press, 2011. https://doi.org/10.1017/CBO9780511973420 |
| [3] |
G. K. Smyth, Generalized linear models with varying dispersion, J. R. Stat. Soc. B, 51 (1989), 47–60. https://doi.org/10.1111/j.2517-6161.1989.tb01747.x doi: 10.1111/j.2517-6161.1989.tb01747.x
|
| [4] |
R. A. Rigby, D. M. Stasinopoulos, Generalized additive models for location, scale and shape, J. R. Stat. Soc. C, 54 (2005), 507–554. https://doi.org/10.1111/j.1467-9876.2005.00510.x doi: 10.1111/j.1467-9876.2005.00510.x
|
| [5] |
G. K. Smyth, A. P. Verbyla, Adjusted likelihood methods for modelling dispersion in generalized linear models, Environmetrics, 10 (1999), 695–709. |
| [6] |
T. J. Cole, P. J. Green, Smoothing reference centile curves: the LMS method and penalized likelihood, Stat. Med., 11 (1992), 1305–1319. https://doi.org/10.1002/sim.4780111005 doi: 10.1002/sim.4780111005
|
| [7] |
D. M. Stasinopoulos, R. A. Rigby, Generalized additive models for location scale and shape (GAMLSS) in R, J. Stat. Softw., 23 (2007), 1–46. https://doi.org/10.18637/jss.v023.i07 doi: 10.18637/jss.v023.i07
|
| [8] |
D. M. Stasinopoulos, R. A. Rigby, G. Z. Heller, V. Voudouris, F. De Bastiani, Flexible regression and smoothing: using GAMLSS in R, Boca Raton: Chapman and Hall/CRC, 2017. https://doi.org/10.1201/b21973 |
| [9] |
T. Kneib, A. Silbersdorff, B. Säfken, Rage against the mean—a review of distributional regression approaches, Econom. Stat., 26 (2023), 99–123. https://doi.org/10.1016/j.ecosta.2021.07.006 doi: 10.1016/j.ecosta.2021.07.006
|
| [10] |
A. C. Cameron, P. K. Trivedi, Econometric models based on count data: comparisons and applications of some estimators and tests, J. Appl. Econom., 1 (1986), 29–53. https://doi.org/10.1002/jae.3950010104 doi: 10.1002/jae.3950010104
|
| [11] |
W. Greene, Functional forms for the negative binomial model for count data, Econ. Lett., 99 (2008), 585–590. https://doi.org/10.1016/j.econlet.2007.10.015 doi: 10.1016/j.econlet.2007.10.015
|
| [12] |
C. B. Dean, Testing for overdispersion in Poisson and binomial regression models, J. Am. Stat. Assoc., 87 (1992), 451–457. https://doi.org/10.1080/01621459.1992.10475225 doi: 10.1080/01621459.1992.10475225
|
| [13] |
Z. Yang, J. W. Hardin, C. L. Addy, Score tests for overdispersion in zero-inflated Poisson mixed models, Comput. Stat. Data Anal., 54 (2010), 1234–1246. https://doi.org/10.1016/j.csda.2009.11.010 doi: 10.1016/j.csda.2009.11.010
|
| [14] |
C. R. Rao, Large sample tests of statistical hypotheses concerning several parameters with applications to problems of estimation, Math. Proc. Cambridge Philos. Soc., 44 (1948), 50–57. https://doi.org/10.1017/S0305004100023987 doi: 10.1017/S0305004100023987
|
| [15] |
A. Buse, The likelihood ratio, Wald, and Lagrange multiplier tests: an expository note, Am. Stat., 36 (1982), 153–157. https://doi.org/10.1080/00031305.1982.10482817 doi: 10.1080/00031305.1982.10482817
|
| [16] |
T. S. Breusch, A. R. Pagan, A simple test for heteroscedasticity and random coefficient variation, Econometrica, 47 (1979), 1287–1294. https://doi.org/10.2307/1911963 doi: 10.2307/1911963
|
| [17] |
J. B. Ramsey, Tests for specification errors in classical linear least-squares regression analysis, J. R. Stat. Soc. B, 31 (1969), 350–371. https://doi.org/10.1111/j.2517-6161.1969.tb00796.x doi: 10.1111/j.2517-6161.1969.tb00796.x
|
| [18] |
H. White, Maximum likelihood estimation of misspecified models, Econometrica, 50 (1982), 1–25. https://doi.org/10.2307/1912526 doi: 10.2307/1912526
|
| [19] |
D. D. Boos, On generalized score tests, Am. Stat., 46 (1992), 327–333. https://doi.org/10.1080/00031305.1992.10475921 doi: 10.1080/00031305.1992.10475921
|
| [20] |
P. Deb, P. K. Trivedi, The structure of demand for health care: latent class versus two-part models, J. Health Econ., 21 (2002), 601–625. https://doi.org/10.1016/S0167-6296(02)00008-5 doi: 10.1016/S0167-6296(02)00008-5
|
| [21] |
J. Mullahy, Specification and testing of some modified count data models, J. Econometrics, 33 (1986), 341–365. https://doi.org/10.1016/0304-4076(86)90002-3 doi: 10.1016/0304-4076(86)90002-3
|
| [22] |
J. Mullahy, Much ado about two: reconsidering retransformation and the two-part model in health econometrics, J. Health Econ., 17 (1998), 247–281. https://doi.org/10.1016/S0167-6296(98)00030-7 doi: 10.1016/S0167-6296(98)00030-7
|
| [23] |
D. Lambert, Zero-inflated Poisson regression, with an application to defects in manufacturing, Technometrics, 34 (1992), 1–14. https://doi.org/10.2307/1269547 doi: 10.2307/1269547
|
| [24] |
A. M. Jones, Health econometrics, In: Handbook of health economics, Amsterdam: Elsevier, 2000,265–344. https://doi.org/10.1016/S1574-0064(00)80165-1 |
| [25] |
E. R. Walker, J. R. Cummings, J. M. Hockenberry, B. G. Druss, Insurance status, use of mental health services, and unmet need for mental health care in the United States, Psychiatr. Serv., 66 (2015), 578–584. https://doi.org/10.1176/appi.ps.201400248 doi: 10.1176/appi.ps.201400248
|
| [26] |
B. D. Sommers, R. J. Blendon, E. J. Orav, A. M. Epstein, Changes in utilization and health among low-income adults after Medicaid expansion or expanded private insurance, JAMA Intern. Med., 176 (2016), 1501–1509. https://doi.org/10.1001/jamainternmed.2016.4419 doi: 10.1001/jamainternmed.2016.4419
|
| [27] |
B. Efron, R. J. Tibshirani, An introduction to the bootstrap, New York: Chapman and Hall, 1993. https://doi.org/10.1201/9780429246593 |
| [28] |
R. Davidson, J. G. MacKinnon, The size distortion of bootstrap tests, Econom. Theory, 15 (1999), 361–376. https://doi.org/10.1017/S0266466699153040 doi: 10.1017/S0266466699153040
|
| [29] |
J. V. Bradley, Robustness?, Br. J. Math. Stat. Psychol., 31 (1978), 144–152. https://doi.org/10.1111/j.2044-8317.1978.tb00581.x doi: 10.1111/j.2044-8317.1978.tb00581.x
|
| [30] |
Agency for Healthcare Research and Quality, Medical Expenditure Panel Survey, 2023 full-year consolidated data file HC-251, 2025. Available from: https://meps.ahrq.gov/data_stats/download_data_files_detail.jsp?cboPufNumber = HC-251. |
| [31] |
M. Lin, H. C. Lucas, G. Shmueli, Too big to fail: large samples and the p-value problem, Inf. Syst. Res., 24 (2013), 906–917. https://doi.org/10.1287/isre.2013.0480 doi: 10.1287/isre.2013.0480
|
| [32] |
Q. H. Vuong, Likelihood ratio tests for model selection and non-nested hypotheses, Econometrica, 57 (1989), 307–333. https://doi.org/10.2307/1912557 doi: 10.2307/1912557
|
| [33] |
P. Wilson, The misuse of the Vuong test for non-nested models to test for zero-inflation, Econ. Lett., 127 (2015), 51–53. https://doi.org/10.1016/j.econlet.2014.12.029 doi: 10.1016/j.econlet.2014.12.029
|
| [34] |
D. A. Binder, On the variances of asymptotically normal estimators from complex surveys, Int. Stat. Rev., 51 (1983), 279–292. https://doi.org/10.2307/1402588 doi: 10.2307/1402588
|
| [35] |
T. Lumley, Analysis of complex survey samples, J. Stat. Softw., 9 (2004), 1–19. https://doi.org/10.18637/jss.v009.i08 doi: 10.18637/jss.v009.i08
|
| [36] |
J. N. K. Rao, A. J. Scott, On chi-squared tests for multiway contingency tables with cell proportions estimated from survey data, Ann. Stat., 12 (1984), 46–60. https://doi.org/10.1214/aos/1176346391 doi: 10.1214/aos/1176346391
|
| [37] |
T. Gneiting, A. E. Raftery, Strictly proper scoring rules, prediction, and estimation, J. Am. Stat. Assoc., 102 (2007), 359–378. https://doi.org/10.1198/016214506000001437 doi: 10.1198/016214506000001437
|
| [38] |
C. Czado, T. Gneiting, L. Held, Predictive model assessment for count data, Biometrics, 65 (2009), 1254–1261. https://doi.org/10.1111/j.1541-0420.2009.01191.x doi: 10.1111/j.1541-0420.2009.01191.x
|
| [39] |
X. Xu, Y. Zhang, Neural network predictions of the high-frequency CSI300 first distant futures trading volume, Financ. Mark. Portf. Manag., 37 (2023), 191–207. https://doi.org/10.1007/s11408-022-00421-y doi: 10.1007/s11408-022-00421-y
|
| [40] |
B. Jin, X. Xu, Office real estate price index forecasts through Gaussian process regressions for ten major Chinese cities, Adv. Comput. Intell., 4 (2024), 8. https://doi.org/10.1007/s43674-024-00075-5 doi: 10.1007/s43674-024-00075-5
|
| [41] |
Y. Wang, B. Zhou, C. Fu, X. Xu, Modeling cure fractions in interval-censored competing risks data: an AFT mixture approach, Electron. Res. Arch., 34 (2026), 6573–6613. https://doi.org/10.3934/era.2026288 doi: 10.3934/era.2026288
|
| [42] |
W. K. Newey, D. McFadden, Large sample estimation and hypothesis testing, In: Handbook of econometrics, Amsterdam: Elsevier, 1994, 2111–2245. https://doi.org/10.1016/S1573-4412(05)80005-4 |
| [43] |
A. W. van der Vaart, Asymptotic statistics, Cambridge: Cambridge University Press, 1998. https://doi.org/10.1017/CBO9780511802256 |
Figures(6) / Tables(15)

Mohieddine Rahmouni. Covariate-varying dispersion in negative binomial regression: a score-test diagnostic with an application to healthcare utilization[J]. AIMS Mathematics, 2026, 11(10): 35469-35501. doi: 10.3934/math.20261376

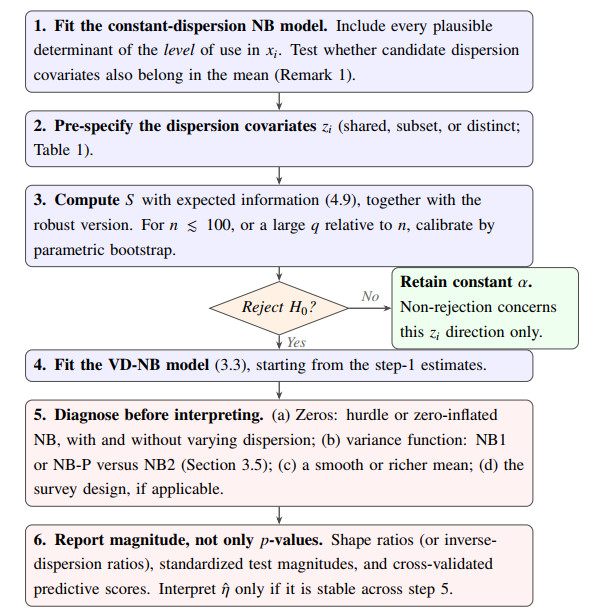
Workflow for assessing and interpreting covariate-varying dispersion in NB regression
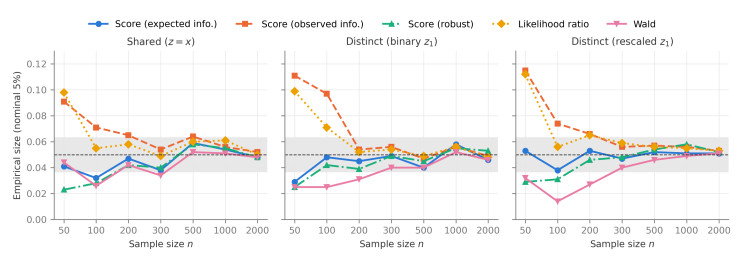
Empirical size at the 5% level by test, design, and sample size ($ R = 1,000 $ per point). The shaded band is $ 0.05\pm1.96 $ MCSE
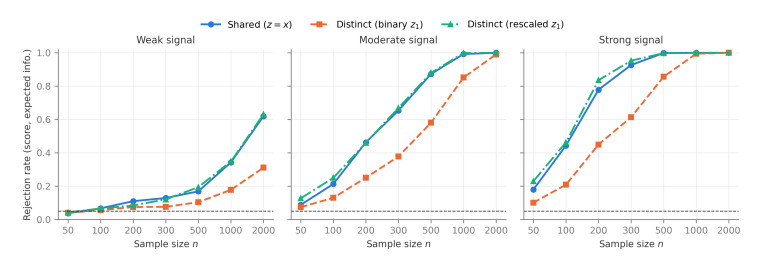
Power of the expected-information score test by signal level, design, and sample size ($ R = 1,000 $ per point). The dashed line marks 0.05
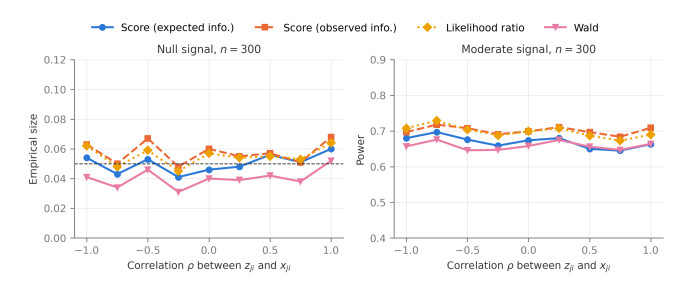
Size (left) and power at the moderate signal (right) as functions of the correlation $ \rho $ between $ z_{ji} $ and $ x_{ji} $, with $ n = 300 $ and $ R = 1,000 $ per point (MCSE about 0.007 for size and 0.015 for power)
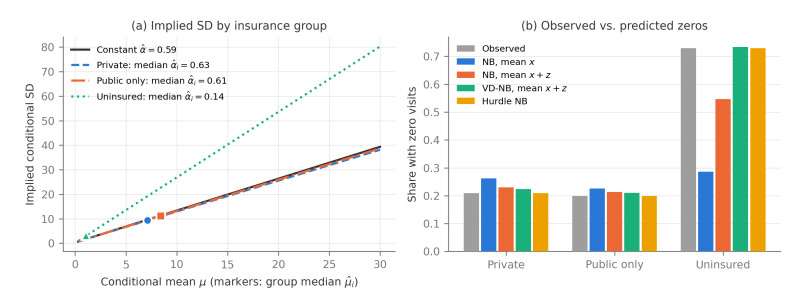
(a) Implied conditional standard deviation under constant dispersion and at the median $ \hat\alpha_i $ of each insurance group (main specification). The markers show each group's median fitted mean. (b) Observed and predicted shares of zero visits by insurance group
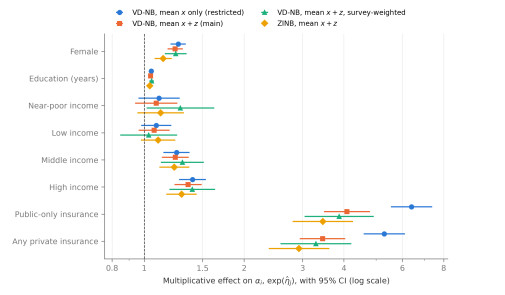
Dispersion effects $ \exp(\hat\eta_j) $ with 95% confidence intervals under four specifications. The survey-weighted intervals use design-based (linearization) standard errors




 DownLoad: