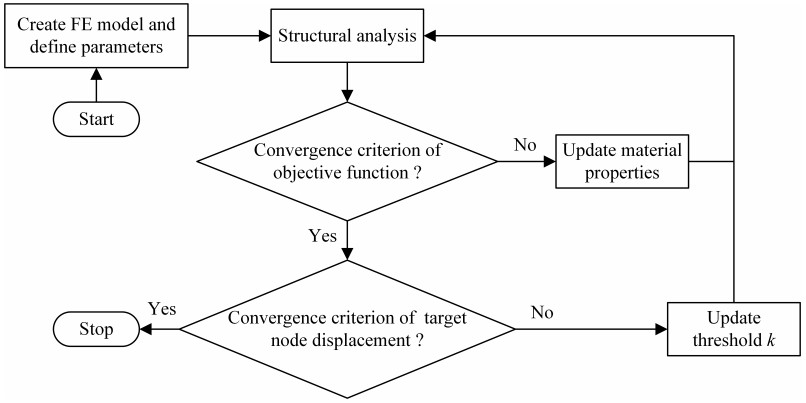
Displacement is an important measure of stiffness, and its constraint must be considered in many real engineering designs. However, traditional volume-constrained compliance minimization methods for load-bearing structures do not deal with displacements of practical importance directly. Based on this situation, the paper extends an improved bionic topology optimization method to solve the topology optimization problem with an additional displacement constraint. The updates of density design variables are based on an improved bone remodeling algorithm rather than gradient information employed by traditional methods. An explicit relationship between the threshold in the bone remodeling algorithm and target node displacement is constructed to satisfy displacement constraint. As a result, one will obtain a topology with an optimal cost-weighted sum of stiffness and mass while the target node displacement does not exceed its predefined limit. 2D and 3D examples are given to demonstrate the effectiveness of the proposed method.
Citation: Yuhai Zhong, Huashan Feng, Hongbo Wang, Runxiao Wang, Weiwei Yu. A bionic topology optimization method with an additional displacement constraint[J]. Electronic Research Archive, 2023, 31(2): 754-769. doi: 10.3934/era.2023037
Displacement is an important measure of stiffness, and its constraint must be considered in many real engineering designs. However, traditional volume-constrained compliance minimization methods for load-bearing structures do not deal with displacements of practical importance directly. Based on this situation, the paper extends an improved bionic topology optimization method to solve the topology optimization problem with an additional displacement constraint. The updates of density design variables are based on an improved bone remodeling algorithm rather than gradient information employed by traditional methods. An explicit relationship between the threshold in the bone remodeling algorithm and target node displacement is constructed to satisfy displacement constraint. As a result, one will obtain a topology with an optimal cost-weighted sum of stiffness and mass while the target node displacement does not exceed its predefined limit. 2D and 3D examples are given to demonstrate the effectiveness of the proposed method.

| [1] |
Y. Zhong, H. Feng, R. Wang, Application research of a structural topology optimization method based on a bionic principle, Eng. Optim., 53 (2021), 1733–1751. https://doi.org/10.1080/0305215X.2020.1823380 doi: 10.1080/0305215X.2020.1823380

|
| [2] |
M. Cui, M. Pan, J. Wang, P. Li, A parameterized level set method for structural topology optimization based on reaction diffusion equation and fuzzy PID control algorithm, Electron. Res. Arch., 30 (2022), 2568–2599. https://doi.org/10.3934/era.2022132 doi: 10.3934/era.2022132
|
| [3] |
L. Wang, Y. Liu, D. Liu, Z. Wu, A novel dynamic reliability-based topology optimization (DRBTO) framework for continuum structures via interval-process collocation and the first-passage theories, Comput. Method. Appl. Mech. Eng., 386 (2021), 114107. https://doi.org/10.1016/j.cma.2021.114107 doi: 10.1016/j.cma.2021.114107
|
| [4] |
J. Wu, O. Sigmund, J. P. Groen, Topology optimization of multi-scale structures: A review, Struct. Multidiscip. Optim., 63 (2021), 1455–1480. https://doi.org/10.1007/s00158-021-02881-8 doi: 10.1007/s00158-021-02881-8
|
| [5] |
X. Yan, D. Bao, Y. Zhou, Y. Xie, T. Cui, Detail control strategies for topology optimization in architectural design and development, Front. Archit. Res., 11 (2022), 340–356. https://doi.org/10.1016/j.foar.2021.11.001 doi: 10.1016/j.foar.2021.11.001
|
| [6] |
S. Mantovani, S. G. Barbieri, M. Giacopini, A. Croce, A. Sola, E. Bassoli, Synergy between topology optimization and additive manufacturing in the automotive field, Proc. Inst. Mech. Eng., Part B, 235 (2021), 555–567. https://doi.org/10.1177/0954405420949209 doi: 10.1177/0954405420949209
|
| [7] |
B. S. Mekki, J. Langer, S. Lynch, Genetic algorithm based topology optimization of heat exchanger fins used in aerospace applications, Int. J. Heat Mass Tran., 170 (2021), 121002. https://doi.org/10.1016/j.ijheatmasstransfer.2021.121002 doi: 10.1016/j.ijheatmasstransfer.2021.121002
|
| [8] |
J. Zhu, H. Zhou, C. Wang, L. Zhou, S. Yuan, W. Zhang, A review of topology optimization for additive manufacturing: Status and challenges, Chin. J. Aeronaut., 34 (2021), 91–110. https://doi.org/10.1016/j.cja.2020.09.020 doi: 10.1016/j.cja.2020.09.020
|
| [9] |
O. Sigmund, K. Maute, Topology optimization approaches, Struct. Multidiscip. Optim., 48 (2013), 1031–1055. https://doi.org/10.1007/s00158-013-0978-6 doi: 10.1007/s00158-013-0978-6
|
| [10] |
S. Im, E. Kim, K. Park, D. H. Lee, S. Chang, M. Cho, Surrogate model considering trim condition for design optimization of high-aspect-ratio flexible wing, Int. J. Aeronaut. Space Sci., 23 (2022), 288–302. https://doi.org/10.1007/s42405-021-00438-z doi: 10.1007/s42405-021-00438-z
|
| [11] |
X. Huang, Y. M. Xie, Evolutionary topology optimization of continuum structures with an additional displacement constraint, Struct. multidiscip. optim., 40 (2010), 409–416. https://doi.org/10.1007/s00158-009-0382-4 doi: 10.1007/s00158-009-0382-4
|
| [12] |
Z. Zuo, Y. Xie, X. Huang, Evolutionary topology optimization of structures with multiple displacement and frequency constraints, Adv. Struct. Eng., 15 (2012), 359–372. https://doi.org//10.1260/1369-4332.15.2.359 doi: 10.1260/1369-4332.15.2.359
|
| [13] |
Z. Zuo, Y. Xie, Evolutionary topology optimization of continuum structures with a global displacement control, Comput.-Aided Des., 56 (2014), 58–67. https://doi.org/10.1016/j.cad.2014.06.007 doi: 10.1016/j.cad.2014.06.007
|
| [14] |
R. Sivapuram, R. Picelli, Topology optimization of binary structures using Integer Linear Programming, Finite Elem. Anal. Des., 139 (2018), 49–61. https://doi.org/10.1016/j.finel.2017.10.006 doi: 10.1016/j.finel.2017.10.006
|
| [15] |
J. Rong, L. Yu, X. Rong, Z. Zhao, A novel displacement constrained optimization approach for black and white structural topology designs under multiple load cases, Struct. Multidiscip. Optim., 56 (2017), 865–884. https://doi.org/10.1007/s00158-017-1692-6 doi: 10.1007/s00158-017-1692-6
|
| [16] |
H. Ye, Z. Dai, W. Wang, Y. Sui, ICM method for topology optimization of multimaterial continuum structure with displacement constraint, Acta Mech. Sin., 35 (2019), 552–562. https://doi.org/10.1007/s10409-018-0827-3 doi: 10.1007/s10409-018-0827-3
|
| [17] |
H. Xia, L. Wang, Y. Liu, Uncertainty-oriented topology optimization of interval parametric structures with local stress and displacement reliability constraints, Comput. Method. Appl. Mech. Eng., 358 (2020), 112644. https://doi.org/10.1016/j.cma.2019.112644 doi: 10.1016/j.cma.2019.112644
|
| [18] |
L. Wang, X. Zhao, Z. Wu, W. Chen, Evidence theory-based reliability optimization for cross-scale topological structures with global stress, local displacement, and micro-manufacturing constraints, Struct. Multidiscip. Optim., 65 (2022), 23. https://doi.org/10.1007/s00158-021-03112-w doi: 10.1007/s00158-021-03112-w
|
| [19] | Y. Zhong, W. Yu, H. Feng, H. wang, R. Wang, Research on an effective bionic topology optimization method for engineering applications, Eng. Optim., (2022). https://doi.org/10.1080/0305215X.2022.2137877 |


Figures(10) / Tables(1)
Yuhai Zhong, Huashan Feng, Hongbo Wang, Runxiao Wang, Weiwei Yu. A bionic topology optimization method with an additional displacement constraint[J]. Electronic Research Archive, 2023, 31(2): 754-769. doi: 10.3934/era.2023037


 DownLoad: