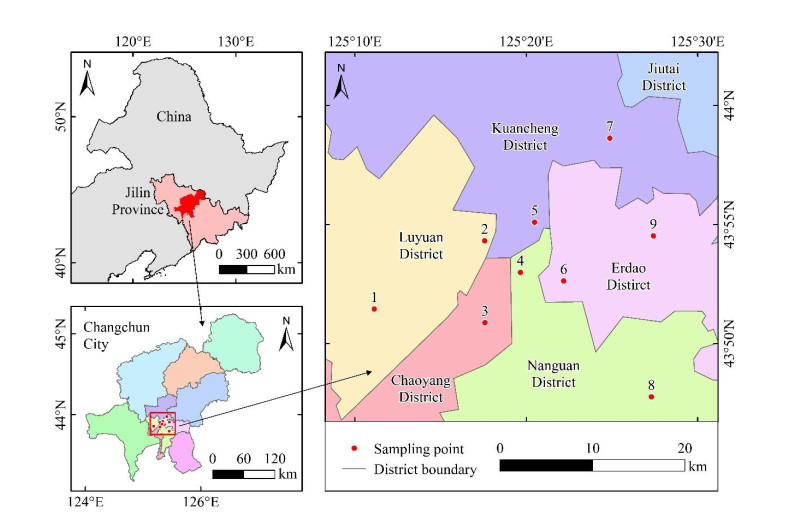
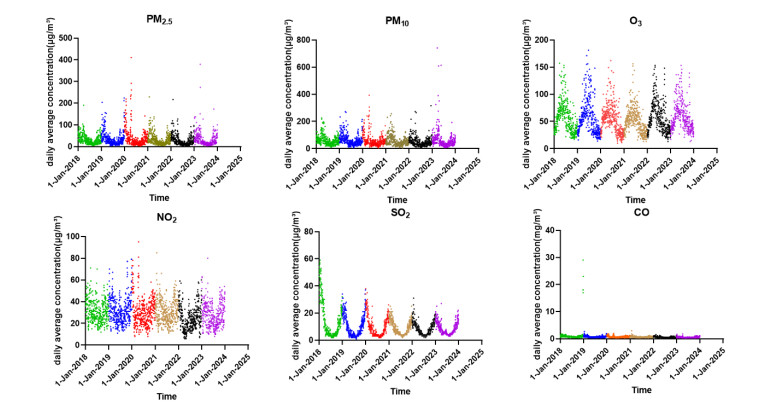
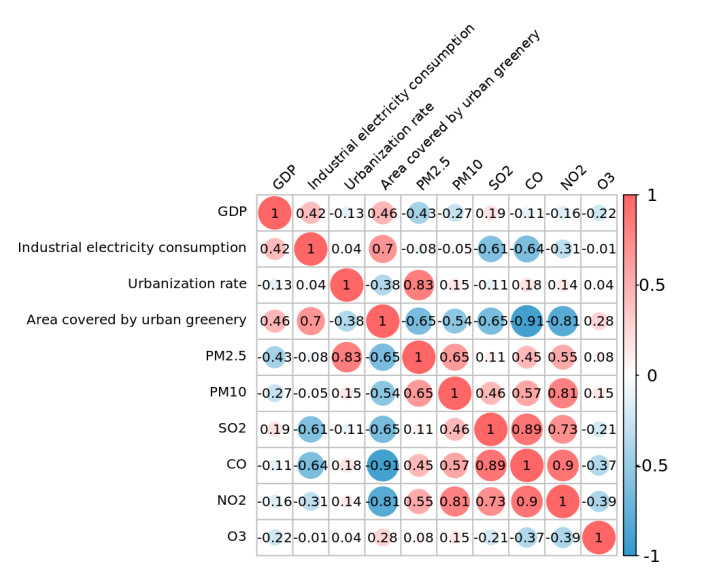
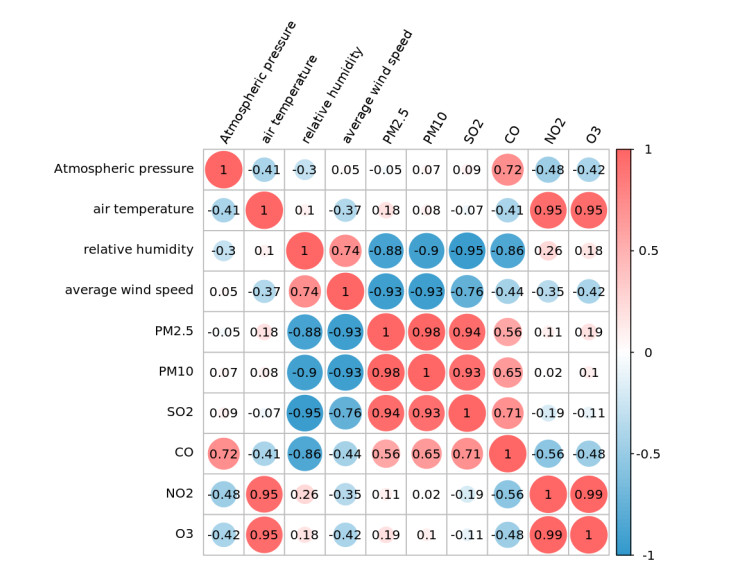
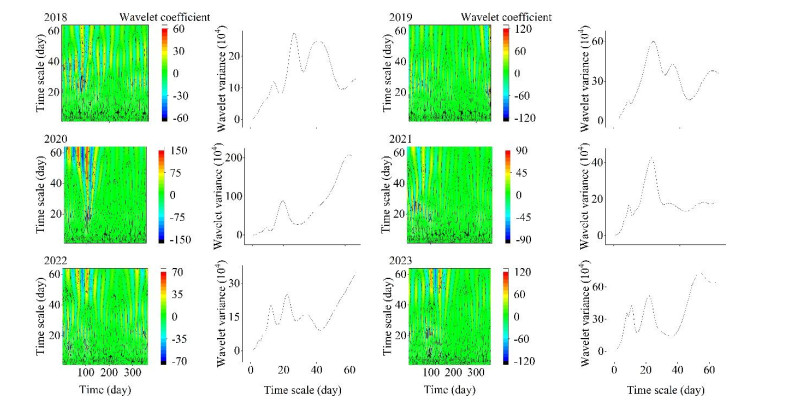
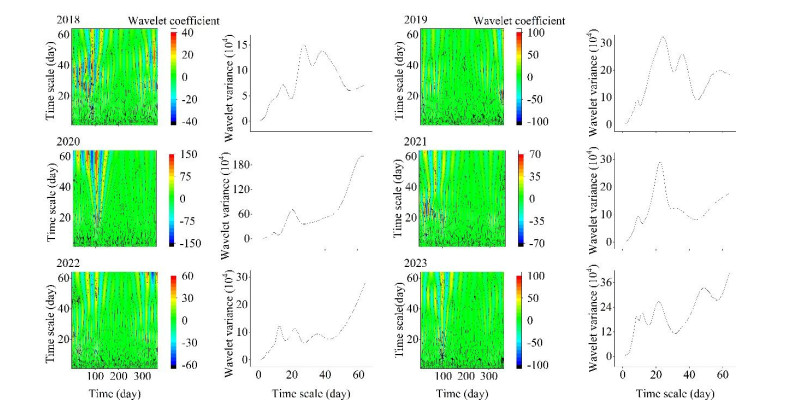
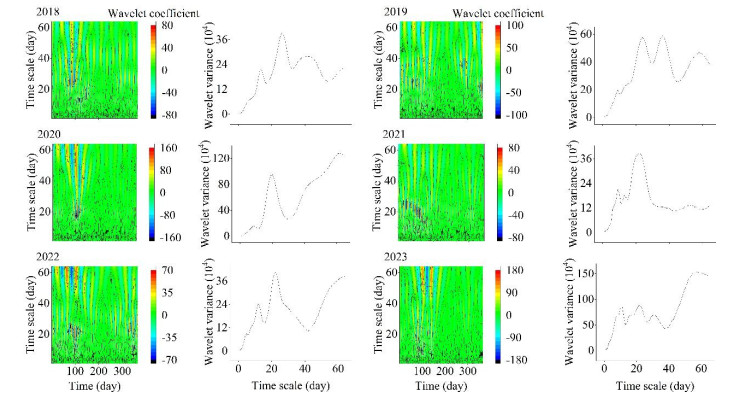
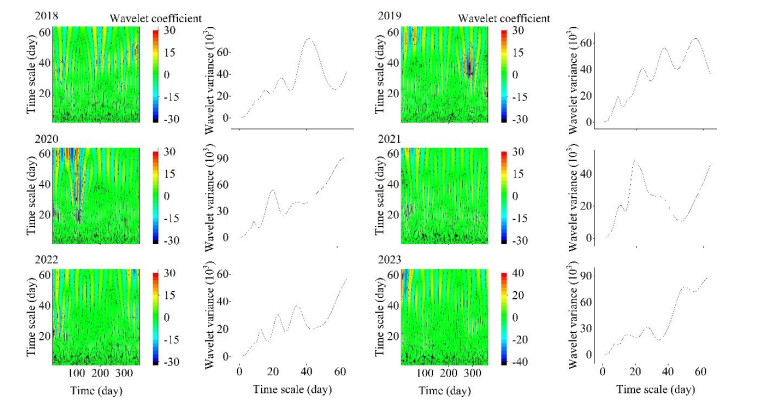
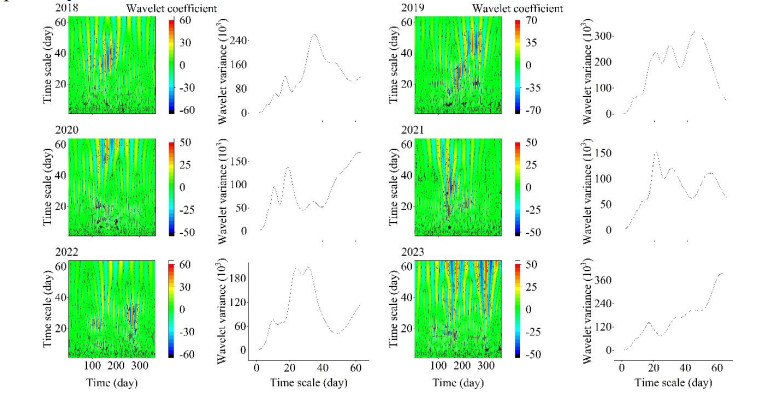
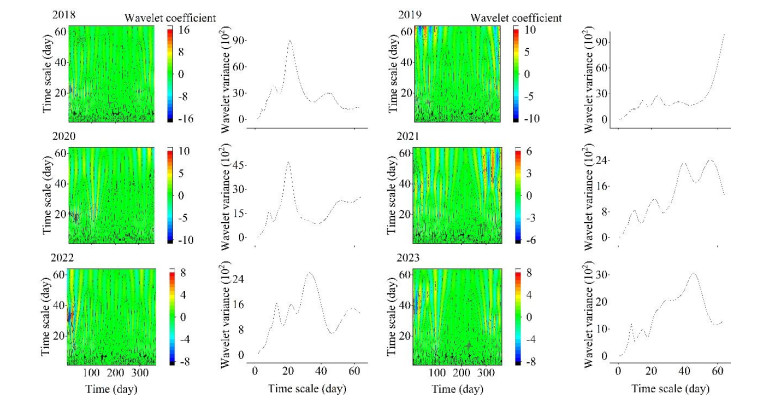
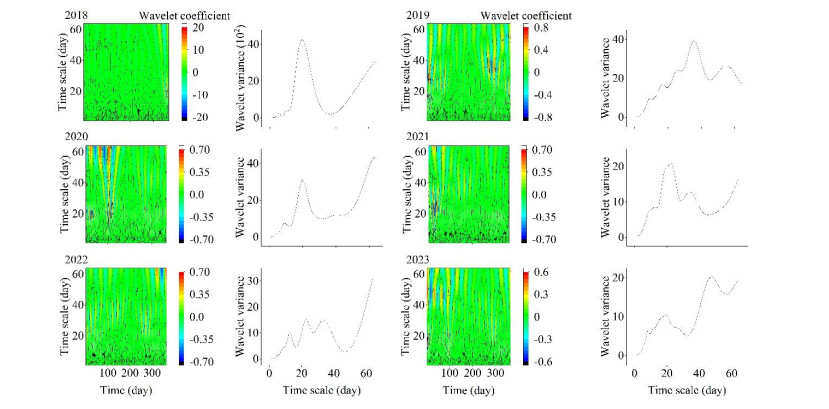
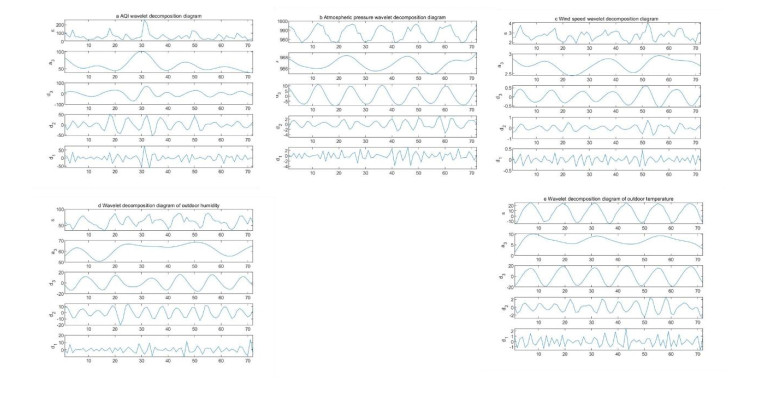
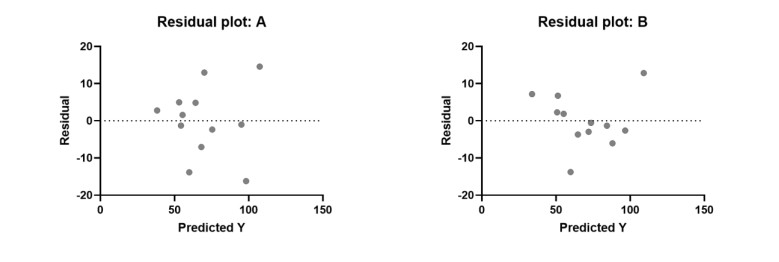
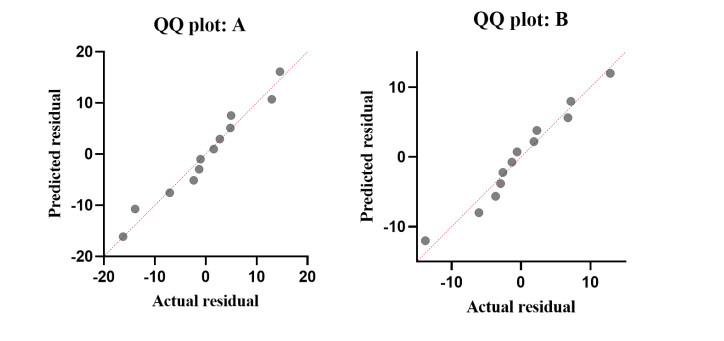
In this study, we used monitoring data on six representative pollutants, meteorological data, and socioeconomic data from January 2018 to December 2023 to clarify the spatiotemporal characteristics of air pollution in Changchun, Jilin Province, China, and to establish a short-term prediction model. First, correlation analysis (CA) was used to identify the key factors affecting pollution characteristics. Then, wavelet analysis (WA) was applied to capture the major periodic coupling characteristics of the time series, thereby analyzing the variation law of air quality. The results showed that the six air pollutants in Changchun exhibited significant seasonal differences. The peak concentration of O₃ occurred in summer, while the peaks of other pollutants were concentrated in winter and spring. The average air quality index (AQI) exhibited a downward, overall fluctuating trend, with PM2.5 and PM10 as the major pollutants. Urbanization rate and green space coverage area were identified as key social driving factors, while temperature, relative humidity, and wind speed were identified as key meteorological driving factors. Furthermore, WA revealed a coupling phenomenon between the major periods of the AQI sequence and the PM2.5 and PM10 sequences. Additionally, the low-frequency wavelet signals showed an overall downward trend, confirming that composite pollution is a typical feature of air pollution in Changchun, while the regional air quality is gradually improving. A short-term AQI forecasting equation based on ordinary least squares (OLS) was constructed. Unlike previous AQI prediction models that used only meteorological factors as independent variables, this model included "AQI data of the same period in the previous year" as a key independent variable. Verification showed that the model's fit outperformed that of traditional meteorologically driven models, yielding more accurate short-term AQI predictions for Changchun, driven by the following two major innovations. First, combined wavelet and CA comprehensively determined the periodic coupling characteristics between AQI and major pollutants, providing an efficient tool for analyzing the causes of composite pollution. Second, incorporating historical AQI data into the OLS prediction model mitigated the limitation of traditional models that rely solely on meteorological factors.
Citation: Yujia Song. Key driving factors and model predictions of the characteristics of air pollution in the urban area of Changchun, a typical city on the Northeast China Plain[J]. AIMS Environmental Science, 2025, 12(6): 1031-1058. doi: 10.3934/environsci.2025045
In this study, we used monitoring data on six representative pollutants, meteorological data, and socioeconomic data from January 2018 to December 2023 to clarify the spatiotemporal characteristics of air pollution in Changchun, Jilin Province, China, and to establish a short-term prediction model. First, correlation analysis (CA) was used to identify the key factors affecting pollution characteristics. Then, wavelet analysis (WA) was applied to capture the major periodic coupling characteristics of the time series, thereby analyzing the variation law of air quality. The results showed that the six air pollutants in Changchun exhibited significant seasonal differences. The peak concentration of O₃ occurred in summer, while the peaks of other pollutants were concentrated in winter and spring. The average air quality index (AQI) exhibited a downward, overall fluctuating trend, with PM2.5 and PM10 as the major pollutants. Urbanization rate and green space coverage area were identified as key social driving factors, while temperature, relative humidity, and wind speed were identified as key meteorological driving factors. Furthermore, WA revealed a coupling phenomenon between the major periods of the AQI sequence and the PM2.5 and PM10 sequences. Additionally, the low-frequency wavelet signals showed an overall downward trend, confirming that composite pollution is a typical feature of air pollution in Changchun, while the regional air quality is gradually improving. A short-term AQI forecasting equation based on ordinary least squares (OLS) was constructed. Unlike previous AQI prediction models that used only meteorological factors as independent variables, this model included "AQI data of the same period in the previous year" as a key independent variable. Verification showed that the model's fit outperformed that of traditional meteorologically driven models, yielding more accurate short-term AQI predictions for Changchun, driven by the following two major innovations. First, combined wavelet and CA comprehensively determined the periodic coupling characteristics between AQI and major pollutants, providing an efficient tool for analyzing the causes of composite pollution. Second, incorporating historical AQI data into the OLS prediction model mitigated the limitation of traditional models that rely solely on meteorological factors.

| [1] | Zhang L, Ji A, Liu M, et al. (2020) Spatiotemporal variations and influencing factors of PM2.5 concentrations in Beijing, China. Environ Pollut 262: 114276.https://doi.org/10.1016/j.envpol.2020.114276 |
| [2] |
Maji KJ, Sarkar C (2020) Spatio-temporal variations and trends of major air pollutants in China during 2015-2018. Environ. Sci Pollut R 27: 33792-33808.https://doi.org/10.1007/s11356-020-09646-8 doi: 10.1007/s11356-020-09646-8

|
| [3] |
Bai X, Tian H, Liu X, et al. (2021) Spatial-temporal variation characteristics of air pollution and apportionment of contributions by different sources in Shanxi Province of China. Atmos Environ 244: 117926.https://doi.org/10.1016/j.atmosenv.2020.117926 doi: 10.1016/j.atmosenv.2020.117926
|
| [4] |
Chen J, Wang B, Huang S, et al. (2020) The influence of increased population density in China on air pollution. Sci Total Environ 735: 139456.https://doi.org/10.1016/j.scitotenv.2020.139456 doi: 10.1016/j.scitotenv.2020.139456
|
| [5] | Han L, Zhou W, Li W, et al. (2014) Impact of urbanization level on urban air quality: a case of fine particles (PM2.5) in Chinese cities. Environ Pollut 194: 163-170.https://doi.org/10.1016/j.envpol.2014.07.022 |
| [6] | Wang S, Cheng S, Qi X, (2020) Effect of urban greening on incremental PM2.5 concentration during peak hours. Front Public Health 8: 551300.https://doi.org/10.3389/fpubh.2020.551300 |
| [7] |
Fang C, Liu H, Li G, et al. (2015) Estimating the impact of urbanization on air quality in China using spatial regression models. Sustainability-Basel 7: 15570-15592.https://doi.org/10.3390/su71115570 doi: 10.3390/su71115570
|
| [8] |
Fernando DC, Jaci MBS, Nisia K (2003) Periodicity of atmospheric phenomena occurring in the extreme South of Brazil. Atmos Sci Lett 5: 65-76.https://doi.org/10.1016/j.atmoscilet.2003.12.003 doi: 10.1016/j.atmoscilet.2003.12.003
|
| [9] | Lei Y, Zhang X, Tang Y, et al. (2015) Holiday effects on PM2.5 and other major pollutants in Beijing. Acta Scientiae Circumstantiae 35: 1520-1528. |
| [10] |
Schichtel BA, Husar RB, Falke SR, et al. (2001) Haze trends over the United States, 1980-1995. Atmos Environ 35: 5205-5210.https://doi.org/10.1016/S1352-2310(01)00317-X doi: 10.1016/S1352-2310(01)00317-X
|
| [11] |
Rokjin JP, Daniel JJ, Naresh K, et al. (2006) Regional visibility statistics in the United States : Natural and transboundary pollution influence, and implications for the regional haze rule. Atmos Environ 40: 5405-5423.https://doi.org/10.1016/j.atmosenv.2006.04.059 doi: 10.1016/j.atmosenv.2006.04.059
|
| [12] | Yao Y, Zou Q, Chen C, et al. (2014) The Analysis of Chemical Component of PM2.5 on Haze Formation in Suzhou City. Environ Monitor China 30: 62-68. |
| [13] |
Xie J, Sun T, Liu C, et al. (2022) Quantitative evaluation of impacts of the steadiness and duration of urban surface wind patterns on air quality. Sci Total Environ 850: 157957.https://doi.org/10.1016/j.scitotenv.2022.157957 doi: 10.1016/j.scitotenv.2022.157957
|
| [14] |
Maria I, Yan Z, Liu Y, et al. (2016) Assessing the possible impacts of temperature change on air quality and public health in Beijing, 2008-2012. Nat Hazards 84: 153-165.https://doi.org/10.1007/s11069-015-2061-7 doi: 10.1007/s11069-015-2061-7
|
| [15] |
Khaiwal R, Tanbir S, Akash B, et al. (2021) Impact of COVID-19 lockdown on ambient air quality in megacities of India and implication for air pollution control strategies. Environ Sci Pollut R 28: 21621-21632.https://doi.org/10.1007/s11356-020-11808-7 doi: 10.1007/s11356-020-11808-7
|
| [16] |
Tan S, Xie D, Ni C, et al. (2023) Spatiotemporal characteristics of air pollution in Chengdu-Chongqing urban agglomeration (CCUA) in Southwest, China: 2015-2021. J Environ Manage 325: 116503.https://doi.org/10.1016/j.jenvman.2022.116503 doi: 10.1016/j.jenvman.2022.116503
|
| [17] |
Quan J, Xu X, Jia X, et al. (2020) Multi-scale processes in severe haze events in China and their interactions with aerosols: Mechanisms and progresses. Chin Sci Bull 65: 810-824.https://doi.org/10.1360/TB-2019-0197 doi: 10.1360/TB-2019-0197
|
| [18] |
Zamora, ML, Peng J, Hu M, et. al. (2019) Wintertime aerosol properties in Beijing. Atmos Chem Phys 19: 14329-14338.https://doi.org/10.5194/acp-19-14329-2019 doi: 10.5194/acp-19-14329-2019
|
| [19] | Li C (1990) The intraseasonal oscillation in the atmosphere. Scientia Atmospherica Sinica 14: 32-45. |
| [20] |
Li Z, Wang Y, Xu Z, et al. (2021) Characteristics and sources of atmospheric pollutants in typical inland cities in arid regions of central Asia: A case study of Urumqi city. PLoS One 16: e0249563.https://doi.org/10.1371/journal.pone.0249563 doi: 10.1371/journal.pone.0249563
|
| [21] | Xu T, Zhang C, Liu C, et al. (2023) Variability of PM2.5 and O3 concentrations and their driving forces over Chinese megacities during 2018-2020. J Environ Sci 124: 1-10.https://doi.org/10.1016/j.jes.2021.10.014 |
| [22] |
Duan J, Huang R J, Wang Y, et al. (2024) Measurement Report: Size-resolved secondary organic aerosol formation modulated by aerosol water uptake in wintertime haze. Atmos Chem Phys 24: 7687-7698.https://doi.org/10.5194/acp-24-7687-2024 doi: 10.5194/acp-24-7687-2024
|
| [23] |
Xiong H, Liu X, Sun C, et al. (2025) Atmospheric water cluster-catalyzed formation of nitroaromatics as a secondary aerosol source. Sci adv 11: eadv7805.https://doi.org/10.1126/sciadv.adv7805 doi: 10.1126/sciadv.adv7805
|
| [24] |
Fotheringham AS, Yue H, Li Z (2019) Examining the influences of air quality in China´s cities using multi-scale geographically weighted regression. T GIS 23: 1444-1464.https://doi.org/10.1111/tgis.12580 doi: 10.1111/tgis.12580
|
| [25] | Wang J, Xu C (2017) Geodetector: Principle and prospective. Acta Geographica Sinica 72: 116-134. |
| [26] |
Oshan TM, Li Z, Kang W, et al. (2019) MGWR: a python implementation of multiscale geographically weighted regression for investigating process spatial heterogeneity and scale. ISPRS Int J Geo-Inf 8: 269.https://doi.org/10.3390/ijgi8060269 doi: 10.3390/ijgi8060269
|
| [27] |
Cazelles, B, Chavez M, Berteaux D, et al. (2008) Wavelet analysis of ecological time series. Oecologia 156: 287-304.https://doi.org/10.1007/s00442-008-0993-2 doi: 10.1007/s00442-008-0993-2
|
| [28] | Kumar A (2017) Spectral Analysis of Particulate Matter in the Atmosphere using wavelet transforms. International Journal of Advance Research, Ideas and Innovations in Technology 3: 155-159. |
| [29] |
Zhang H, Zhang S, Wang P, et al. (2017) Forecasting of particulate matter time series using wavelet analysis and wavelet-ARMA/ARIMA model in Taiyuan, China. J Air Waste Manage. 67: 776-788.https://doi.org/10.1080/10962247.2017.1292968 doi: 10.1080/10962247.2017.1292968
|
| [30] | Changchun survey team of National Bureau of Statistics, (2023) Changchun Statistical Yearbook 2023, Peking: China Statistics Press, 49-61. |
| [31] |
Stoy PC, Katul GG, Siqueira MBS, et al. (2005) Variability in net ecosystem exchange from hourly to inter-annual time scales at adjacent pine and hardwood forests: a wavelet analysis. Tree Physiol 25: 887-902.https://doi.org/10.1093/treephys/25.7.887 doi: 10.1093/treephys/25.7.887
|
| [32] | Wang W, Ding J, Xiang H (2002) Application and prospect of wavelet analysis in hydrology. Advances in Water Science 13: 515- 520. |
| [33] | Gao J, Jian M, Man W, et al. (2006) On the denoising method of prestack seismic data in wavelet domain. Chin J Geop 49: 1155-1163. |
| [34] | Jiang X, Liu S, Ma M, et al. (2009) A wavelet analysis of the precipitation time series in Northeast China during the last 100 years. Geog Res 28: 354-362. |
| [35] |
He W, Bu R, Xiong Z, et al. (2013) Characteristics of temperature and precipitation in Northeastern China from 1961 to 2005. Acta Ecologica Sinica 33: 519-531.https://doi.org/10.5846/stxb201111241799 doi: 10.5846/stxb201111241799
|
| [36] |
Torrence C, Compo GP (1998) A practical guide to wavelet analysis. B Am Meteorol Soc 79: 61-78.https://doi.org/10.1175/1520-0477(1998)079 < 0061:APGTWA > 2.0.CO; 2 doi: 10.1175/1520-0477(1998)079 < 0061:APGTWA > 2.0.CO; 2
|
| [37] |
Daubechies I (1988) Orthonormal bases of compactly supported wavelets. Commun Pur Appl Math 41: 909-996.https://doi.org/10.1002/cpa.3160410705 doi: 10.1002/cpa.3160410705
|
| [38] | Yang H (1980) The effectiveness of sunflowers in addressing air pollution lies in their ability to absorb a substantial amount of nitrogen dioxide (NO2). Environ Sustain Dev 21: 10-11. |
| [39] |
Quan J, Gao Y, Zhang Q, et al. (2013) Evolution of planetary boundary layer under different weather conditions, and its impact on aerosol concentrations. Particuology 11: 34-40.https://doi.org/10.1016/j.partic.2012.04.005 doi: 10.1016/j.partic.2012.04.005
|
| [40] | Yang Y (2015) Comparative research of regression model selection criteria. J Kunming Univ Sci Technol 40: 134-138. |
| [41] | Zhong Q, Ma J, Shen G, et al. (2018) Distinguishing emission-associated ambient air PM2.5 concentrations and meteorological factor-induced fluctuations. Environ Sci Technol 52: 10416-10425.https://doi.org/10.1021/acs.est.8b02685 |
| [42] | Zhang Q, Zheng Y, Tong D, et al. (2019) Drivers of improved PM2.5 air quality in China from 2013 to 2017. Proc Natl Acad Sci USA 116: 24463-24469.https://doi.org/10.1073/pnas.1907956116 |
| [43] | Xiao Q, Zheng Y, Geng G, et al. (2021) Separating emission and meteorological contributions to long-term PM2.5 trends over eastern China during 2000-2018. Atmos Chem Phys 21: 9475-9496.https://doi.org/10.5194/acp-21-9475-2021 |
| [44] | Chang Y, Liu W, Zhou X (2024) Characteristics of atmospheric volatile organic compounds and their relationship with ozone concentration in Lanzhou based superstation observation. Environ Chem 43: 1025-1034. |
Figures(14) / Tables(3)

Yujia Song. Key driving factors and model predictions of the characteristics of air pollution in the urban area of Changchun, a typical city on the Northeast China Plain[J]. AIMS Environmental Science, 2025, 12(6): 1031-1058. doi: 10.3934/environsci.2025045


 DownLoad: