


| Age of farm manager | 2002 | 2008 | 2013 | 2018 |
| 18–35 | 41.4 | 29.6 | 12.8 | 8.6 |
| 36–64 | 49.4 | 58.6 | 71.5 | 72.4 |
| 65 and above | 9.3 | 11.8 | 15.6 | 19 |
Citation: Karin Lindsjö, Agnes Anderssonc Djurfeldt, Aida Cuthbert Isinika, Elibariki Msuya. Youths' participation in agricultural intensification in Tanzania[J]. AIMS Agriculture and Food, 2020, 5(4): 681-699. doi: 10.3934/agrfood.2020.4.681
| [1] | Romanus Osabohien, Oluwatoyin Matthew, Isaiah Olurinola, Busayo Aderounmu . Agricultural transformation, youth participation and food security in Nigeria. AIMS Agriculture and Food, 2020, 5(4): 911-919. doi: 10.3934/agrfood.2020.4.911 |
| [2] | Boris Boincean, Amir Kassam, Gottlieb Basch, Don Reicosky, Emilio Gonzalez, Tony Reynolds, Marina Ilusca, Marin Cebotari, Grigore Rusnac, Vadim Cuzeac, Lidia Bulat, Dorian Pasat, Stanislav Stadnic, Sergiu Gavrilas, Ion Boaghii . Towards Conservation Agriculture systems in Moldova. AIMS Agriculture and Food, 2016, 1(4): 369-386. doi: 10.3934/agrfood.2016.4.369 |
| [3] | Isaac Busayo Oluwatayo . Towards assuring food security in South Africa: Smallholder farmers as drivers. AIMS Agriculture and Food, 2019, 4(2): 485-500. doi: 10.3934/agrfood.2019.2.485 |
| [4] | Y.T. Bahta . Smallholder livestock farmers coping and adaptation strategies to agricultural drought. AIMS Agriculture and Food, 2020, 5(4): 964-982. doi: 10.3934/agrfood.2020.4.964 |
| [5] | Lindie V. Maltitz, Yonas T. Bahta . Empowerment of smallholder female livestock farmers and its potential impacts to their resilience to agricultural drought. AIMS Agriculture and Food, 2021, 6(2): 603-630. doi: 10.3934/agrfood.2021036 |
| [6] | Jan Willem Erisman, Nick van Eekeren, Jan de Wit, Chris Koopmans, Willemijn Cuijpers, Natasja Oerlemans, Ben J. Koks . Agriculture and biodiversity: a better balance benefits both. AIMS Agriculture and Food, 2016, 1(2): 157-174. doi: 10.3934/agrfood.2016.2.157 |
| [7] | M. Laura Donnet, Iraís Dámaris López Becerril, J. Roy Black, Jon Hellin . Productivity differences and food security: a metafrontier analysis of rain-fed maize farmers in MasAgro in Mexico. AIMS Agriculture and Food, 2017, 2(2): 129-148. doi: 10.3934/agrfood.2017.2.129 |
| [8] | Theodor Friedrich, Amir Kassam . Food security as a function of Sustainable Intensification of Crop Production. AIMS Agriculture and Food, 2016, 1(2): 227-238. doi: 10.3934/agrfood.2016.2.227 |
| [9] | Robert Ugochukwu Onyeneke, Chinyere Augusta Nwajiuba, Chukwuemeka Chinonso Emenekwe, Anurika Nwajiuba, Chinenye Judith Onyeneke, Precious Ohalete, Uwazie Iyke Uwazie . Climate change adaptation in Nigerian agricultural sector: A systematic review and resilience check of adaptation measures. AIMS Agriculture and Food, 2019, 4(4): 967-1006. doi: 10.3934/agrfood.2019.4.967 |
| [10] | Yemane Asmelash Gebremariam, Joost Dessein, Beneberu Assefa Wondimagegnhu, Mark Breusers, Lutgart Lenaerts, Enyew Adgo, Steven Van Passel, Amare Sewnet Minale, Amaury Frankl . Listen to the radio and go on field trips: A study on farmers' attributes to opt for extension methods in Northwest Ethiopia. AIMS Agriculture and Food, 2024, 9(1): 3-29. doi: 10.3934/agrfood.2024002 |
An already large share of young population of Sub-Sahara Africa is rapidly growing: it is projected to increase by 95 million between 2015 and 2030 [1], and by 2050 reach 437 million which indicates that the young population would double since 2015 [2]. This large share of youth, sometimes referred to as the ‘youth bulge’ [3,4] has increasingly been addressed on the national and international agendas [5,6,7], and the major challenge is on how to absorb youth into satisfactory employment. Because of limited urban and non-farm employment opportunities, agriculture is perceived to play a key role in creating possibilities for future employment, and interventions related to agriculture and food security are increasingly linked to youth [8,9,10]. On the global agenda youth are recognised through the Sustainable Development Goals (SDGs) number 8.5 which aims by 2030, to achieve employment and decent work for all women and men, including young people and 8.6 which declares that “by 2020, substantially reduce the proportion of youth not in employment, education or training" [11].
Tanzania has one of the world’s youngest population with 45 percent being under the age of 15 [12], 35 percent between the ages of 15-35 [13], and with a median age for the population of 17.3 years (in 2015) [14]. In 2050, it is projected that Tanzania’s population will be one of the world’s ten youngest populations [15]. Furthermore, with an annual population growth rate slightly over three percent (in 2017) [16], the population is expected to double in 23 years. While not neglecting the ongoing rapid urbanization in Sub-Saharan Africa (SSA) [17], including Tanzania [13], still a majority of the Tanzanian population resides in rural areas [18]. Thus, to a large extent this is also where the population increase will take place. While it has been recognized that each new generation grows up being better educated than their parents, expansion of employment opportunities have not increased at the same pace [19]. Currently, there is a strong mismatch between the newly created jobs of 50, 000-60, 000 yearly and the 900, 000 young Tanzanians who yearly enter the labour market [6]. The Global Youth Development Index (YDI) which considers, among other indicators, health and well-being, education, employment opportunities and political participation ranked Tanzania as number 168 out of 183 countries in 2016. Employment opportunities were especially low ranked [20]. According to Haji, only 15 percent of youth in Tanzania have regular salaried jobs with a 12-months contract, while three quarters of the youth engage in farming [13].
A rapidly growing population puts high pressure on Tanzania’s agricultural sector to meet its domestic demands and guarantee food security. Potentially, the agricultural sector could absorb and employ a large share of the young population and help them form their independent livelihoods, and potentially the youth could play a key role in addressing the challenges related to domestic food demands and food security. The youth then need to be included in the sector, and in the development of the sector. This article, therefore, seeks to explore (I) whether youth are participating and included in agricultural intensification or not in Tanzania, and (II) youths’ perceptions of challenges for increased agricultural intensification, in other words how they perceive the limitations of their individual resources related to farming. Special focus is given to access to land, and agricultural techniques and inputs that increase intensification.
No worldwide definition of youth exists. While some definitions more describe youth as a stage in life, a transition from childhood to adulthood [9,19], most definitions are aged based and refer to youth as individuals within a certain age group. The UN, for instance, identifies youth as individuals between 15-24 years [31]. In Tanzania, youth are defined as individuals between the ages of 15-35 [21], and the Afrint sample includes youth headed households up to and including 35 years (see also [39,40]).
Our study builds on a mixed methods approach and the main component is a panel dataset from ten villages and four phases of surveys carried out in 2002, 2008, 2013 and finally in 2018. The dataset contains 403, 400 and 395 households in each cross section, with the final round of data collection including 396 households. Out of 396 households, 373 households were covered in earlier surveys. The quantitative data has been complemented with 43 individual interviews and seven focus group discussions in four villages, two in Iringa Region and two villages located in Morogoro Region. By addressing youths’ possibilities to engage in intensified farming, this article aims to explore and understand rural youths’ ‘opportunity space’ and what potential constraints they face. The article furthermore aims to add to the literature on youth and farming from an East African context and provide a deeper contextual understanding which could help to inform future policy work in the matter.
This article starts by outlining the main national policies on youth and agriculture. Thereafter, the theoretical framework which builds on Sumberg and Okali’s ‘opportunity space’ approach [10] is presented followed by methodology and a site description. The article continues by presenting and analysing the data, and discusses the theoretical implications of our findings. The paper is finalized with a discussion and some concluding remarks.
In the National Youth Development Policy [21] youth are highlighted as “the driving force behind social economic and political reforms in the sphere of rapid global changes." Therefore, they play a central role in the national socio-economic development and need to be included in planning and building the future. The policy, furthermore, recognizes that youth in Tanzania are a vulnerable group due to an insufficient labour market and the surrounding negative perceptions of youth regarding farming and agriculture. Meanwhile, the agricultural sector (including production and agro-industries) is identified as one potential area for employment creation, however the issue of land is problematic in Tanzania. Land is a key resource to achieve economic empowerment, however youth have limited access to land as well as capital to purchase land. Girls are especially vulnerable in this regard since customary practise excludes them from inheritance and land ownership1. Equitable access to land needs to be promoted, and rural youth and gender should be emphasised in this regard.
1 According to interviews though, this custom is not as strict today.
Tanzania has a history of subsidy programs aiming at increasing domestic production and ensuring food security. These national subsidy schemes can be divided into three phases. Between 1975 and 1985 the four major maize-producing regions Iringa, Mbeya, Rukwa and Ruvuma were targeted and the subsidy provision included fertilizers, improved seeds and pesticides to farmers in these four regions [22]. The second phase lasted between 2003 and 2007 and through a partial subsidy it aimed to turn around the negative trend of declining maize yields [23]. The third and final phase between 2008 and 2013 included a more developed and efficient subsidy program: The National Agricultural Input Voucher Systems (NAIVS). The program aimed at increasing production of maize and rice among smallholder farmers, and in 2011 it geographically expanded to include 16 regions out of 25 regions on the mainland. The NAIVS targeted smallholder farmers with less than 1 ha and provided a 50 percent subsidy for purchase of chemical fertilizers and improved seeds [22].
The current national guiding framework on agriculture and youth consists of two policies: The National Agriculture Policy [24] and the National Strategy for Youth Involvement in Agriculture (NSYIA) 2016-2021 [6]. These two policies recognize the importance of agriculture for the national GDP, labour force and livelihoods. Furthermore, improvements in the agricultural sector are emphasized to play a key role to improve living standards and alleviate poverty in the country. The government aims to generate a transformation from subsistence farming to a modern commercialized agricultural sector. The sector is, however, hampered, by several factors such as poor infrastructure, low use of irrigation, limited use of improved farm inputs and high pre- and post-harvest losses. Youth constitute a majority of the total labour force, yet they are faced with limited access to resources and inputs. Lack of employment opportunities within agricultural sector is driving youth away from rural areas, and because of low participation of youth in agriculture NSYIA was initiated. Youth are directly targeted and by creating an enabling environment, the government aims to attract youth to remain in rural areas and engage in farming. The environment being promoted includes, among others, access to land, financial resources to invest in agriculture, improved access to inputs and technology, develop irrigation infrastructure and enhanced marketing of products.
Several different theoretical approaches have been discussing the ‘youth bulge’ of SSA during the last two decades. Simplified, two contrasting viewpoints have been dominating the debate on the SSA ‘youth bulge’. The first one highlights the potentials in the younger generation and how they may combat food insecurity and contribute to an overall growth if employed and working according to market demands [7,9]. By contrast, the second viewpoint takes a more negative position arguing that large youth groups in combination with employment challenges serve as potential causes for future civil and political instability, including terrorism. Employment challenges include unemployment, underemployment and working under less satisfactory conditions [3,4].
Despite a significant drop of the agricultural sector’s share of GDP from 50 percent to less than 25 percent between 2000 and 2014, more than 70 percent of the population still depend on agriculture for their livelihoods [22].
In this article, we address agricultural intensification by measuring maize and rice yields over time. The concept of agricultural intensification, meaning the increase of agricultural productivity, has lately been challenged by ‘sustainable intensification’ proponents. Originally, sustainable intensification focused on productivity in relation to its environmental impacts, and the need of contributing to the natural capital as well as reducing environmental harm [25]. More recently, a broader approach is developed also including socially progressive outcomes and building of social capital [26]. The social component in this article is the generational aspect of agricultural intensification, and where we focus on youth and their opportunities for engaging in intensified farming in Tanzania.
The challenges to become financially independent faced by the young generation in rural Africa is addressed through the concept of ‘opportunity space’. The term is defined as each individual’s available options to establish an independent life within a certain context, given the influences of global, national and regional structural factors such as institutions, policies and social norms [27]. The opportunities open to rural youth are determined by overlapping settings at the national, local and household levels. At the national level, youths’ opportunities are affected by the governmental decisions on policies, programs and investments. Furthermore, the national level of economy and transformation determine the material welfare and the range of opportunities offered to youth. Nevertheless, the opportunities available to rural youth depend on the specific rural setting. The variations are determined by the natural resources and the potential productivity within an area, and by the area’s potential commercialization including agricultural input, capital and access to markets. Connectivity to markets and towns increases the area’s potential commercialization, and the expansion of secondary towns and smaller towns have become increasingly important for rural areas. National and local rural structures and settings thus form a set of available opportunities to a specific location. Whether the youth are fully capable of using this opportunity set is influenced by their households’ characteristics and capacity, for example, its access to land, level of intensified farming and economic diversification within the households [28].The process of managing and acting within ones opportunity space to form an independent livelihood is further influenced by personal abilities, interests, attitudes and chances, and therefore the heterogeneity within the category of youth needs to be recognized [10,27].
Sumberg and Okali distinguish between the near and the distant opportunity spaces [10]. The first one refers to where the individual is settled, and the specific contextual factors in his or her nearby surrounding. The near opportunity space is influenced by social factors such as gender, age, educational level, social networks and norms, as well as geographical factors such as access to (and quality of) natural resources and markets for products. Through short- or long-term migration an individual may instead reach the distant opportunity space, which reflects the range of opportunities that can be available to an individual but only through migration.
Traditionally, in many agrarian societies land is controlled by the older generation and community elders, and the younger generation’s possibility to form independent farms is limited. Hence, perceptions of youths’ reluctance to farming may be questioned according to White, and their reluctance may rather reflect an aversion of the long waiting period to access land in their own right [19]. Youth are, therefore, better perceived as constrained agents [19].
By using the concept of opportunity space we may better understand the contextual and social circumstances for the Tanzanian rural youth as they strive towards an independent livelihood.
The paper combines data from a longitudinal dataset collected since 2002, with qualitative data collected in 2019. The quantitative data aims to shed light on whether youth have actually participated in processes of agricultural intensification and the structural conditions that characterize youth’s access to key agricultural resources that enable or hinder such participation. The qualitative data on the other hand can tell us something about the dynamics of accessing such resources and the attitudes and interests of youth in doing so.
A sub-sample of a quantitative database, the Afrint dataset, containing data collected in four rounds in 2002, 2008, 2013 and 2018, is used to measure yields and changes in quantifiable assets over time based on age of the farm manager. The original Afrint study covered nine countries, but the study has been gradually downscaled and the fourth, most recent, phase includes seven regions in three countries, Malawi, Tanzania and Zambia (see Andersson Djurfeldt, Mawunyo Dzanku and Cuthbert Isinika [29]).
The first phase of the project—undertaken in 2002—aimed to analyse the possibilities for an African Green Revolution, using a multiple stage, purposive sampling strategy focusing on countries and regions that were considered to hold this inherent intensification potential. The focus was on the four major grain staples—maize, rice, wheat and sorghum as well as cassava.
Regions that were deemed to be above average in terms of agro-ecology and commercialization were therefore sampled. Well-established areas of intensification, such as Mount Meru in Tanzania and Machakos in Kenya were excluded, however. Within each country regions were purposively sampled to reflect variety—in the case of Tanzania, Morogoro Region and Iringa Region were sampled, with the former representing a relatively more agriculturally developed and commercially connected region than the latter. Within each region, villages were again sampled to provide variety and a stratified random sample was taken at the village level.
Data has been collected in five villages in each region in 2002, 2008, 2013 and 2018. For the final round of data collection, information from 396 farm households has been captured by the survey. The data is in the form of a panel dataset, with households that were interviewed in 2002 being re-surveyed in later rounds of data collection. One descendent has been interviewed for deceased households and households who have left the sample through out-migration have been replaced by randomly stratified households. Changes in the village population, for instance sizeable in-migration, have been dealt with through purposively sampling respondents to take this into consideration. Since longitudinal data implies that the panel ages, this in turn means that the share of younger households becomes smaller over time (see Table 1).
| Age of farm manager | 2002 | 2008 | 2013 | 2018 |
| 18–35 | 41.4 | 29.6 | 12.8 | 8.6 |
| 36–64 | 49.4 | 58.6 | 71.5 | 72.4 |
| 65 and above | 9.3 | 11.8 | 15.6 | 19 |
 DownLoad:
CSV
DownLoad:
CSV
The self-identified farm manager has been surveyed. The definition that we use for farm manager overlaps with the term landholder as used by the FAO as: “the civil or juridical person who makes the major decisions regarding resource use and exercises management control over the agricultural holding operation." [30]. Research assistants, trained in workshops prior to the survey, have carried out the interviews with the farm manager.
In most cases the farm manager is also the household head. The exception here are de facto female headed households where the farm manager is female and the non-resident household head is male. Youth headed households are defined as those households who have a farm manager between and including the ages of 18 and 35 years. Some methodological shortcomings need to be recognized with respect to using the household as the study unit and only interviewing the farm manager. The ability to speak on behalf of other household members may be limited, for instance, while details related to intra-household access to resources are not captured. The finances of the original project were limited, however and the household was chosen as the unit of study in the first data collection phase. To be able to make use of the longitudinal research design we use the household as the unit of study in all subsequent rounds.
Using the quantitative data we can analyse changes over time with respect to changes in land productivity (measured through yields in maize and rice), where rising productivity connotes intensification. Moreover, we can measure access to key agrarian resources necessary to participate in processes of intensification. The dataset contains data on cropping patterns, size of cultivated area under the main grain crops (maize and rice), use of agricultural inputs, such as chemical fertilizers and improved seeds for these crops, but also data on agricultural techniques, for instance land preparation methods. The yield data is calculated as three year averages using retrospective data for production and cultivated area for two seasons preceding that time of data collection. The purpose is to address between season variations. Extreme cases for yield data have been removed at the village level for the final variable, to address localized differences in land use patterns.
For cultivated area, the respondent has estimated total area under cultivation, and this is referred to below as total farm size when discussing changes in land access among the different age groups. Dummy variables have been used to specify whether respondents rented land. The dataset also contains data on non-grain crops, for instance horticultural crops as well as broader soil management and irrigation techniques, but since the focus in this paper is on intensification in rice and maize specifically these variables are not discussed in what follows.
The sample is divided by the age of the farm manager into three groups: youth, in the age group 18-35 years of age, middle-aged 36-64 years of age, and elderly, those aged 65 years and above.
Statistically, ANOVA tests are used to measure the significance of differences between these three age groups in terms of intensification trends and key agrarian resources, with Tamhane’s post hoc test used to identify statistically significant differences between the groups in question. T-tests have been used to test differences for each age group over time. Although it would have been pertinent to discuss the twin demographics of gender as well as age group, the share of female headed households and the share of youth are too small to enable statistical testing. Moreover, this article should be seen as a companion to two other papers written on gender and intensification [23] and gender and assets (currently being considered for publication) outlining gender-based patterns of agrarian change over time for the same sample.
The sample for 2018 contains a total of 396 households, but one household had missing information on the age of the farm manager. For the remaining 395 households, 34 were headed by youth (varying in age between 18 to 35 years). Most households are found in the 36 to 64 age group, with 286 households whereas the elderly (65 years and above) comprise of 75 households (see Table 1).
The Afrint dataset is complemented with qualitative interviews and focus group discussions (FGDs) from four villages; Ihemi and Kasanga in Iringa Region and Idete and Katarukila in Morogoro Region. The qualitative dataset aims to provide a richness to the study by exploring the youths’ perceptions on the challenges related to agricultural intensification. In total, 43 interviews were held with youth up to and including 35 years, and seven focus group discussions were held with youth. In Iringa Region, 11 interviews (4 females) were held in Ihemi and seven interviews in Kasanga (of which females were 4). For Morogoro Region, 12 respondents (5 females) were interviewed in Idete and 13 interviews (4 females) conducted in Katarukila. The seven FGDs were held accordingly: Two in Ihemi, two in Idete and three in Katarukila.
The interviews were sampled based on the quantitative dataset, meaning we included the available youth headed households selected for the quantitative dataset. In addition to the youth headed households we also interviewed youth who do not yet run their own household but still live within a household headed by another family member. The two different types of youth were sampled as we expected possible differences in their perceptions on farming and related challenges. In total, 25 respondents were youth living in a household headed by a more senior family member, and 18 respondents were youth headed households. One focus group was held with a formal local youth group. To create an inclusive and open atmosphere, the remaining six groups were divided by gender and we held three male FGDs and three female FGDs. The female FGDs are not limited to female headed households only, but also include the spouses from male headed households. The interviews and FGDs were semi-structured and used an interview guide. Themes during interviews and FGDs on the one hand reflected upon farming including crops and variety of techniques, access to land, inputs, supplies and marketing, and on the other hand perceptions of being young in a rural context regarding challenges and future aspirations. The qualitative data were thematically manually coded by place of origin and respondent category.
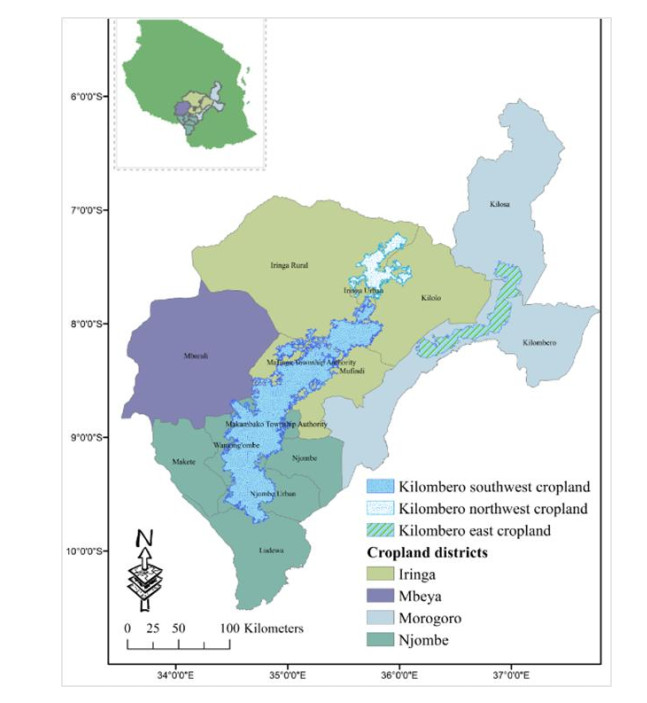
While quantitative data were collected from all ten villages, qualitative data from farm managers as well as FGD were only collected from four villages; Idete and Katurukila in Morogoro region, Kilombero district, Ihemi and Kasanga in Iringa region. Idete and Katurukila were selected to represent villages in Morogoro region, where the rainfall is bimodal receiving 1200-1400 mm of rain per annum, within Kilombero valley where rice is the most important crop, grown for food and for cash income. Sugarcane production is important in Katurukila village where some farmers supply sugarcane to Ilovo sugar Company as out-growers. In the last round of data collection, there were a total number of 662 and 477 households in Katurukila and Idete respectively, having about 10 percent and 5 percent child headed households (a household headed by someone under 18 years) respectively.
Ihemi and Kasanga are found in Iringa region; Iringa rural and Mafinga districts respectively. The wettest month in Iringa (with the highest rainfall) is January (175 mm). Driest months (with the lowest rainfall) are July and August (0 mm). Maize is the main staple crop, produced by almost all respondents (99 percent) in the region, as the main food and cash crop. Other crops include beans, Irish potatoes and other vegetables to feed an increasing urban population at Mafinga and other emerging smaller urban centres. Timber has also become an important cash crop in Kasanga village but it is less pronounced in Ihemi due to prevailing land constraints. Ihemi and Kasanga villages had 505 and 431 households respectively, with a highest proportion (20 percent) of child headed households in Ihemi compared to 10 percent or less in all the other nine villages in the sample.
This section includes longitudinal yields data addressed from a generational perspective. Both maize and rice yields are covered as they are the main crop for Iringa Region and Morogoro Region respectively. The first research question regarding whether youth are participating and included in agricultural intensification or not in Tanzania, thus if youth have an opportunity space to make participation possible is addressed in this section, 5.1 as well as in 5.2. Research question number two on youths’ interests to make use of such a space, and youths’ perceptions of challenges for increased agricultural intensification, is addressed in section 5.3.
A closer look on the development of maize yields between age groups, (see Table 1) shows that youth have become marginalised over time. Indeed, for the first two rounds of data collection there were no significant differences in yields between the age groups. The middle-aged group especially stands out in rounds three and four, however. There is a significant difference in yield between the middle-aged group and the elderly for the third round (significant at the 5% level), a significant difference in the final round between the youth and the other two age groups (significant at the 1% level for the youth and 10% for the elderly, respectively). The data also shows a statistically significant decrease in yields only for the youth, possibly an outcome of the termination in governmental subsidy program, under the National Input Voucher scheme (NAIVS), which run from 2008 to 2013 [22]. No alternative subsidy program has been implemented since then.
| Age group | 2000–2002 | 2006–2008 | 2013–2015 | 2016–2018 | 2000–2002 to 2006–2008 | 2006–2008 to 2013–2015 | 2013–2015 to 2016–2018 | |||
| Diff. | Sig. | Diff. | Sig. | Diff. | Sig. | |||||
| 18 to 35 | 987 | 1150 | 1281 | 881 | 163 | 131 | -400 | ** | ||
| 36 to 64 | 915 | 1299 | 1509 | 1449 | 384 | *** | 210 | ** | -60 | |
| 65 and above | 849 | 1256 | 1201 | 1165 | 407 | ** | -55 | -36 | ||
| Total | 936 | 1253 | 1433 | 1338 | 316 | *** | 180 | ** | -95 | |
DownLoad:
CSV
Additional explanations for low maize yields may be found in the qualitative data. First of all, agricultural inputs are perceived as expensive and some families do not consider advices provided by the extension officers because it will imply additional costs for the households. Related to this argument is smallholder farmers’ limited access and resistance to credit loans for agricultural investments, as well as difficulties to save money after harvesting. The outcome of this appears to be that youth usually rent land one season at a time, and these temporary arrangements possibly have consequences on the limited investments that are made. In relation to renting arrangements, it was also mentioned in our qualitative data that owners did not allow fertilizer on their land and that youth had to obey this rule otherwise they would not be allowed to rent it. Snyder et al. highlight the same finding in north-central Tanzania [32]. It is believed that chemical fertilizers ruin the soil and that farmers who have started to use them will become dependent on these fertilizers to improve yields.
Table 3 illustrates the share of farmers using improved variety of maize seeds. Our quantitative data indicate a total increased use of improved maize from the first to the fourth cycle, however with considerable variations between the different age groups. For the first round there were no statistically significant differences between youth and other groups in terms of use of improved seeds, for the final round there was a statistically significant difference between youth and the middle group (10% significance). By the time of the final round the share of middle aged households using improved seed was nearly 18 percent higher than the youth.
| Age group | 2002 | 2008 | 2013 | 2018 |
| 18–35 | 20 | 27 | 14 | 19 |
| 36–64 | 19 | 27 | 21 | 37 |
| 65 and above | 9 | 24 | 21 | 28 |
| Total | 18 | 27 | 20 | 34 |
DownLoad:
CSV
Since the first round of data collection, the youth have fallen behind and there is a widening gap between the age groups. While the youth have managed to improve their use between the third and the fourth cycle, the use during the fourth cycle remains lower than the use in the 2002 round. The use of improved seeds by the elderly has increased substantially over time, and again the middle-aged group is positioning themselves. The result is somewhat surprising as we are informed through our qualitative data that it is the older generation that is reluctant to modern farming and changes of technology. These findings may reflect the fact that since 2016 the government has introduced bulk procurement of inputs, especially fertilizer, making the inputs more accessible to farmers through rural agro-dealers. Youth tend to miss out of this space because they lack cash for procuring seed. Regarding chemical fertilizer on maize, the use in 2018 varies from 40 percent among youth, 47 percent among the older generation to 54 percent for the middle-aged group. By contrast, fertilizer use on maize therefore, has generally increased for all groups, but there were no statistically significant differences between the age groups in the first or final round of data collection. To realize yield effects though, the chemical fertilizers need to be combined with improved seeds, and as youth lack access to seeds they are marginalized in the intensification process.
The total use of oxen plough or tractor for land preparation on maize (not divided by age groups) has more than doubled during the data collection period, from 24 percent in 2002 to 52 percent in 2018. While the youth held a leading position for the first and second rounds of data collection, they have since fallen behind, especially compared to the middle-aged group. For the fourth round of data collection the use of plough or tractor was 57 percent among the middle-aged group, nearly twice as much as the figure of 30 percent among youth. There were no statistically significant differences between the age groups for the first round of data collection, by the time of the third phase, there was a statistically significant difference between those above 65 and the youth (5% level significance).
The above outlined results from Iringa Region indicate that youth are marginalized in the intensification process and the near opportunity space appears to limit youths’ possibilities to engage in intensified farming. Lack of capital especially limit their possibilities to access farming inputs and make agricultural investments. The low use of improved seeds, fertilizer and technology suggest substantial room for further intensification though.
In sharp contrast to the maize yields outlined above, as illustrated in table 4, with regards to rice yields in Morogoro Region, a general positive progress between 2000-2002 and 2016-2018 for all age groups is noted. Significant differences in rice yields emerge for the third and fourth rounds of data collection. For the third phase, these differences are found between the youth and the elderly (at the 10% level) and for the middle-aged group compared with the elderly (at the 5% level). For the fourth round, the differences are significant between the youth and the elderly (at the 10% level) and the middle-aged and the elderly (at the 5% level). The high labour requirements of rice marginalize the elder farmers, but benefit the younger households.
| Yields, rice kg/ha | Yield changes over time | |||||||||
| Age group | 2000–2002 | 2006–2008 | 2013–2015 | 2016–2018 | 2000–2002 to 2006–2008 | 2006–2008 to 2013–2015 | 2013–2015 to 2016–2018 | |||
| Diff. | Sig. | Diff. | Sig. | Diff. | Sig. | |||||
| 18 to 35 | 1636 | 1871 | 2435 | 2917 | 235 | 564 | ** | 482 | ||
| 36 to 64 | 1422 | 1689 | 2392 | 2432 | 266 | * | 704 | *** | 39 | |
| 65 and above | 1553 | 1516 | 1722 | 1837 | -37 | 206 | 115 | |||
| Total | 1520 | 1734 | 2301 | 2391 | 215 | ** | 567 | *** | 90 | |
DownLoad:
CSV
Regarding technology use on rice, 22 percent of the youth headed households used improved variety of seeds in the fourth round, compared to 16 percent among the middle-aged group and only 4 percent for the elderly. The difference is only statistically significant between the middle-aged group and the elderly, however (at the 5% level). The use of pesticides on rice was 28 percent for the youth, 36 percent for the middle-aged group and 12 percent for the elderly during the final round of data collection. Again, this difference is only statistically significant for the same two age groups (and at the same level). With regards to rice production in Morogoro Region, the youth clearly shows that they are included in the ongoing intensification process. Still, the relatively low use of improved seeds and pesticides suggest possibilities for further intensification.
In terms of cultivation practises for rice, there is a clear trend towards a more modern intensified farming in Morogoro Region, and the youths’ near opportunity space has clearly improved during our four rounds of data collection. In 2002, 71 percent of youth headed households indicated that they cultivated their land by using hoe. In 2018, this figure had decreased to 11 percent. During the same period there was an increased use of oxen ploughing from zero percent to 33 percent as well as tractor ploughing from 27 percent to 56 percent. Nevertheless, lack of tools and machineries are still viewed by the respondents in our qualitative dataset in this study as one of the main obstacles to intensify farming. The contrasting picture between youths’ participation in intensified farming between Iringa Region and Morogoro Region in terms of yields and technology indicate a large regional difference in youths’ near opportunity spaces. While youth are marginalized in Iringa Region, they are by contrast leading the intensification process in Morogoro Region. Possible explanations for their inclusion could be the labour intensity of rice farming, that rice is used for sale while maize is used for own consumption, better market price of rice which stimulates increased productivity and that Morogoro Region is closer to larger urban markets than Iringa Region.
According to the qualitative data, the near rural opportunity space for youth is limited and include major obstacles to intensify farming. Irrespective of the region, apart from tools and machineries already highlighted, other obstacles include capital for agricultural inputs, infrastructure and access to markets, changing weather condition, unreliable prices on crops and plants destroyed by diseases, insects or animals. The answers did not differ depending on category of respondent (i.e. youth headed household or youth living within a household headed by someone else). This is not very surprising though, as youth who do not head their own household usually farm family land and thus are aware of the current obstacles. Previous research point to similar obstacles [32,33]. Suleiman highlights the access to market as a major hurdle for smallholder farmers in rural Tanzania as many roads are impassable at certain periods of the year [34]. Our quantitative data confirms the demands for improved market conditions, and 84 percent of youth headed households stated in 2018 that they would be able to put more land under cultivation if market conditions were improved. Clearly, access to markets to sell goods is restraining the near opportunity space, although this is not specific to youth. To overcome this hurdle at least somewhat, youth have started to contact urban residents to locate markets with the highest prices, thereafter organizing joint transport for their goods.
In SSA, access to land is becoming increasingly challenging to the younger generation. This is due to population growth, delayed transfers of land between generations as parents live longer and need to keep their land, and the increase of medium-scale commercial farms. Consequently, youth to a larger extent work on family land or, if they have the financial resources, rent land [28].
Throughout all four cycles of data collection there are generally no statistically significant differences in cultivated area among the age groups—the only exception is for the second round of data collection where there was a difference between youth and middle aged. Farm size fluctuates over the phases. In general, however, the farm size in the two regions among all age groups has decreased during the data collection from 1.83 ha per household in 2002 to 1.59 ha per household in 2018. This difference is strongly significant (at the 0.01 level). For the youth group, cultivated area fell from 1.72 ha to 1.36 ha between the first and final rounds of data collection.
The share of youth headed households who rent land is 30 percent, same as for the middle-aged group while only 10 percent of the older generation rent land. Irrespective of generational belonging, access to land is obviously a basic necessity in the near opportunity space as agriculture still dominates the rural livelihoods in Tanzania. Therefore, the overall decrease poses a limitation to the rural opportunity space for smallholder farmers in general. During the data collection time frame, youth have decreased their farm size by 30 percent 2018 compared to 2002, possibly as a result of increased life expectancy and postponed inheritance between generations as well as the ongoing population growth. This negatively affects their opportunity space. The answers from our qualitative data to whether the land under cultivation is enough or not, though, is rather mixed within each village, except for Katarukila where all respondents but one said that it is not enough. However, many respondents who said they did have enough land also said that their financial resources were constrained and that they simply could not manage to cultivate a larger land plot in a proper way regarding the necessary needs for inputs. Capital, rather than land, hence was the limiting factor. Concerns were raised, though, whether the family farm size would be enough in the future. The contextual setting for Katarukila is rather specific. As it is surrounded by the Udzungwa Mountains National Park, the villagers have no possibilities to increase land for cultivation. Furthermore, the closeness to the national park also implies that the cultivated fields from time to time are destroyed by wild animals. Idete village faces a different situation as land next to the village is owned by a teak company and a prison. The prison owned land is unused, and the villagers are frustrated by the uncultivated land nearby, but have not managed to agree with the prison manager on using the area.
Regarding the answers on whether the land was enough or not, we expected to be able to distinguish between youth headed households and youth who live in a household headed by someone else. The latter category was expected to a larger extent to respond insufficient. Our qualitative findings show only a slight difference between the categories though: 48 percent of the youth living in a household headed by older family members replied that land was not enough, compared to 44 percent of youth headed households.
After harvesting, according to the qualitative data, youth engage in seasonal work for about three months. With regards to this seasonal work a gender difference stands out. While the girls usually opt for the distant opportunity space and leave for urban areas during this short-term period to search for jobs as house maids or engage in petty businesses, the young men often remain within the villages as the near opportunity space offers the possibilities for them to engage in construction work.
The opinions on whether to listen and apply the recommendations provided by the local extensions service officers differ. On the one hand, it is argued that through the information provided you learn modern farming as well as receive advices in case you face any kind of farm related problems. Youth are, accordingly, more eager to learn about modern farming techniques than the older generations who continue to farm traditionally as they are used to. On the other hand, a strong contrasting perspective is raised, arguing that it is useless to listen to any advices from the extension officers as the advices are directing the farmers towards the need of investing in agricultural inputs. In addition, the farmer is sometimes required to pay the extension agent to reach the farm. For many households this is simply an impossible cost to manage.
Even though several issues are highlighted as main concerns for the younger generation, they all seem to be intertwined somehow, though. Throughout the interviews the issues of concerns were lack of capital and poverty, lack of education, unemployment, laziness and issues related to health such as alcohol, drugs and unwanted pregnancies. It can be understood as the first three concerns represent a lack of an essential need for progress and well-being leading to the remaining concerns of laziness and health related issues. Surprisingly, lack of land was not highlighted as a main concern of the younger generation despite the drastic decrease in land size over the past two decades. Perhaps this could be explained by the answers to whether they perceived they had enough land and where respondents commonly replied that they did have enough considering their financial situation to maintain it well. In a study on Tanzanian youth, by the British Council, similar challenges were identified, with the lack of employment opportunities recognized as the main challenge for young people today [35]. Without adequate education, capital or employment the youth’s livelihood opportunities are limited and instead of becoming young independent adults they remain dependent on their families.
When youth are asked about their future aspirations the answers differ. In general, five broad categories can be outlined: 1) Repair/build a house; 2) continue education with a specific profession in mind; 3) start a business; 4) invest in farming (purchase land and buy machineries) and 5) invest in livestock. A future life which includes both farming and doing business was highlighted by several respondents as a fruitful combination as it guarantees the basic household’s needs of food as well as increased possibilities to generate capital. To a large extent these aspirations are based locally within the near opportunity space. Those who aspired to higher education saw the potential of the distant opportunity space to provide a career outside farming and the rural areas. Despite the obvious challenges within the rural opportunity space that youth face on a daily basis in their everyday life, it appears as though youth would like to make use of the near rural opportunity space that is available to them.
Surprisingly and contrasting to earlier research and statements [21,33], a majority of the youth interviewed actually do want to stay in the villages. Out of 43 respondents, 33 would like to stay in their villages (eight out of eleven respondents in Ihemi, four out of seven in Kasanga, nine out of 12 in Idete and 12 out of 13 respondents in Katarukila), nine would like to leave their villages and one respondent argued that whether to stay or not depended on circumstances and thus the respondent could not give a more precise answer at this point. The differences between youth headed households and youth living in a household headed by someone else are only minor. Of the 18 youth headed respondents 15 said they would like to stay within their village. The corresponding number among the youth not heading their own household was 18 out of 25. Out of the 43 respondents 23 had primary level education (standard VII) and 20 had post primary education. A majority of the higher educated respondents had completed Form IV. Only four respondents with higher education said they would like to leave the village because of better opportunities for business elsewhere. A recent study from north-central Tanzania highlights the same trend. Snyder et al. argue that the younger generation do want to farm but due to the lack of access to a piece of land of their own they keep on farming family land [32]. As a result, youth are contributing to their households’ economy rather than saving resources to become independent adults and start a family of their own [32]. In our study, out of 43 respondents 34 answered that they would like to continue farming. A closer look at these 34 positive answers show that 16 belong to the youth headed household category and 18 to the category of youth living in a household headed by someone else. A more nuanced picture is provided by the female focus group in Ihemi though. Rather than wanting to stay, the young mothers feel they are obliged to stay after they have married and formed their own family. Even though they would like to leave the village to seek other opportunities there is “no way out" as they describe it.
We were told that youth no longer leave the rural areas to the same extent as in previous times. Many of those who did leave the villages earlier have now returned, and the youth nowadays know from their experiences that a life in town can be difficult and low paid. We did not find a general sense that an urban life implied a modern life, easier than the rural farm based life. Since a secondary school was established in 2006 in Idete village, youth stay longer in the rural area. In the previous days, the distant opportunity space played a more important role and girls, for example, left to towns to search for work as house maids. With regards to education, in 2015 the government of Tanzania declared that, starting from January 2016, obligatory schooling would be extended to not only include primary school but also lower secondary level (Form I-Form IV) [36,37]. Nevertheless, secondary school enrolment remains low in the country with a gross enrolment of 26 percent (in 2017) [38], suggesting no major consequences on labour supplies in farming, yet. Youth who participated in our study thus to a large extent neglect the distant opportunity space, based on earlier migrants’ experiences. Only a few had a wish to leave the villages, and the reasons given were because they were born and raised in the village, they do not like the environment due to limited possibilities for development and to earn capital within the village and difficulties related to livestock.
The diversity of youths’ aspirations in the qualitative data suggests a heterogeneity within the youth group and that there is not one solution only to economically empower youth to form their own independent livelihoods.
With a rapid continuous population growth in Tanzania, an intensification of the agriculture will be necessary to satisfy the increased domestic market and guarantee the national food security, and avoid an increased dependency on imported food. In this article we are interested in whether youth are participating and included in agricultural intensification or not in Tanzania, and youths’ perceptions on challenges for increased agricultural intensification.
The near opportunity space for rural Tanzanian youth is still dominated by the agriculture sector as other livelihoods opportunities remain limited. Yet, the younger generation’s space is limited by several factors.
With regards to yields and thus participation in agriculture intensification, the findings presented in this article highlight a contrasting picture between Iringa Region and Morogoro Region. The data on maize yields for Iringa Region revealed a decrease for all age groups between 2013-2015 and 2016-2018 seasons. Youth were especially affected by decreased yields. By contrast, in Morogoro Region the difference in yields between youth and other age groups have emerged over the final two phases of data collection. Regarding agricultural inputs and technology, there is a clear division between the two regions’ available near opportunity spaces for youth. Whereas in Morogoro Region, youth are highly participating in the modernization of farming, youth in Iringa Region lack access to inputs and technology compare to other age groups.
Our study confirms earlier findings [6,39,40] regarding current challenges for smallholder farmers to engage in intensified farming and investment capital, tools and machineries, and access to markets and reliable prices are some of the listed main obstacles. As the life expectancy increases and land inheritance between generations is further delayed, the issue of access to land implies a greater future challenge postponing the possibility of forming an independent livelihood.
When it comes to youths’ future aspirations and whether to stay or not in the rural areas we were surprised that only a few said they prefer to leave the villages. This is in sharp contrast to earlier research [32,33] arguing that youth in general aspire to a modern urban life. The distant opportunity space appears to influence youth less today, and to a large extent, youth aspirations involve the local setting rather than something that might be reached through short and long term migration, or a permanent urban residence. A majority of the respondents would like to make use of their near rural opportunity space, but are constrained due to the obstacles outlined above.
With the aim of including youth in agricultural intensification and to improve their rural opportunity space, policy recommendations ought to be of both generic and specific character. The more generic recommendations include improved rural infrastructure which would ease access to markets and decrease smallholder farmers’ dependency on vendors, and programs targeting smallholder farmers with subsidized farming inputs. But, if the younger generation is really to be included in the intensification of the agricultural sector more specific recommendations are needed. Policy recommendations ought to consider the youth who actually want to remain in rural areas and youth need to be a specific target group whenever rural development programs occur. Furthermore, youth need to be able to take micro loans to invest in agriculture (land and inputs) and, youth need to be considered in agro-food business. In addition, youth need to be targeted in training programs, which could help them in commercializing farming. Youth would also benefit from being considered for other non-agriculture related training programs to encourage entrepreneurship as the qualitative data proposed that a livelihood consisted of both farming and small business was viewed as a prosperous combination. And perhaps most importantly, youth need to be recognized beyond the definition of ages. They need to have access to forums where they are able to express their current needs, challenges and future aspirations at local level as well as at higher levels in the society. It needs to be recognized that youth are not a homogenous group and these variations of opinions need to be recognized.
The study was funded through the project 'Equity and Institutions in Sustainable Africa Intensification’ [grant number S-69], which is part of the Sustainable Intensification of Agricultural Research and Learning in Africa (SAIRLA) program funded by the UK Department for International Development. It also draws on data collected as part of the DFID-ESRC Growth Research Program, jointly funded by the UK Department for International Development (DFID) and ESRC [grant number ES/L012014/1]. This work was supported by Vetenskapsrådet [Fattigdomseffekter av diversifiering av inkomster, Genus och fattigdomsreducerande jordbrukstillväxt, grant number E0384801].
All authors declare no conflicts of interest in this paper.
| [1] | UN (United Nations) (2015) Youth Population Trends and Sustainable Development. New York: UN Department of Economic and Social Affairs, Population Division, Population Facts 2015/1. |
| [2] | UN (United Nations) (2013) World Population Prospects: The 2012 Revision, Highlights and Advance Tables. New York: UN Department of Economic and Social Affairs, Population Division, Working Paper No. ESA/P/WP.228. |
| [3] | Urdal H (2006) A clash of generations? Youth bulges and political violence. Int Stud Q 50: 607-629. |
| [4] | Alfy A (2016) Rethinking the youth bulge and violence. IDS Bull 43: 99-116. |
| [5] | Kilimani N (2017) Accelerating Progress towards Achieving Productive Youth Employment and Decent Work. Brighton: Institute of Development Studies, IDS Policy Briefing Issue 136. |
| [6] | URT (The United Republic of Tanzania) (2016) National Strategy for Youth Involvement in Agriculture (NSYIA) 2016-2021. Dodoma: Ministry of Agriculture, Livestock and Fisheries. |
| [7] | World Bank and IFAD (2017) Rural Youth Employment. World Bank and the International Fund for Agricultural Development. |
| [8] | AGRA (Alliance for a Green Revolution in Africa) (2015) Africa Agriculture Status Report: Youth in Agriculture in Sub-Saharan Africa. Alliance for a Green Revolution in Africa Issue No. 3, Nairobi. |
| [9] | Ripoll S, Andersson J, Badstue L, et al. (2017) Rural transformation, cereals and youth in Africa: What role for international agricultural research? Outlook Agric 46: 168-177. |
| [10] | Sumberg J, Okali C (2013) Young people, agriculture, and transformation in rural Africa: An "opportunity space" approach. Innovations 8: 259-269. |
| [11] | UN (United Nations) (2015) Transforming Our World: The 2030 Agenda for Sustainable Development. New York: United Nations General Assembly, A/RES/70/1. |
| [12] | World Population Review (2019) Country specific data. Available from: http://worldpopulationreview.com/countries/tanzania-population/. |
| [13] | Haji M (2015) Youth Employment in Tanzania: Taking stock of the evidence and knowledge gaps. Ottawa: International Development Research Centre and the MasterCard Foundation. |
| [14] | UN (United Nations) (2019) Available from: https://population.un.org/wpp/DataQuery/. |
| [15] | UN (United Nations) (2015) World Population Prospects: The 2015 Revision, Key Findings and Advance Tables. New York: Department of Economic and Social Affairs, Population Division, Working Paper No. ESA/PWP.241. |
| [16] | World Bank (2019) World Bank data. Available from: https://data.worldbank.org/indicator/SP.POP.GROW?locations=TZ. |
| [17] | UN (United Nations) (2017) Drivers of Migration and Urbanization in Africa: Key Trends and Issues. New York: Department of Economic and Social Affairs, Population Division, UN/POP/EGM/2017/12. |
| [18] | NBS (National Bureau of Statistics) (2014) Population Distribution by Age and Sex 2013. 2012 Population and Housing Census, Volume II, Dar es Salaam: National Bureau of Statistics. |
| [19] | White B (2012) Agriculture and the Generation Problem: Rural Youth, Employment and the Future of Farming. IDS Bull 43: 9-19. |
| [20] | Commonwealth Secretariat (2016) Global Youth Development Index and Report 2016. London: Commonwealth Secretariat. |
| [21] | URT (The United Republic of Tanzania) (2007) National Youth Development Policy. Dar es Salaam: Ministry of Labour, Employment and Youth Development. |
| [22] | Msuya E, Isinika AC, Dzanku FM (2018) Agricultural intensification response to agricultural input subsidies in Tanzania: A spatial-temporal and gender perspective, 2002-15. In: Djurfeldt AA, Dzanku, FM, Isinika, AC (Eds.), Agriculture, Diversification, and Gender in Rural Africa, Longitudinal Perspectives from Six Countries. Oxford: Oxford University Press, 137-157. |
| [23] | Djurfeldt AA, Djurfeldt G, Hillbom E, et al. (2019) Is there such a thing as sustainable intensification in smallholder-based farming in sub-Saharan Africa? Understanding yield differences in relation to gender in Malawi, Tanzania and Zambia. Develop Stud Res 6: 62-75. |
| [24] | URT (The United Republic of Tanzania) (2013) National Agricultural Policy, 2013. Ministry of Agriculture, Food Security and Cooperatives, Dar es Salaam. |
| [25] | Pretty J, Toulmin C, Williams S (2011) Sustainable intensification in African agriculture. Int J Agric Sustainability 9: 5-24. |
| [26] | Pretty J, Benton TG, Bharucha ZP, et al. (2018) Global assessment of agricultural system redesign for sustainable intensification. Nat Sustainability 1: 441-446. |
| [27] | Sumberg J, Anyidoho NA, Leavy J, et al. (2012) Introduction: The young people and agriculture 'problem' in Africa. IDS Bull 43: 1-8. |
| [28] | IFAD (International Fund for Agricultural Development) (2019) Creating Opportunities for Rural Youth. 2019 Development Report, Rome: IFAD. |
| [29] | Djurfeldt AA, Dzanku, FM, Isinika, AC (2018) Agriculture, Diversification, and Gender in Rural Africa, Longitudinal Perspectives from Six Countries. Oxford: Oxford University Press. |
| [30] | FAO (Food and Agriculture Organization) (2005) A System of Integrated Agricultural Censuses and Surveys. World Programme for the Census of Agriculture 2005. Rome: FAO. |
| [31] | UN (United Nations) (2001) Implementation of the World Programme of Action for Youth to the Year 2000 and Beyond. New York: United Nations General Assembly, A/56/180. |
| [32] | Snyder KA, Sulle E, Massay DA, et al. (2019) "Modern" farming and the transformation of livelihoods in rural Tanzania. Agriculture and Human Values. Available from: https://doi.org/10.1007/s10460-019-09967-6. |
| [33] | Leavy J, Hossain N (2014) Who Wants to Farm? Youth Aspirations, Opportunities and Rising Food Prices. Brighton: Institute of Development Studies, IDS Working Paper 2014. |
| [34] | Suleiman R (2018) Local and regional variations in conditions for agriculture and food security in Tanzania: A review. AgriFoSe2030 report 10, 2018. |
| [35] | British Council (2016) Next Generation: Youth Voices in Tanzania. UK aid. |
| [36] | HRW (Human Rights Watch) (2017) "I Had a Dream to Finish School", Barriers to Secondary Education in Tanzania. Available from: https://www.hrw.org/report/2017/02/14/i-had-dream-finish-school/barriers-secondary-education-tanzania. |
| [37] | Unicef (2018) Education Budget Brief 2018 Tanzania: Key Messages and Recommendations. ISBN 978-9987-829-17-0. |
| [38] | World Bank (2019) World Bank data. Available from: https://data.worldbank.org/indicator/SE.SEC.ENRR?locations=TZ. |
| [39] | Lindsjö K, Wapulumuka M, Djurfeldt AA, et al. (2020) Generational dynamics of agricultural intensification in Malawi: Challenges for the youth and elderly smallholder farmers. Int J Agric Sustainability 2020: 1721237. |
| [40] | Djurfeldt, AA, Kalindi A, Lindsjö K, et al. (2019) Yearning to farm—Youth, agricultural intensification and land in Mkushi, Zambia. J Rural Stud 71: 85-93. |
| 1. | Agnes Andersson Djurfeldt, Living standards and land – longitudinal village level perspectives from five African countries: broad based improvements amid rural differentiation, 2022, 0306-6150, 1, 10.1080/03066150.2022.2099738 | |
| 2. | Fanuel K. Letting, Pavithravani B. Venkataramana, Patrick A. Ndakidemi, Farmers’ Participatory Plant Selection of Lablab (Lablab purpureus (L.) Sweet) in Tanzania, 2022, 13, 1664-462X, 10.3389/fpls.2022.784032 | |
| 3. | Daudi Moses Msengi, Adam Akyoo, The Nexus Between Age Groups, Gender Dynamics of Smallholder Maize Farmers, and Poverty Status in Tanzania, 2023, 2196-8799, 10.1007/s40609-023-00327-1 | |
| 4. | Uchechukwu Charles Osu, Oluwafemi Sunday Farinde, Olakunle Titus Ajiye, Youths’ Participation in Community Development Project in Ibadan Oyo State, 2023, 01, 29600006, 04, 10.59231/edumania/8992 | |
| 5. | Min Bai, Youth Entrepreneurship in Agribusiness Sector in Tanzania, 2024, 1556-5068, 10.2139/ssrn.5051544 |
Figures(1) / Tables(4)

Karin Lindsjö, Agnes Anderssonc Djurfeldt, Aida Cuthbert Isinika, Elibariki Msuya. Youths' participation in agricultural intensification in Tanzania[J]. AIMS Agriculture and Food, 2020, 5(4): 681-699. doi: 10.3934/agrfood.2020.4.681

| Age of farm manager | 2002 | 2008 | 2013 | 2018 |
| 18–35 | 41.4 | 29.6 | 12.8 | 8.6 |
| 36–64 | 49.4 | 58.6 | 71.5 | 72.4 |
| 65 and above | 9.3 | 11.8 | 15.6 | 19 |
DownLoad:
CSV
| Age group | 2000–2002 | 2006–2008 | 2013–2015 | 2016–2018 | 2000–2002 to 2006–2008 | 2006–2008 to 2013–2015 | 2013–2015 to 2016–2018 | |||
| Diff. | Sig. | Diff. | Sig. | Diff. | Sig. | |||||
| 18 to 35 | 987 | 1150 | 1281 | 881 | 163 | 131 | -400 | ** | ||
| 36 to 64 | 915 | 1299 | 1509 | 1449 | 384 | *** | 210 | ** | -60 | |
| 65 and above | 849 | 1256 | 1201 | 1165 | 407 | ** | -55 | -36 | ||
| Total | 936 | 1253 | 1433 | 1338 | 316 | *** | 180 | ** | -95 | |
DownLoad:
CSV
| Age group | 2002 | 2008 | 2013 | 2018 |
| 18–35 | 20 | 27 | 14 | 19 |
| 36–64 | 19 | 27 | 21 | 37 |
| 65 and above | 9 | 24 | 21 | 28 |
| Total | 18 | 27 | 20 | 34 |
DownLoad:
CSV
| Yields, rice kg/ha | Yield changes over time | |||||||||
| Age group | 2000–2002 | 2006–2008 | 2013–2015 | 2016–2018 | 2000–2002 to 2006–2008 | 2006–2008 to 2013–2015 | 2013–2015 to 2016–2018 | |||
| Diff. | Sig. | Diff. | Sig. | Diff. | Sig. | |||||
| 18 to 35 | 1636 | 1871 | 2435 | 2917 | 235 | 564 | ** | 482 | ||
| 36 to 64 | 1422 | 1689 | 2392 | 2432 | 266 | * | 704 | *** | 39 | |
| 65 and above | 1553 | 1516 | 1722 | 1837 | -37 | 206 | 115 | |||
| Total | 1520 | 1734 | 2301 | 2391 | 215 | ** | 567 | *** | 90 | |
DownLoad:
CSV
| Age of farm manager | 2002 | 2008 | 2013 | 2018 |
| 18–35 | 41.4 | 29.6 | 12.8 | 8.6 |
| 36–64 | 49.4 | 58.6 | 71.5 | 72.4 |
| 65 and above | 9.3 | 11.8 | 15.6 | 19 |
| Age group | 2000–2002 | 2006–2008 | 2013–2015 | 2016–2018 | 2000–2002 to 2006–2008 | 2006–2008 to 2013–2015 | 2013–2015 to 2016–2018 | |||
| Diff. | Sig. | Diff. | Sig. | Diff. | Sig. | |||||
| 18 to 35 | 987 | 1150 | 1281 | 881 | 163 | 131 | -400 | ** | ||
| 36 to 64 | 915 | 1299 | 1509 | 1449 | 384 | *** | 210 | ** | -60 | |
| 65 and above | 849 | 1256 | 1201 | 1165 | 407 | ** | -55 | -36 | ||
| Total | 936 | 1253 | 1433 | 1338 | 316 | *** | 180 | ** | -95 | |
| Age group | 2002 | 2008 | 2013 | 2018 |
| 18–35 | 20 | 27 | 14 | 19 |
| 36–64 | 19 | 27 | 21 | 37 |
| 65 and above | 9 | 24 | 21 | 28 |
| Total | 18 | 27 | 20 | 34 |
| Yields, rice kg/ha | Yield changes over time | |||||||||
| Age group | 2000–2002 | 2006–2008 | 2013–2015 | 2016–2018 | 2000–2002 to 2006–2008 | 2006–2008 to 2013–2015 | 2013–2015 to 2016–2018 | |||
| Diff. | Sig. | Diff. | Sig. | Diff. | Sig. | |||||
| 18 to 35 | 1636 | 1871 | 2435 | 2917 | 235 | 564 | ** | 482 | ||
| 36 to 64 | 1422 | 1689 | 2392 | 2432 | 266 | * | 704 | *** | 39 | |
| 65 and above | 1553 | 1516 | 1722 | 1837 | -37 | 206 | 115 | |||
| Total | 1520 | 1734 | 2301 | 2391 | 215 | ** | 567 | *** | 90 | |
