


Figure 1.
Frances baard district municipality map.
Citation: Y.T. Bahta. Smallholder livestock farmers coping and adaptation strategies to agricultural drought[J]. AIMS Agriculture and Food, 2020, 5(4): 964-982. doi: 10.3934/agrfood.2020.4.964
| [1] | Lindie V. Maltitz, Yonas T. Bahta . Empowerment of smallholder female livestock farmers and its potential impacts to their resilience to agricultural drought. AIMS Agriculture and Food, 2021, 6(2): 603-630. doi: 10.3934/agrfood.2021036 |
| [2] | Robert Ugochukwu Onyeneke, Chinyere Augusta Nwajiuba, Chukwuemeka Chinonso Emenekwe, Anurika Nwajiuba, Chinenye Judith Onyeneke, Precious Ohalete, Uwazie Iyke Uwazie . Climate change adaptation in Nigerian agricultural sector: A systematic review and resilience check of adaptation measures. AIMS Agriculture and Food, 2019, 4(4): 967-1006. doi: 10.3934/agrfood.2019.4.967 |
| [3] | Isaac Busayo Oluwatayo . Towards assuring food security in South Africa: Smallholder farmers as drivers. AIMS Agriculture and Food, 2019, 4(2): 485-500. doi: 10.3934/agrfood.2019.2.485 |
| [4] | Hashim Durrani, Ainuddin Syed, Amjad Khan, Alam Tareen, Nisar Ahmed Durrani, Bashir Ahmed Khwajakhail . Understanding farmers' risk perception to drought vulnerability in Balochistan, Pakistan. AIMS Agriculture and Food, 2021, 6(1): 82-105. doi: 10.3934/agrfood.2021006 |
| [5] | W. Mupangwa, I. Nyagumbo, E. Mutsamba . Effect of different mulching materials on maize growth and yield in conservation agriculture systems of sub-humid Zimbabwe. AIMS Agriculture and Food, 2016, 1(2): 239-253. doi: 10.3934/agrfood.2016.2.239 |
| [6] | Milka N. Kiboi, Felix K. Ngetich, Daniel N. Mugendi . Nitrogen budgets and flows in African smallholder farming systems. AIMS Agriculture and Food, 2019, 4(2): 429-446. doi: 10.3934/agrfood.2019.2.429 |
| [7] | Angelina De Pascale, Carlo Giannetto, Agata Zirilli, Angela Alibrandi, Maurizio Lanfranchi . How Mediterranean winegrowers perceive climate change. AIMS Agriculture and Food, 2023, 8(2): 440-460. doi: 10.3934/agrfood.2023023 |
| [8] | Danar Praseptiangga, Jessica M. Guevara Zambrano, Adhitya Pitara Sanjaya, Dimas Rahadian Aji Muhammad . Challenges in the development of the cocoa and chocolate industry in Indonesia: A case study in Madiun, East Java. AIMS Agriculture and Food, 2020, 5(4): 920-937. doi: 10.3934/agrfood.2020.4.920 |
| [9] | Yemane Asmelash Gebremariam, Joost Dessein, Beneberu Assefa Wondimagegnhu, Mark Breusers, Lutgart Lenaerts, Enyew Adgo, Steven Van Passel, Amare Sewnet Minale, Amaury Frankl . Listen to the radio and go on field trips: A study on farmers' attributes to opt for extension methods in Northwest Ethiopia. AIMS Agriculture and Food, 2024, 9(1): 3-29. doi: 10.3934/agrfood.2024002 |
| [10] | Jahanara Akter, Sadia Islam Nilima, Rakibul Hasan, Anamika Tiwari, Md Wali Ullah, Md Kamruzzaman . Artificial intelligence on the agro-industry in the United States of America. AIMS Agriculture and Food, 2024, 9(4): 959-979. doi: 10.3934/agrfood.2024052 |
Agricultural drought1 is adversely affecting agricultural production, including livestock production in Africa. Climate change might challenge the existence of livestock production systems, making transitions inevitable [1]. Many farmers in Sub-Saharan Africa, including South Africa, are vulnerable to agricultural drought due to their limited coping strategies and limited resources [2]. Farmers adopt different coping strategies to address agricultural drought. Coping strategies are remedial actions utilized by farmers mostly in short periods, to survive when unexpected agricultural drought strikes and livelihoods are threatened. Eriksen et al. [3] describe coping strategies as the actions and activities that take place within existing structures and systems and the adoption of different strategies reduces economic, environmental, and social vulnerability. These strategies include the efficient use of skills, exploration of opportunities challenging the effect of agricultural drought, and effectively utilising and managing resources in drought and normal seasons. Caldwell and Boyed [5] emphasized that attributes such as education, information, support from social networks, neighbours, and community resources contribute to more adaptive coping among farmers.
1 Agricultural drought is the lack of precipitation during the growing season, which impinges on ecosystem function in general due to soil moisture drought (cited by Mare et al. [4]).
Adaptation to climate change including agricultural drought is highly local, and its effectiveness depends on local and extra-local institutions through which incentives for individual and collective action are structured. Not only have existing institutions affected how rural residents responded to environmental challenges in the past, but they are also the fundamental mediating mechanisms that will translate the impact of external interventions to facilitate adaptation to climate change (agricultural drought) in the future. Historical experience and knowledge about adaptation possibilities are crucial to future policy formulation regarding adaptation. This is because the specific nature of climate change impacts continues to be uncertain (especially for small territorial units), even though it is evident that the general impacts of climate change will be striking and long-lasting if current trends continue [6].
Agricultural drought intensity, duration, and occurrence season affect agricultural production in various provinces of South Africa including the Northern Cape Province of South Africa. In South Africa, 2015 was declared the driest year on record since 1904 [4]. Prolonged droughts are regular and recurrent features affecting smallholder farmers and are one of the most important natural disasters in economic, social, and environmental terms. In terms of intensity, frequency, regularity, and predictability, the dynamics of climate impacts are related to the vulnerability of groups experiencing them [6]. The economic damage caused by agricultural drought in 2015 in South Africa accounted for 2 billion US Dollars in 2015. Agricultural production declined by 8.4% during the year 2015 and was attributed to drought conditions. The livestock industry (cattle and sheep) was one of the industries that were severely affected by drought, with a reduction of 15% in the national herd [7]. Maltou and Bahta [8] highlighted that the number of livestock in South Africa declined by 1.21% Compound Annual Growth Rate from 44.4 million of livestock numbers in 2012 to 42.3 million of livestock numbers in 2016 due to agricultural drought.
Considering that agriculture is the main source of income for most smallholder farmers, analysis of coping strategies is important to enhance the resilience of the agriculture sector. Recent international and national studies focus on various aspects of smallholder farmers coping with climate stress [3-7;9-15]. Some studies analysed how agro-pastoralists adopt their livestock production to climate variability and build and strengthen their adaptive capacity. Factors that affect the choice of coping strategies, the impact of climate change on agriculture (crops) and current adaption efforts by government and farmers, analysed the cyclone impacted and strategies farmers utilized; develop an activity-based adaptation index and behavioural change among smallholder farmers towards adaptation. The studies did not, however, determine in three seasons (before 2015–2016, 2015–2016, and 2016–2018) coping strategies of smallholder livestock farmers to agricultural drought. Therefore, the present study attempts to fill this gap in knowledge and literature. South Africa faced the worst drought in history since 1982 in the 2015–2016 season, before the 2015–2016 and 2016–2018 season the agricultural drought needs to assess to have a clear picture on the coping and adaption strategies. Therefore, the objective of this study was to determine the before 2015–2016, 2015–2016, and 2016–2018 agricultural drought season coping and adaption strategies of smallholder2 livestock farmers to agricultural drought in the Northern Cape Province of South Africa. Such findings will help policymakers in formulating appropriate policy interventions to sustain smallholder livestock farmers against drought exposure, which threatens livelihoods, food security, survival, and achieving the Sustainable Development Goal (SDG) of ending hunger and poverty by 2030.
2 Smallholder farmers have subsistence livestock enterprises, completely relying on family labour and have limited resource endowment as compared to commercial farmers [16].
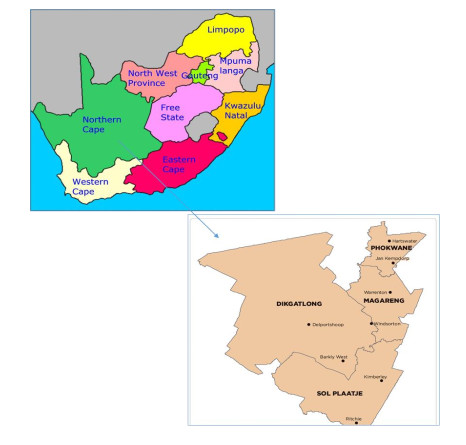
The Northern Cape Province is the largest province from South Africa, covering 36 million hectares (29.5%) of South Africa’s total land area. This study focussed on the France Baard District Municipality (FBDM), consisting of four local district municipalities, namely Dikgatlong, Magareng, Phokwane, and Sol Plaatje (Figure 1). According to the 2011 census, the FBDM has a population of 382,087 with 95,931 households (3.98 people per household), making up 31.8% of the Northern Cape population. The local municipalities of Dikgatlong, Magareng, Phokwane, and Sol Plaatje had a population size of 46,842, 24,203, 63,000, and 248,042 respectively [17]. Setswana, Afrikaans, English, and IsiXhosa are the dominant languages in the district [18].
The Northern Cape climate is characterized by heat in the summer (between 30 ℃ and 40 ℃) and cold winters (below zero nightfall temperatures and frost). Coupled with low rainfall (mean precipitation of 200 mm annually), the climate is dry and relentless. Rainfall increases from west to east with areas in the west reporting a mere 20 mm (annual average) to the east receiving up to 540 mm average in a year. The Frances Baard district has an average annual rainfall of approximately 350 mm [19]. The recent prevailing drought in the Northern Cape has reached disastrous levels, crippling the agricultural sector in the province and recovery has been slow or non-existent [20]. Many districts have experienced shortfalls in rainfall and the persistent high temperatures experienced exacerbated the drought. A lack of fodder and water for livestock production has placed the industry under enormous stress [19]. The suffering of smallholder farmers has been escalated due to numerous factors such as poor grazing, water management, overgrazed, lack of infrastructure (fences, water points, etc. and poor maintenance of existing infrastructure), lack of credit. Matlou and Bahta [8] indicate that smallholder farmers in the Northern Cape are particularly exposed to drought due to their increased levels of vulnerability and minimum coping capacity. They find themselves in a permanent state of drought and are trapped in a vicious cycle most of them are unable to escape.
Mining and agriculture are the two main contributors to the economy of the Northern Cape. Rich in minerals, the famous Big Hole is found in Kimberley where hand-operated diamond-mining took place between 1871 and 1914. The Sishen mine near Kathu produces iron ore and copper mines are found in Springbok, Okiep, and Aggenys [21].
The agricultural sector comprises mainly of extensive commercial livestock farming with communal farming concentrated in the rural municipal areas. The fertile Orange River area provides valuable irrigation to grape and fruit farmers with wheat, maize, peanuts, cotton, and Lucerne closer to Douglas and Prieska [22]. A variety of agricultural production takes place in the Northern Cape Province of South Africa due to the vast difference in climate between the regions, 15.2% of South Africa’s groundnuts were produced in the province in the 2016/2017 season as well as 11.3% of the country’s wheat [21]
Livestock production remains the main enterprise with ±75% of agricultural households farming [23]. In the context of South Africa, the Northern Cape produces approximately 4% of the country’s cattle, 24% of the sheep, 7% of the goats, and 1.4% of the chickens [23]. Smallholder farmers contribute substantially to the rural economy and are considered to be the channel through which rural development can be expedited and poverty can be alleviated [24].
Tourism contributes to the economy with many popular attractions such as the Big Hole, Namaqualand flowers, Richtersveld, Kgalagadi Transfrontier Park, Augrabies Falls National Park, the Kalahari, and the Karoo – all offering a variety for tourists to see and experience [25].
A multiple-stage sampling technique was employed. Firstly, the Northern Cape Province was chosen from the nine provinces of South Africa, because the province had predominantly livestock farming and was declared a disaster zone by the South African government in the 2017/2018 dry spell. Secondly, FBDM was randomly selected and four district municipalities were included (Dikgatlong, Magareng, Sol Plaatjie, and Phokwane).
Two hundred and seven smallholder livestock farmers were selected from 868 livestock farmers who had received assistance because no records were indicating the number of smallholder livestock farmers in the study area. As a result, the number of smallholder farmers that were assisted during the 2015/2016 was used as the population to determine sample size. Face-to-face interviews were conducted from July to September 2018 using a structured questionnaire. The questionnaire included socio-economic and institutional characteristics as well as coping strategies utilised during the worst drought 2015–2016, before 2015–2016, and then during the 2016–2018 season. This was supplemented by focus group discussions during the African Farmers’ Association of South Africa (AFASA) conference in Kimberly, Northern Cape province, in 2018 with six groups (consist of five members) of small livestock farmers with the assistance of two extension officers. The detailed calculation of appropriate sample sizes for a survey, in this case, 207 selected from 868 smallholder farmers is available in (Appendix 1 and Table 1.1).
The collected data were analysed using a multinomial probit model to determine before 2015–2016, 2015–2016, 2016–2018 agricultural drought season coping strategies of smallholder livestock farmers to agricultural drought. Constrained and unconstrained versions of the covariance matrix of the multivariate normal distribution of error term were incorporated in a multinomial probit model [26].
The multinomial probit model is used when there are several possible categories that the dependent variable can fall into for coping strategies during 2015–2016, before 2015–2016, 2016–2018 agricultural drought season. The coping strategies choice model concerns the decision made by smallholder livestock farmers c=1,2…….,C of the alternative d in the set pc=(1,…….,d), which produces the highest utility level (Scd). Thus, Sc1<Scd.∀dϵpc, in this notation indicates the choice set is allowed to vary across individuals to account for their specific coping strategy. Before 2015–2016 agricultural drought coping strategy choices 1, 2, 3, 4, 5, and 6 denoted: stopping farm activities3, produced less livestock production, sold livestock, sold assets, obtained credit from a bank, and combinations of other strategies. The 2015–2016 agricultural drought (this period was the worst drought South Africa faced since 1982 and it was declared by the South Africa government, the Northern Cape province as a disaster area) coping strategy choice 1, 2, 3, 4, 5, and 6 denoted: selling livestock production, buying more livestock, stopping farming activities, obtained credit, and a combination of strategies respectively. During the 2016–2018 agricultural drought season coping strategies 1, 2, 3, 4, 5, and 6 denoted: migrate, seeking food assistance, sold livestock, looked a job other than farming, leased part of the farm, and a combination of other strategies (Table 1).
| Variable | Description |
| Dependent Variable: | |
| cd | Before 2015–2016 agricultural drought season coping strategies—stopping farm, produce less livestock production, sell livestock, sell the asset, obtain credit from the bank, and a combination of strategies.During the 2015–2016 agricultural drought season (this period was the worst drought South Africa faced since 1982 and the Northern Cape province declared a disaster area by the South Africa government) - selling livestock production, sell the asset, buy more livestock, stopping farming, obtain credit, and combinations of strategies.During the 2016–2018 agricultural drought season -migrate, seeking food assistance, sell livestock, looking a job other than farming, lease part of the farm, and a combination of strategies. |
| Explanatory variables: | |
| ED | educational level |
| FE | farming experience |
| IN | source of income (off-farm activities, farm, and others) |
| LO | land ownership (rented, purchased, customary, others) |
| RV | equal 1 if the river is nearby, 0 if Not |
| OW | equals 1 if there other sources of water nearby, 0 if Not |
| COP | equals 1 if the livestock farmers a member of a cooperative, 0 if Not |
| WINF | source of weather information (newspaper, radio, friends, social media, and others) |
| RED | equal 1 if smallholder farmers ready and prepared for drought, 0 if Not |
| ENS | equals 1 if farmers receive the necessary support from the government and different stakeholder, 0 if Not |
| NAS | equals 1 if farmers receive the necessary support from neighbours, 0 if Not |
| CCOL | equals 1 if farmers received assistance from the community and their social network, 0 if Not |
| CPL | equals 1 if the community involved in drought strategy planning, 0 if Not |
| PGAS | equals 1 if farmers received assistance from the government in the past, 0 if Not |
| GOVI | equals 1 if the government interest and willingness in involving in agricultural drought activities, 0 if Not |
| GOVTR | equals 1 if the smallholder farmers receive training from government or different stakeholders, 0 if Not |
| GOVPOOL | equals 1 if the government or different stakeholder have effective communication with smallholder farmers in disseminating policies and other important announcements, 0 if Not |
| α0cd | constant term |
| α1cd,α2cd…α17cd | coefficients of the explanatory variables in the model |
| ecd | disturbance term |
| Source: Author observation. | |
 DownLoad:
CSV
DownLoad:
CSV
3 Stopping farm- means farmers gave up due to the agricultural drought and ending livestock farm; Sell livestocklivestock farmers start selling livestock due to agricultural drought before they die of hunger; Sell the asset-farmers sell assets other than livestock to surviving in order to sustain in their livestock farming during the drought and Livestock reduction- refer due to the consequence of agricultural drought-the farmers are not encouraged to expand their farming.
Selling livestock was chosen as the base category before 2015–2016, 2015–2016 and 2016–2018 agricultural drought seasons coping and adoption strategies because most of smallholder livestock farmers chose these strategies. The individual decision was based on the differences between utility derived from the other drought coping strategies and the base category (selling livestock and buying more livestock). This can be represented as:
| U∗cd=Scd−Scd | (1) |
Where U∗cd denotes unobservable choice made Uc=d, when individual c choose option d. If individual c makes choice d, if U∗cd<0 for d=1,….,d, then farmer Uc chooses the base category option (selling livestock) and Uc=0. Otherwise, farmer c’s makes a choice, which yields the highest value for U∗cd and Ucd=d. Assuming that each farmer c faces the same d alternatives, a multinomial probit model formulation based on linear-in-parameters utilities is written as follows:
| Scd=Zcdβ+ϵcd,ϵcdN(0.∑) | (2) |
| Ucd={1ifScd≤Scdforc=1,…….,C;d=1…..,D0otherwise | (3) |
The variable Ucd denotes the choice made by a farmer is the unobservable utility of alternative as perceived by individual c, Zcd is a (1 × W) vector explanatory variables characterizing both alternative d and the individual c. β is a (W × 1) vector of fixed parameters and finally, ϵcd is a normally distributed random error term of mean zero assumed to be correlated with the errors associated with the other alternatives d, d = 1, ..., d, d ≠ c; and covariance matrix of:
| ∑=Cov(ϵc=(α11α12α13α21α22α23α31α32α33) | (4) |
With αcd>0,∀d(positive definiteness). The predicted probability of choosing any of the coping strategies choices represented with the following equations (5)–(9):
| Y(uc=1)Y(Sc1+ϵc1>Sc2+ϵc2andSc1+ϵc1>Sc3+ϵc3 | (5) |
| Y(uc=2)Y(Sc2+ϵc2>Sc1+ϵc1andSc2+ϵc2>Sc3+ϵc3 | (6) |
| Y(uc=3)Y(Sc3+ϵc3>Sc1+ϵc1andSc3+ϵc3>Sc2+ϵc2 | (7) |
| Y(uc=4)Y(Sc4+ϵc4>Sc1+ϵc1andSc4+ϵc4>Sc5+ϵc5 | (8) |
| Y(uc=5)Y(Sc5+ϵc5>Sc1+ϵc1andSc5+ϵc5>Sc4+ϵc4 | (9) |
Assuming that the response categories are mutually exclusive and exhaustive, then ∑dd=1Ycd=1. For each c, the probabilities add up to one for each individual and we have only D-1 parameters. This implies that equation (5) + (6) + (7) + (8) + (9) = 1 which is rewritten as:
| Y(uc=1)+Y(uc=2)+Y(uc=3)+Y(uc=4)+Y(uc=5)=1 | (10) |
Multinomial probit is adopted to avoid limitations of the simpler multinomial Logit, i.e., makes nonsensical predictions, since the dependent variable is not continuous, recoding the dependent variable can give different results. Multinomial probit has to estimate correlation if choices are large and the number of such correlation grows huge. Therefore, multinomial probit is designed to be used only if the options are relatively small [27]. Empirically, the multinomial probit regression can be written as follows:
| Rcd=α0cd+α1cdEDcd+α2cdFEcd+α3cdINcd+α4cdLOcd+α5cdRVcd+α6cdOWcd+α7cdCOPcd+α8cdWINEcd+α9cdREDcd+α10cdENScd+α11cdNAScd+α12cdCCOLcd+α13cdCPLcd+α14cdPGAScd+α15cdGOVIcd+α16cdGOVTRcd+α17cdGOVPOOLcd+ecd | (11) |
The description of the outcome and independent variables are depicted in Table 1.
Coping strategies are remedial actions undertaken by people and communities whose livelihoods are threatened. This involves managing resources both during drought and in normal times to withstand the effects of drought risk. Thus, the question “What kind of coping strategies utilize by smallholder livestock farmers when they face the worst drought in the 2015–2016, before 2015–2016 and 2016–2018 season agricultural drought situation? ” was posed. This question was asked in the focus group and individual interviews. A list of coping strategies was derived from this exercise are depicted in Table 1. The coping strategies were also selected from expert opinions, observations, importance, and literature such as the Sustainable Livelihood Framework (SLF) of the Department for International Development (DFID) [28], see (Figure 2). The SLF portrays how the vulnerability context shapes people’s ability to survive and earn a living and the various levels of vulnerability are determined by factors such as their coping capacities that are directly linked to their coping and adaptation [29]. One of the vulnerability contexts is push factors (such as agricultural drought) that drive farmers to migration (as one of coping strategy). However, livelihood capitals such as human, natural, social, financial, and physical capital, can also influence coping strategies. The farmers may lack certain capitals and, together with how they are exposed to hazards, such as agricultural drought. The policies, processes in the form of government and other structures, laws, regulations, and the culture of the specific community, all influence survival of farmers. These policies and institutional processes affect the coping strategies devised, and therefore influence the ultimate livelihood outcomes of a community. The Sustainable Livelihood Framework emphasises strategies for survival and prosperity, which are dependent on the ability of individuals or a community to capitalise on the opportunities and resources at their disposal.
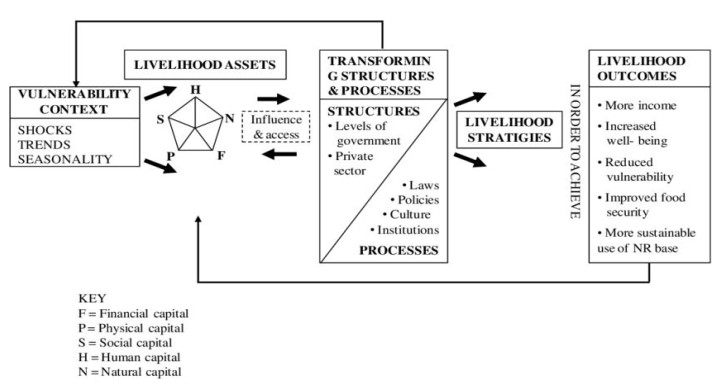
Table 2 presents a summary of the socio-economic characteristics of the respondents. The average age of the respondents was 55 years (median 56 years). The highest proportion of the respondents were married (67%), followed by single (20%), widowed (11%), and divorced (2%). Most (97%) respondents had households comprising 1–5 members. Most respondents were men (81%), which implied a gender stereotype that existed in animal husbandry, ownership, and control of income from livestock sales. Almost half (48%) of the respondents attended high school and 11% had no formal schooling. The average farming experience was 12 years. Twenty five percent of respondents owned sheep, 30% owned goats, and 45% owned cattle.
| Characteristics | Sub-characteristics | Frequency | Mean | Median | Minimum | Maximum |
| Age | 18–40 | 33(16%) | 55 | 56 | 21 | 89 |
| 40–65 | 120 (58%) | |||||
| > 65 | 54 (26%) | |||||
| Marital status | Single | 41(20%) | ||||
| Married | 138 (67%) | |||||
| Widow | 24 (11%) | |||||
| Divorce | 4 (2%) | |||||
| Households Size | 1–5 | 201 (97%) | 2 | 1 | 1 | 11 |
| 5–10 | 4 (2%) | |||||
| > 10 | 2 (1%) | |||||
| Gender | Male | 168 (81%) | ||||
| Female | 39 (19%) | |||||
| Education level | No schooling | 23 (11%) | 8 | 8 | 0 | 16 |
| Elementary | 65 (32%) | |||||
| high school | 100 (48%) | |||||
| Diploma | 10 (5%) | |||||
| Degree | 9 (4%) | |||||
| Farm experience | 1–10 | 119 (58%) | 12 | 10 | 1 | 40 |
| 10–20 | 63 (30%) | |||||
| > 20 | 25 (12%) | |||||
| No. of livestock | Cattle | 4300 (45%) | ||||
| Sheep | 2425 (25%) | |||||
| Goat | 2928 (30%) | |||||
| Source: Author calculation. | ||||||
DownLoad:
CSV
The analysis was done to see the coping strategies of the 2015/2016 season as a benchmark because South Africa in general and the Northern Cape province of South Africa in particular face the worst drought in South Africa history since 1982 and the province declared a disaster area by the South African government. Hence it is necessary to look at the coping strategies before this benchmark as before 2015–2016 and after the benchmark as 2016–2018 to assess the strategies adopting and choice of strategies in this three-time frame (Table 1). After the worst drought 2015/2016, some farmers migrate, seeking food assistance and job and leasing their farm. This indicates the severity of the drought during 2015/2016.
During the worst drought in 2015/2016, 1.4% of farmers taking advantage of the low price of livestock and starting buying more livestock. Further, 5.9% of the farmer they stop livestock farming, 1.4% of livestock farmers selling their assets to survive during the worst drought season of 2015/2016, this implies how is the extent of the agricultural drought in the study area and there were a very limited coping and adaption choices due to the low level of resources or livelihood assets available to smallholder livestock farmers in vulnerable situations.
Almost two-thirds (64.2%) of the respondents coped before the 2015–2016 agricultural drought season by selling their livestock. Other coping strategies included livestock production reduction (15.5%), 2.9% stopped farming, 0.5% sold their assets, 1% used banks as a source of borrowing money and 15.9% used a combination of strategies. Respondents used slightly different coping strategies during 2015–2016 (refer to Table 3). Respondents (60.9%) sold their livestock, 5.9% stopped livestock production, 1.4% sold their assets, and 30.4% used a combination of strategies, however, 1.4% of the respondents bought more livestock. During the 2016–2018 drought period, 53.6% of the respondents sold their livestock, 5.8% looked for alternative employment or diversified, 4.9% needed assistance in the form of food and fodder, 1.4% leased part of their farm, 1% migrated to other provinces and 33.3% used a combination of strategies. This implied that few respondents employed diversification in their livelihoods, which left them vulnerable to agricultural drought. To minimize the effect of agricultural drought, diversifying livelihood strategies through income-generating activities within and outside agriculture is required. This is highlighted by Jordaan et al. [30] where important off-farm diversification minimizes the impact of agricultural drought.
| Before the 2015–2016 season strategies (DSP)-which coping strategy smallholder livestock farmers used before the 2015–2016 season? | ||||||||||
| Stop Farming | Reduce production | Sell assets | Credit from bank | Combinations of other strategies | ||||||
| Coefficient | P≥/z/ | Coefficient | P≥/z/ | Coefficient | P≥/z/ | Coefficient | P≥/z/ | Coefficient | P≥/z/ | |
| ED | 0.077 | 0.640 | −0.088 | 0.081* | 1.377 | 1.000 | −8.102 | 0.994 | −0.107 | 0.041** |
| FE | 0.023 | 0.827 | −0.033 | 0.269 | −0.825 | 1.000 | −0.276 | 1.000 | −0.059 | 0.091* |
| IN | −1.551 | 0.068* | 0.029 | 0.900 | 9.433 | 0.999 | 19.296 | 0.998 | 0.106 | 0.656 |
| LO | 0.937 | 0.158 | −0.081 | 0.638 | 2.534 | 1.000 | 27.158 | 0.997 | 0.151 | 0.436 |
| RV | −0.061 | 0.963 | 0.300 | 0.496 | −17.348 | . | −19.285 | 0.999 | −0.388 | 0.442 |
| OW | 2.542 | 0.598 | 0.102 | 0.920 | −19.976 | 1.000 | −29.935 | 0.999 | −1.094 | 0.238 |
| COP | −1.617 | 0.241 | −0.007 | 0.990 | 28.254 | 0.999 | 45.158 | 0.999 | 0.560 | 0.345 |
| WINF | −0.604 | 0.526 | 0.307 | 0.291 | 1.748 | 1.000 | 26.628 | 0.999 | −0.012 | 0.975 |
| RED | 1.639 | 0.300 | −0.385 | 0.342 | 17.742 | 0.999 | −19.100 | 0.999 | −0.007 | 0.986 |
| ENS | 0.749 | 0.525 | −0.046 | 0.936 | −23.423 | . | −5.196 | 1.000 | 0.241 | 0.676 |
| NAS | 1.168 | 0.450 | −0.219 | 0.742 | −16.715 | . | −129.665 | 0.999 | −0.047 | 0.947 |
| CCOL | 1.102 | 0.721 | −1.585 | 0.136 | 0.047 | . | 57.528 | 1.000 | 3.225 | 0.012** |
| CPL | −0.512 | 0.856 | 0.789 | 0.436 | −17.490 | . | −32.369 | 1.000 | −4.403 | 0.002*** |
| PGAS | 17.345 | 0.996 | −0.268 | 0.633 | −10.266 | 1.000 | −7.304 | 1.000 | −0.730 | 0.280 |
| GOVI | 13.740 | . | −0.237 | 0.730 | −11.091 | 1.000 | 3.181 | 1.000 | −0.940 | 0.216 |
| GOVTR | 29.281 | . | 1.006 | 0.186 | 12.349 | 1.000 | −139.452 | 0.999 | 0.977 | 0.269 |
| GOVPOL | −1.995 | 0.139 | −0.622 | 0.355 | 17.448 | 1.000 | 86.077 | 0.999 | 0.179 | 0.819 |
| Strategy during the 2015–2016 season (DSM)-Which coping strategies smallholder livestock farmers adopt during 2015–2016? | ||||||||||
| Buy more livestock | Reduce production | Sell assets | Combinations of other strategies | |||||||
| Coefficient | P≥/z/ | Coefficient | P≥/z/ | Coefficient | P≥/z/ | Coefficient | P≥/z/ | |||
| ED | −0.928 | 1.000 | −0.108 | 0.215 | 3.133 | 0.998 | −0.055 | 0.180 | ||
| FE | 0.104 | 1.000 | −0.006 | 0.284 | −9.321 | 0.993 | −0.059 | 0.026** | ||
| IN | 30.411 | 0.999 | −0.840 | 0.082* | 10.990 | 0.999 | 0.237 | 0.210 | ||
| LO | 14.382 | 0.999 | 1.083 | 0.015** | 15.036 | 0.998 | 0.223 | 0.127 | ||
| RV | 41.679 | 0.999 | 0.552 | 0.519 | −15.298 | 0.998 | 0.297 | 0.439 | ||
| OW | 1.385 | 1.000 | 2.168 | 0.363 | −63.009 | 1.000 | −0.888 | 0.270 | ||
| COP | −46.398 | 0.999 | −3.014 | 0.033** | −174.767 | . | 0.367 | 0.425 | ||
| WINF | 2.557 | 1.000 | 0.376 | 0.249 | −4.727 | 1.000 | 0.084 | 0.664 | ||
| RED | −11.388 | 1.000 | 1.197 | 0.149 | −19.675 | 0.998 | 0.138 | 0.687 | ||
| ENS | 47.495 | 0.999 | 0.843 | 0.352 | −33.920 | 0.996 | −0.391 | 0.409 | ||
| NAS | −51.995 | 0.998 | 0.719 | 0.555 | 124.365 | 0.994 | −0.346 | 0.536 | ||
| CCOL | −53.393 | 0.999 | −1.609 | 0.408 | −177.629 | . | 1.365 | 0.154 | ||
| CPL | 99.675 | 0.998 | 1.643 | 0.354 | 0.214 | . | −1.945 | 0.054* | ||
| PGAS | −39.342 | 0.999 | 1.269 | 0.260 | 114.230 | 0.994 | −0.937 | 0.086* | ||
| GOVI | 52.972 | 0.999 | −3.195 | 0.037** | 10.595 | 1.000 | −1.559 | 0.025** | ||
| GOVTR | −15.980 | 1.000 | 2.677 | 0.077* | 79.354 | 1.000 | 1.180 | 0.118 | ||
| GOVPOL | −8.563 | 1.000 | −0.542 | 0.587 | −76.140 | 0.996 | 1.068 | 0.083* | ||
| Strategy 2016–2018 season (DSC)- ich coping strategies farmers adopt during the 2016–2018 season? | ||||||||||
| Migrate | Ask assistance (food fodder) | Looking for a job (off-farm) | Lessee par of farm | Combinations of other strategies | ||||||
| Coefficient | P≥/z/ | Coefficient | P≥/z/ | Coefficient | P≥/z/ | Coefficient | P≥/z/ | Coefficient | P≥/z/ | |
| ED | 1.005 | 0.999 | 0.012 | 0.890 | −0.007 | 0.937 | 0.896 | 0.999 | −0.045 | 0.239 |
| FE | −2.535 | 0.999 | −0.099 | 0.098* | 0.043 | 0.370 | −1.112 | 0.999 | −0.021 | 0.357 |
| IN | 33.330 | 0.994 | −0.753 | 0.083* | 0.126 | 0.747 | −0.811 | 1.000 | 0.117 | 0.515 |
| LO | 11.099 | 0.999 | −0.010 | 0.736 | −0.100 | 0.756 | 37.758 | 0.994 | −0.135 | 0.324 |
| RV | −27.809 | 0.994 | −0.927 | 0.307 | −1.268 | 0.182 | −90.378 | 0.992 | −0.401 | 0.260 |
| OW | 146.442 | 0.997 | −1.234 | 0.412 | −3.146 | 0.014** | −301.305 | 0.984 | 0.293 | 0.760 |
| COP | 32.425 | 0.999 | −0.608 | 0.601 | 1.355 | 0.112 | 83.366 | 0.998 | −0.244 | 0.588 |
| WINF | 5.415 | 1.000 | −0.338 | 0.539 | 0.630 | 0.065* | −33.788 | 0.999 | 0.261 | 0.153 |
| RED | 15.839 | 0.999 | 0.649 | 0.408 | 0.719 | 0.341 | −20.746 | 0.998 | 0.549 | 0.107 |
| ENS | 27.890 | 0.999 | −21.273 | . | −0.316 | 0.753 | 38.604 | 0.998 | −0.036 | 0.934 |
| NAS | −83.185 | 0.998 | 0.839 | 0.517 | −1.055 | 0.445 | 244.951 | 0.983 | −0.195 | 0.704 |
| CCOL | 19.425 | 1.000 | 1.018 | 0.542 | −2.226 | 0.149 | −249.882 | 0.999 | 1.704 | 0.063* |
| CPL | 56.268 | 1.000 | −0.223 | 0.892 | 1.945 | 0.222 | −42.607 | 1.000 | −2.002 | 0.035** |
| PGAS | 71.504 | 0.994 | 0.464 | 0.654 | 0.222 | 0.812 | 77.840 | 0.990 | −0.548 | 0.278 |
| GOVI | −126.117 | 0.995 | −1.599 | 0.163 | 0.001 | 0.999 | 29.178 | 0.999 | −0.193 | 0.740 |
| GOVTR | 0.647 | 1.000 | −0.197 | 0.885 | −1.659 | 0.199 | −315.184 | 0.996 | 0.269 | 0.660 |
| GOVPOL | 10.235 | 1.000 | 0.106 | 0.939 | 0.198 | 0.874 | 202.410 | 0.990 | 0.611 | 0.254 |
|
***, **, * significant at 1%, 5% and 10% respectively. Note: ED-educational level; FE-farming experience; IN-income; LO-land ownership; RV-river is nearby; OW-another source of water nearby; COP-a member of cooperative; WINF-weather information; RED-ready and prepared for drought; ENS-receive the necessary support from the government and different stakeholder; NAS-receive the necessary support from neighbours; CCOL-received assistance from the community and their social network; CPL-community involvement in drought strategy planning, PGAS-received assistance from the government in the past; GOVI-government interest and willingness in involving in agricultural drought activities; GOVTR-receive training from government or different stakeholders, and GOVPOL-government or different stakeholder have effective communication with smallholder farmers in disseminating policies and other important announcements. |
||||||||||
DownLoad:
CSV
The multinomial probit regression model was used to examine the factors that influence respondents’ choice of coping strategies before 2015–2016, 2015–2016, and 2016–2018 agricultural drought seasons. Selling livestock was chosen as a base category for the three seasons because most respondents’ chose this strategy. The outcomes and explanatory variables are depicted in Table 1. These variables fitted in the model because they influenced the respondents’ probability of choosing a specific coping strategy.
The coping strategies respondents used before 2015–2016, 2015–2016, and 2016–2018 agricultural drought season are given in Table 3. Education had a negative and highly significant (0.10 and 0.05) effect on reducing livestock production and a combination of coping strategies respectively before the 2015–2016 agricultural drought season. This implied that respondents who had education have prior knowledge of the intensity and frequency of agricultural drought and they do not want a risk of losing their livestock with the agricultural were more likely to sell their livestock as a drought coping strategy. This suggested that respondents could have used their education with extension services/support to make informed decisions about their coping strategies and thus reduce their level of vulnerability. Education is one of the key determinants in coping strategies. Higher education level increases the individual’s awareness of different alternatives [31]. Farm experience had a negative and highly significant (0.10) effect on the probability of respondents using a combination of strategies and seeking assistance before the 2015–2016 and 2016–2018 agricultural drought season respectively (Table 3). However, during the 2015–2016 farm experience had a negative and highly significant (0.50) effect on the probability of respondents using reduce livestock production. This implies the effect of the worst and intensity of agricultural drought season in 2015–2016, push livestock farmers looking for assistance from government and other stakeholders to survive.
Income had a negative and significant (0.10) effect on the probability to use production reduction coping strategies during the 2015–2016 agricultural season. On the other hand, during 2017–2018 agricultural drought coping strategies showed that income had a negative and significant (0.10) effect on the likelihood of seeking assistance in fodder (Table 3). This indicates that the severity of the drought during 2015/2016 forced farmers to rely on assistance, this has a policy implication of government and other stakeholders need to assist to enhance their resilience to agricultural drought.
During the 2015–2016 agricultural drought season land ownership had a negative and significant (0.05) effect on the likelihood of reducing the production of livestock (Table 3). Previous studies found that farmers with secure land tenure were likely to take up adoption strategies [10].
Before 2015–2016, 2015–2016 and 2016–2018 agricultural drought season, community involvement in drought strategy planning had a negative and significant (0.01), (0.10), and (0.05) effect on the likelihood of adopting a combination of strategies respectively. This implies that the government and different stakeholders should enhance the participation of the community in planning by using different mechanisms including teaching the importance of involving the community in each step of activities.
The strategy used during the 2016–2018 agricultural drought-receiving assistance from the community and their social network had a positive and significant (0.10) effect on the likelihood of adopting a combination of strategies. This indicated that social networks played an important role in coping strategies. Matin et al. [32] highlighted that social networks play a significant role in agricultural drought coping strategies and many aspects of absorbing, buffering, ability to initiate social innovations, and act collectively. However, community involvement in drought strategy planning had a negative and significant (0.05) effect on the likelihood of adopting a combination of strategies before the 2015–2016 agricultural drought season.
Strategies employed during the 2015–2016 agricultural drought season included receiving assistance from the government had a negative and significant (0.10) effect on the likelihood of adopting a combination of strategies. Government interest and willingness to be involved in agricultural drought activities had a negative and significant (0.05) effect on the likelihood of adopting production reduction and combination strategies during the 2015–2016 agricultural drought season. This implied that the respondents did not get enough support from the government during a severe drought, even if they get assistance, the assistance arrive late. Hence the government should enhance mechanisms to help respondents during droughts.
Receiving training from the government or different stakeholders had a negative and significant (0.05) effect on the likelihood of adopting production reduction during the 2015–2016 agricultural drought season. Effective communication from government or different stakeholders in disseminating policies and other important announcements had a positive and significant (0.10) effect on the likelihood of adopting a combination of strategies during the 2015–2016 agricultural drought season. This implies that training and information on earlier drought impacts are very important when planning future drought responses. By comparing the most severe impacts of drought, policymakers can plan to minimise the most severe impacts.
During the server agricultural drought season of 2015–2016, strategies showed that a member of cooperatives had a negative and significant (0.05) effect on the likelihood of adopting production reduction coping strategies. This implied that the probability of respondents who received assistance and information from cooperatives had a higher probability of adopting coping strategies. However, this was not happening, as cooperatives did not operate at the grass-root level, as observed and interviewed the respondents.
For strategies during the 2016–2018 agricultural drought, other sources of water nearby had a negative and significant (0.05) effect on the likelihood of off-farm coping strategy. This implied that with the scarcity of water, farm diversification may have helped respondents cope better during drought as an additional income would support their main farming enterprises. Khanal et al. [15] highlight that there are limits to the effectiveness of existing adoptions under more severe climate change. In such cases, more systemic changes in resource allocation need to be considered, such as targeted diversification of production systems and livelihoods. Weather information had a positive and significant (0.10) effect on the likelihood of off-farm coping strategies. This implied that having enough information about the weather helped respondents plan and choose appropriate coping strategies. This positive effect of access to climate information on the use of adoption of strategies is in line with other studies [10,15].
To determine whether correlations exist among coping strategies, the Pearson chi-square statistic and p-value were used to calculate any possible significance of correlation. Strategies respondents adopted when faced with drought during the 2015–2016 season were positive and positively correlated with before the 2015–2016 agricultural drought season coping strategies at a 1% level (Table 4). Strategies employed during the 2016–2018 agricultural drought were positive and positively correlated with strategies adopted before and during the 2015–2016 agricultural drought season at a 1% level. This result was confirmed by a p-value of 0.01957 and a Pearson chi2 value of 9.8841. This indicated that socio-economic, institutional, economic development and community factors were significant for the decision of coping strategies in the three agricultural drought seasons highly influenced farming activities.
| DSP | DSM | DSC | |
| DSP | 1 | ||
| DSM | 0.370*** | 1 | |
| DSC | 0.236*** | 0.256*** | 1 |
| Pearson chi2 statistic = 9.8841; p-value = 0.01957 | |||
|
*** Correlation significant at 0.01 level (2 tailed). Note: DSP denotes before 2015–2016 agricultural drought season coping strategies, DSM denotes coping strategies during 2015–2016 season, and DSC denotes coping strategies during the 2016–2018 season agricultural drought. |
|||
DownLoad:
CSV
This study aimed to understand the factors that influenced smallholder livestock farmers’ choice of coping strategies in the Northern Cape Province of South Africa and effective adaptive strategies and measures were identified in three timeframes. The smallholder livestock farmers vulnerable to agricultural drought because of a lack of resources to assist them during agricultural drought seasons.
The analysis was done to see the coping strategies of the 2015/2016 season as a benchmark because South Africa in general and the Northern Cape province of South Africa in particular face the worst drought in South Africa history since 1982 and the province declared a disaster area by the South African government. Hence it is necessary to assess the copings and choice of strategies before and after this benchmark.
After the worst drought 2015/2016- some farmers migrate, seeking food assistance and job and leasing their farm. This indicates the severity of the drought during 2015/2016. During the worst drought in 2015/2016, 1.4% of farmers taking advantage of the low price of livestock and starting buying more livestock. Further, 5.9% of the farmers stop livestock farming, 1.4% of livestock farmers selling their assets to survive during the worst drought season of 2015/2016, this implies that the extent, intensity, and frequency of the agricultural drought in the study area. There is also very limited coping and adaption choices due to the low level of resources or livelihood assets available to smallholder livestock farmers in vulnerable situations.
The respondents adopted different types of coping strategies during drought periods. There were several reasons for this, such as socio-economic, institutional, economic development, and community factors. To mention a few, land ownership, cooperatives, source of income, the community and social networks, governmental interest and willingness to be involved in agricultural drought activities, training from government or different stakeholders, and effective communication with respondents in disseminating policies and other important announcements to enhance agricultural drought coping and adaption strategies.
The study concludes that respondents’ choice of agricultural drought coping strategies should be integrated into various spheres and policymakers should aim at improving and implementing those coping strategies that farmers deem necessary for farmers to have more options for coping strategies in the future. The government with other stakeholders should consider training smallholder livestock farmers and providing resources that will enhance knowledge of other available coping strategies. Farmers who are better educated and skilled stand a better chance of coping with drought.
The study recommends policies aimed at promoting coping strategies for agricultural drought, need to emphasize the significant role of providing assistance and valid information on time will enhance the resilience of farmers at the individual and community level. Policymakers also should ensure that a government program is implemented to help smallholder livestock farmers training, which will assist them in preparing for drought and help them with decision-making processes during periods of agricultural drought.
Last, but not least, the link between government, governance, and adaptive policies at the national (macro) level and the adaptive capacity of farmers at the micro-level are critical importance to enhance resilience. Policies dealing with drought risk reduction should focus on adaptation to agricultural drought, the building of coping capacity for extreme shocks, and decreased vulnerability amongst smallholder livestock farmers.
I acknowledge the contributions of Ringetani, Matlou; Zimbini Coka, and Ntsako Maluleke. I also acknowledge and thank the National Research Foundation (NRF), Thuthuka funding instrument for funding the project. The research which is reported in this article is part of a more comprehensive research project on “Household resilience to agricultural drought in the Northern Cape province of South Africa” Contract Number/Project Number (TTK170510230380).”
The author declares no conflicts of interest in this paper.
| [1] | Jones PG, Thornton PK (2009) Croppers to livestock keepers: Livelihood transitions to 2050 in Africa due to climate change. Environ Sci Policy 12: 427-437. |
| [2] | Bryan E, Ringler C, Okoba B, et al. (2013) Adapting agriculture to climate change in Kenya: Household strategies and Determinants. J Environ Manage 114: 26-35. |
| [3] | Eriksen SH, Brown K, Kelly PM (2005) The dynamics of vulnerability: locating coping strategies in Kenya and Tanzania. Geogr J 171: 287-305. |
| [4] | Mare F, Bahta YT, Walter VN (2018) The impact of drought on commercial livestock farmers in South Africa and the strategies they adopt. Dev pract 28: 884-898. |
| [5] | Caldwell K, Boyd CP (2009) Coping and resilience in farming families affected by drought. Rural Remote Health 9: 1088. |
| [6] | Agrawal A (2010) Local institutions and adaptation to climate change. In: Mearns R, Norton A (Eds), Social dimensions of climate change: Equity and vulnerability in a warming world. New Frontiers of Social Policy. World Bank. Washington DC, USA, 173-198. |
| [7] | Agri SA (South African Agricultural Industry Association) (2016) A raindrop in the drought. Report to the multi-stakeholder task on the drought. Agri SA's status report on the current drought crises. Pretoria, South Africa. |
| [8] | Matlou R, Bahta YT (2019) Factors influencing the resilience of smallholder livestock farmers to agricultural drought in South Africa: Implication for adaptive capabilities. JAMBA: J Disaster Risk Stud 11: 805. |
| [9] | Karimi V, Karami E, Keshavarz M (2018) Climate change and agriculture: Impacts and adaptive responses in Iran. J Integr Agr 17: 1-15. |
| [10] | Deressa TT, Hassen RM, Ringler C, et al. (2009) Determinants of farmers' choice of adaptation methods to climate change in the Nile Basin of Ethiopia. Global Environ Change 19: 248-255. |
| [11] | Menike LMCS, Keeragala Arachchi KAGP (2015) Adaptation to climate change by smallholder farmers in rural communities: Evidence from Sri Lanka. Procedia Food Sci 6: 288-292. |
| [12] | Rakotobe ZL, Harvey CA, Rao SN, et al. (2016) Strategies of smallholder farmers for coping with the impacts of cyclones: A case study from Madagascar. Int J Disaster Risk Reduct 17: 114-122. |
| [13] | Abdul-Razak M, Kruse S (2017) The adaptive capacity of smallholder farmers to climate change in the Northern Region of Ghana. Clim Risk Manage 17: 104-122. |
| [14] | Zamasiya B, Nyikahadzoi K, Mukamuri BB (2017) Factors influencing smallholder farmers' behavioural intention towards adaptation to climate change in transitional climatic zones: A case study of Hwedza District in Zimbabwe. J Environ Manage 198: 233-239. |
| [15] | Khanal U, Wilson C, Hoang VN, et al. (2018) Farmers' adaptation to climate change, its determinants and impacts on rice yield in Nepal. Ecol Econ 144: 139-147. |
| [16] | DAFF (Department of Agriculture, Forestry, and Fisheries) (2012) A framework for the development of smallholder farmers through cooperatives development. Pretoria, South Africa. |
| [17] | FBDM (Frances Baard District Municipality) (2016) Integrated Development Plan (IDP) Review 2015/16 and Planning 2016/17. Available from: https://francesbaard.gov.za/wp-content/uploads/2015/04/IDP-2016.pdf. |
| [18] | FBDM (Frances Baard District Municipality) (2018) Government Communication and Information Systems. Available from: https://francesbaard.gov.za/our-regions/. |
| [19] | DAFF (Department of Agriculture, Forestry, and Fisheries) (2012a) Drought Status in the Agriculture Sector. Portfolio Committee on Water and Sanitation. Pretoria, South Africa. Available from: https://slideplayer.com/slide/13938691/. |
| [20] | Agri SA (South African Agricultural Industry Association) (2019) Agricultural Drought Report 2018/2019. Compiled by Agri SA Centre of Excellence, Economics, and Trade. Available from: https://www.agrisa.co.za/. |
| [21] | Jordaan AJ (2012) Drought Risk Reduction in the Northern Cape, South Africa. Ph.D. thesis, Bloemfontein: University of the Free State. |
| [22] | DAFF (Department of Agriculture, Forestry, and Fisheries) (2018) Abstract of Agricultural Statistics. Pretoria, South Africa. |
| [23] | Stats SA (Statistics South Africa) (2016) Community Survey 2016: Agricultural Households, Report No. 03-01-05. Pretoria: South Africa. |
| [24] | Pienaar L, Traub LN (2015) Understanding the smallholder farmer in South Africa: Towards a sustainable livelihoods classification. Agriculture in an Interconnected World. International Conference of Agricultural Economics. Milan, Italy. |
| [25] | Von Maltitz L (2019) The resilience of female smallholder livestock farmers to agricultural drought in the Northern Cape, South Africa. MSc dissertation, Bloemfontein: University of the Free State. |
| [26] | Munizaga MA, Alvarez-Daziano R (2005) Testing mixed logit and probit by simulation. Transportation Research Record: J Transp Res Board 1921: 53-62. |
| [27] | Emmanuel D, Victor O (2014) Examining the socioeconomics determinants of rice farmer's choice of land tenure systems in the upper east region of Ghana. J Agric Technol 10: 505-515. |
| [28] | DFID (Department of International Development) (1999) The Sustainable Livelihood Guidance Sheets. London. |
| [29] | ISDR (International Strategy for Disaster Reduction) (2004) Living with risk: A global review of disaster reduction initiatives. Vol. 1. Available from: http://www.unisdr.org/files/657_lwr1.pdf. |
| [30] | Jordaan AJ, Sakulski D, Jordaan AD (2013) Interdisciplinary drought risk assessment for agriculture: the case of communal farmers in the Northern Cape Province, South Africa. S Afr J Agric Ext 4: 1-16. |
| [31] | Alam K (2015) Farmers' adaptation to water scarcity in drought-prone environments: A case study of Rajshahi District, Bangladesh. Agric Water Manage 148: 196-206. |
| [32] | Matin N, Taylor R, Forrester J, Pedoth L, Davis B, Deeming H, Fordham, M (2015) Mapping of social networks as a measure of social resilience of agents. Report Deliverable 4.2. Centre for Research on the Epidemiology of Disasters (CRED), Louvain. Available from: http://eprints.whiterose.ac.uk/103016/. |
| [33] | Cochran WG (1977) Sampling techniques, 3de Edition. New York: John Wiley and Sons. |
| [34] | Northern Cape Department of Agriculture, Forestry, and Fisheries (2018) Beneficiaries of a Drought relief program. Northern Cape, Kimberly, South Africa. An unpublished report. |
 agrfood-05-04-964-s001.pdf agrfood-05-04-964-s001.pdf |
 |
| 1. | Ringetani Matlou, Yonas T. Bahta, Enoch Owusu-Sekyere, Henry Jordaan, Impact of Agricultural Drought Resilience on the Welfare of Smallholder Livestock Farming Households in the Northern Cape Province of South Africa, 2021, 10, 2073-445X, 562, 10.3390/land10060562 | |
| 2. | Sheunesu Ruwanza, Gladman Thondhlana, Menelisi Falayi, Research Progress and Conceptual Insights on Drought Impacts and Responses among Smallholder Farmers in South Africa: A Review, 2022, 11, 2073-445X, 159, 10.3390/land11020159 | |
| 3. | Yonas T. Bahta, Nexus between Coping Strategies and Households’ Agricultural Drought Resilience to Food Insecurity in South Africa, 2022, 11, 2073-445X, 893, 10.3390/land11060893 | |
| 4. | Bethwell Moyo, Khuliso E. Ravhuhali, Dry season feeding strategies and winter forage production by communal area sheep farmers of the Eastern Cape province in South Africa, 2023, 9, 2331-1932, 10.1080/23311932.2022.2161775 | |
| 5. | Leocadia Zhou, Mhlangabezi Slayi, Saul Ngarava, Ishmael Festus Jaja, Lovemore Musemwa, A Systematic Review of Climate Change Risks to Communal Livestock Production and Response Strategies in South Africa, 2022, 3, 2673-6225, 10.3389/fanim.2022.868468 | |
| 6. | Lindie V. Maltitz, Yonas T. Bahta, Empowerment of smallholder female livestock farmers and its potential impacts to their resilience to agricultural drought, 2021, 6, 2471-2086, 603, 10.3934/agrfood.2021036 | |
| 7. | Yonas T. Bahta, Vuyiseka A. Myeki, Adaptation, coping strategies and resilience of agricultural drought in South Africa: implication for the sustainability of livestock sector, 2021, 7, 24058440, e08280, 10.1016/j.heliyon.2021.e08280 | |
| 8. | Yonas T. Bahta, Social vulnerability to agricultural drought: Insights from Northern Cape, South Africa, 2022, 17, 24682276, e01324, 10.1016/j.sciaf.2022.e01324 | |
| 9. | Silindile Sibiya, Jai Kumar Clifford-Holmes, James Gambiza, Drivers of Degradation of Croplands and Abandoned Lands: A Case Study of Macubeni Communal Land in the Eastern Cape, South Africa, 2023, 12, 2073-445X, 606, 10.3390/land12030606 | |
| 10. | Yonas T. Bahta, Vuyiseka A. Myeki, The Impact of Agricultural Drought on Smallholder Livestock Farmers: Empirical Evidence Insights from Northern Cape, South Africa, 2022, 12, 2077-0472, 442, 10.3390/agriculture12040442 | |
| 11. | Chenaimoyo L.F. Katiyatiya, Jabulani Majaha, Obert C. Chikwanha, Kennedy Dzama, Nkgaugelo Kgasago, Cletos Mapiye, Drought's implications on agricultural skills in South Africa, 2022, 51, 0030-7270, 293, 10.1177/00307270221103289 | |
| 12. | Zahra Khoshnodifar, Hamid Karimi, Pouria Ataei, Mechanisms to change farmers' drought adaptation behaviors in Sistan and Baluchistan Province, Iran, 2023, 7, 2571-581X, 10.3389/fsufs.2023.1121254 | |
| 13. | Yonas T. Bahta, Joseph P. Musara, Diversity of Food Insecurity Coping Strategies among Livestock Farmers in Northern Cape Province of South Africa, 2023, 11, 2225-1154, 82, 10.3390/cli11040082 | |
| 14. | Thabo Ndlovu, Sipho Mamba, Contextualizing the Seasonal Livelihoods Programming Tool in Drought Resilience Planning Settings: Experiences from Southern Zimbabwe, 2022, 1556-5068, 10.2139/ssrn.4110994 | |
| 15. | Marco d’Errico, Jeanne Pinay, Ellestina Jumbe, Anh Hong Luu, Drivers and stressors of resilience to food insecurity: evidence from 35 countries, 2023, 15, 1876-4517, 1161, 10.1007/s12571-023-01373-5 | |
| 16. | Yonas T. Bahta, Willem A. Lombard, Nexus between Social Vulnerability and Resilience to Agricultural Drought amongst South African Smallholder Livestock Households, 2023, 14, 2073-4433, 900, 10.3390/atmos14050900 | |
| 17. | Ashish Sharma, Rainfall deficiency, drought and economic growth in the Bundelkhand region of India, 2023, 9, 2363-5037, 10.1007/s40899-023-00851-0 | |
| 18. | Prince Nketiah, Herbert Ntuli, Empirical analysis of drought-induced cattle destocking in South Africa, 2024, 16, 1996-1421, 10.4102/jamba.v16i1.1557 | |
| 19. | Dumisani Shoko Kori, Clare Kelso, Walter Musakwa, Climate change adaptation by smallholder farmers in Southern Africa: a bibliometric analysis and systematic review, 2024, 6, 2515-7620, 032002, 10.1088/2515-7620/ad3127 | |
| 20. | L. Mdiya, M. Aliber, S. Ngarava, N.V. Bontsa, L. Zhou, Impact of Extension Services on the Use of Climate Change Coping Strategies for Smallholder Ruminant Livestock Farmers in Raymond Local Municipality, Eastern Cape Province, South Africa, 2023, 51, 2413-3221, 150, 10.17159/2413-3221/2023/v51n2a15725 | |
| 21. | Sennan D. Mattar, Neil J. W. Crawford, 2023, Chapter 4, 978-3-031-29528-7, 51, 10.1007/978-3-031-29529-4_4 | |
| 22. | Bouchra El Amiri, Reda Azmi, Said Laaribya, Brahim Dani, Mounia Sibaoueih, Berkat Omar, 2024, Chapter 7, 978-3-031-59602-5, 99, 10.1007/978-3-031-59603-2_7 | |
| 23. | Thabo Ndlovu, Sipho Felix Mamba, Contextualizing the seasonal livelihoods programming tool in drought resilience planning settings: Experiences from southern Zimbabwe, 2023, 95, 22124209, 103908, 10.1016/j.ijdrr.2023.103908 |


Figures(2) / Tables(4)

Y.T. Bahta. Smallholder livestock farmers coping and adaptation strategies to agricultural drought[J]. AIMS Agriculture and Food, 2020, 5(4): 964-982. doi: 10.3934/agrfood.2020.4.964

| Variable | Description |
| Dependent Variable: | |
| cd | Before 2015–2016 agricultural drought season coping strategies—stopping farm, produce less livestock production, sell livestock, sell the asset, obtain credit from the bank, and a combination of strategies.During the 2015–2016 agricultural drought season (this period was the worst drought South Africa faced since 1982 and the Northern Cape province declared a disaster area by the South Africa government) - selling livestock production, sell the asset, buy more livestock, stopping farming, obtain credit, and combinations of strategies.During the 2016–2018 agricultural drought season -migrate, seeking food assistance, sell livestock, looking a job other than farming, lease part of the farm, and a combination of strategies. |
| Explanatory variables: | |
| ED | educational level |
| FE | farming experience |
| IN | source of income (off-farm activities, farm, and others) |
| LO | land ownership (rented, purchased, customary, others) |
| RV | equal 1 if the river is nearby, 0 if Not |
| OW | equals 1 if there other sources of water nearby, 0 if Not |
| COP | equals 1 if the livestock farmers a member of a cooperative, 0 if Not |
| WINF | source of weather information (newspaper, radio, friends, social media, and others) |
| RED | equal 1 if smallholder farmers ready and prepared for drought, 0 if Not |
| ENS | equals 1 if farmers receive the necessary support from the government and different stakeholder, 0 if Not |
| NAS | equals 1 if farmers receive the necessary support from neighbours, 0 if Not |
| CCOL | equals 1 if farmers received assistance from the community and their social network, 0 if Not |
| CPL | equals 1 if the community involved in drought strategy planning, 0 if Not |
| PGAS | equals 1 if farmers received assistance from the government in the past, 0 if Not |
| GOVI | equals 1 if the government interest and willingness in involving in agricultural drought activities, 0 if Not |
| GOVTR | equals 1 if the smallholder farmers receive training from government or different stakeholders, 0 if Not |
| GOVPOOL | equals 1 if the government or different stakeholder have effective communication with smallholder farmers in disseminating policies and other important announcements, 0 if Not |
| α0cd | constant term |
| α1cd,α2cd…α17cd | coefficients of the explanatory variables in the model |
| ecd | disturbance term |
| Source: Author observation. | |
DownLoad:
CSV
| Characteristics | Sub-characteristics | Frequency | Mean | Median | Minimum | Maximum |
| Age | 18–40 | 33(16%) | 55 | 56 | 21 | 89 |
| 40–65 | 120 (58%) | |||||
| > 65 | 54 (26%) | |||||
| Marital status | Single | 41(20%) | ||||
| Married | 138 (67%) | |||||
| Widow | 24 (11%) | |||||
| Divorce | 4 (2%) | |||||
| Households Size | 1–5 | 201 (97%) | 2 | 1 | 1 | 11 |
| 5–10 | 4 (2%) | |||||
| > 10 | 2 (1%) | |||||
| Gender | Male | 168 (81%) | ||||
| Female | 39 (19%) | |||||
| Education level | No schooling | 23 (11%) | 8 | 8 | 0 | 16 |
| Elementary | 65 (32%) | |||||
| high school | 100 (48%) | |||||
| Diploma | 10 (5%) | |||||
| Degree | 9 (4%) | |||||
| Farm experience | 1–10 | 119 (58%) | 12 | 10 | 1 | 40 |
| 10–20 | 63 (30%) | |||||
| > 20 | 25 (12%) | |||||
| No. of livestock | Cattle | 4300 (45%) | ||||
| Sheep | 2425 (25%) | |||||
| Goat | 2928 (30%) | |||||
| Source: Author calculation. | ||||||
DownLoad:
CSV
| Before the 2015–2016 season strategies (DSP)-which coping strategy smallholder livestock farmers used before the 2015–2016 season? | ||||||||||
| Stop Farming | Reduce production | Sell assets | Credit from bank | Combinations of other strategies | ||||||
| Coefficient | P≥/z/ | Coefficient | P≥/z/ | Coefficient | P≥/z/ | Coefficient | P≥/z/ | Coefficient | P≥/z/ | |
| ED | 0.077 | 0.640 | −0.088 | 0.081* | 1.377 | 1.000 | −8.102 | 0.994 | −0.107 | 0.041** |
| FE | 0.023 | 0.827 | −0.033 | 0.269 | −0.825 | 1.000 | −0.276 | 1.000 | −0.059 | 0.091* |
| IN | −1.551 | 0.068* | 0.029 | 0.900 | 9.433 | 0.999 | 19.296 | 0.998 | 0.106 | 0.656 |
| LO | 0.937 | 0.158 | −0.081 | 0.638 | 2.534 | 1.000 | 27.158 | 0.997 | 0.151 | 0.436 |
| RV | −0.061 | 0.963 | 0.300 | 0.496 | −17.348 | . | −19.285 | 0.999 | −0.388 | 0.442 |
| OW | 2.542 | 0.598 | 0.102 | 0.920 | −19.976 | 1.000 | −29.935 | 0.999 | −1.094 | 0.238 |
| COP | −1.617 | 0.241 | −0.007 | 0.990 | 28.254 | 0.999 | 45.158 | 0.999 | 0.560 | 0.345 |
| WINF | −0.604 | 0.526 | 0.307 | 0.291 | 1.748 | 1.000 | 26.628 | 0.999 | −0.012 | 0.975 |
| RED | 1.639 | 0.300 | −0.385 | 0.342 | 17.742 | 0.999 | −19.100 | 0.999 | −0.007 | 0.986 |
| ENS | 0.749 | 0.525 | −0.046 | 0.936 | −23.423 | . | −5.196 | 1.000 | 0.241 | 0.676 |
| NAS | 1.168 | 0.450 | −0.219 | 0.742 | −16.715 | . | −129.665 | 0.999 | −0.047 | 0.947 |
| CCOL | 1.102 | 0.721 | −1.585 | 0.136 | 0.047 | . | 57.528 | 1.000 | 3.225 | 0.012** |
| CPL | −0.512 | 0.856 | 0.789 | 0.436 | −17.490 | . | −32.369 | 1.000 | −4.403 | 0.002*** |
| PGAS | 17.345 | 0.996 | −0.268 | 0.633 | −10.266 | 1.000 | −7.304 | 1.000 | −0.730 | 0.280 |
| GOVI | 13.740 | . | −0.237 | 0.730 | −11.091 | 1.000 | 3.181 | 1.000 | −0.940 | 0.216 |
| GOVTR | 29.281 | . | 1.006 | 0.186 | 12.349 | 1.000 | −139.452 | 0.999 | 0.977 | 0.269 |
| GOVPOL | −1.995 | 0.139 | −0.622 | 0.355 | 17.448 | 1.000 | 86.077 | 0.999 | 0.179 | 0.819 |
| Strategy during the 2015–2016 season (DSM)-Which coping strategies smallholder livestock farmers adopt during 2015–2016? | ||||||||||
| Buy more livestock | Reduce production | Sell assets | Combinations of other strategies | |||||||
| Coefficient | P≥/z/ | Coefficient | P≥/z/ | Coefficient | P≥/z/ | Coefficient | P≥/z/ | |||
| ED | −0.928 | 1.000 | −0.108 | 0.215 | 3.133 | 0.998 | −0.055 | 0.180 | ||
| FE | 0.104 | 1.000 | −0.006 | 0.284 | −9.321 | 0.993 | −0.059 | 0.026** | ||
| IN | 30.411 | 0.999 | −0.840 | 0.082* | 10.990 | 0.999 | 0.237 | 0.210 | ||
| LO | 14.382 | 0.999 | 1.083 | 0.015** | 15.036 | 0.998 | 0.223 | 0.127 | ||
| RV | 41.679 | 0.999 | 0.552 | 0.519 | −15.298 | 0.998 | 0.297 | 0.439 | ||
| OW | 1.385 | 1.000 | 2.168 | 0.363 | −63.009 | 1.000 | −0.888 | 0.270 | ||
| COP | −46.398 | 0.999 | −3.014 | 0.033** | −174.767 | . | 0.367 | 0.425 | ||
| WINF | 2.557 | 1.000 | 0.376 | 0.249 | −4.727 | 1.000 | 0.084 | 0.664 | ||
| RED | −11.388 | 1.000 | 1.197 | 0.149 | −19.675 | 0.998 | 0.138 | 0.687 | ||
| ENS | 47.495 | 0.999 | 0.843 | 0.352 | −33.920 | 0.996 | −0.391 | 0.409 | ||
| NAS | −51.995 | 0.998 | 0.719 | 0.555 | 124.365 | 0.994 | −0.346 | 0.536 | ||
| CCOL | −53.393 | 0.999 | −1.609 | 0.408 | −177.629 | . | 1.365 | 0.154 | ||
| CPL | 99.675 | 0.998 | 1.643 | 0.354 | 0.214 | . | −1.945 | 0.054* | ||
| PGAS | −39.342 | 0.999 | 1.269 | 0.260 | 114.230 | 0.994 | −0.937 | 0.086* | ||
| GOVI | 52.972 | 0.999 | −3.195 | 0.037** | 10.595 | 1.000 | −1.559 | 0.025** | ||
| GOVTR | −15.980 | 1.000 | 2.677 | 0.077* | 79.354 | 1.000 | 1.180 | 0.118 | ||
| GOVPOL | −8.563 | 1.000 | −0.542 | 0.587 | −76.140 | 0.996 | 1.068 | 0.083* | ||
| Strategy 2016–2018 season (DSC)- ich coping strategies farmers adopt during the 2016–2018 season? | ||||||||||
| Migrate | Ask assistance (food fodder) | Looking for a job (off-farm) | Lessee par of farm | Combinations of other strategies | ||||||
| Coefficient | P≥/z/ | Coefficient | P≥/z/ | Coefficient | P≥/z/ | Coefficient | P≥/z/ | Coefficient | P≥/z/ | |
| ED | 1.005 | 0.999 | 0.012 | 0.890 | −0.007 | 0.937 | 0.896 | 0.999 | −0.045 | 0.239 |
| FE | −2.535 | 0.999 | −0.099 | 0.098* | 0.043 | 0.370 | −1.112 | 0.999 | −0.021 | 0.357 |
| IN | 33.330 | 0.994 | −0.753 | 0.083* | 0.126 | 0.747 | −0.811 | 1.000 | 0.117 | 0.515 |
| LO | 11.099 | 0.999 | −0.010 | 0.736 | −0.100 | 0.756 | 37.758 | 0.994 | −0.135 | 0.324 |
| RV | −27.809 | 0.994 | −0.927 | 0.307 | −1.268 | 0.182 | −90.378 | 0.992 | −0.401 | 0.260 |
| OW | 146.442 | 0.997 | −1.234 | 0.412 | −3.146 | 0.014** | −301.305 | 0.984 | 0.293 | 0.760 |
| COP | 32.425 | 0.999 | −0.608 | 0.601 | 1.355 | 0.112 | 83.366 | 0.998 | −0.244 | 0.588 |
| WINF | 5.415 | 1.000 | −0.338 | 0.539 | 0.630 | 0.065* | −33.788 | 0.999 | 0.261 | 0.153 |
| RED | 15.839 | 0.999 | 0.649 | 0.408 | 0.719 | 0.341 | −20.746 | 0.998 | 0.549 | 0.107 |
| ENS | 27.890 | 0.999 | −21.273 | . | −0.316 | 0.753 | 38.604 | 0.998 | −0.036 | 0.934 |
| NAS | −83.185 | 0.998 | 0.839 | 0.517 | −1.055 | 0.445 | 244.951 | 0.983 | −0.195 | 0.704 |
| CCOL | 19.425 | 1.000 | 1.018 | 0.542 | −2.226 | 0.149 | −249.882 | 0.999 | 1.704 | 0.063* |
| CPL | 56.268 | 1.000 | −0.223 | 0.892 | 1.945 | 0.222 | −42.607 | 1.000 | −2.002 | 0.035** |
| PGAS | 71.504 | 0.994 | 0.464 | 0.654 | 0.222 | 0.812 | 77.840 | 0.990 | −0.548 | 0.278 |
| GOVI | −126.117 | 0.995 | −1.599 | 0.163 | 0.001 | 0.999 | 29.178 | 0.999 | −0.193 | 0.740 |
| GOVTR | 0.647 | 1.000 | −0.197 | 0.885 | −1.659 | 0.199 | −315.184 | 0.996 | 0.269 | 0.660 |
| GOVPOL | 10.235 | 1.000 | 0.106 | 0.939 | 0.198 | 0.874 | 202.410 | 0.990 | 0.611 | 0.254 |
|
***, **, * significant at 1%, 5% and 10% respectively. Note: ED-educational level; FE-farming experience; IN-income; LO-land ownership; RV-river is nearby; OW-another source of water nearby; COP-a member of cooperative; WINF-weather information; RED-ready and prepared for drought; ENS-receive the necessary support from the government and different stakeholder; NAS-receive the necessary support from neighbours; CCOL-received assistance from the community and their social network; CPL-community involvement in drought strategy planning, PGAS-received assistance from the government in the past; GOVI-government interest and willingness in involving in agricultural drought activities; GOVTR-receive training from government or different stakeholders, and GOVPOL-government or different stakeholder have effective communication with smallholder farmers in disseminating policies and other important announcements. |
||||||||||
DownLoad:
CSV
| DSP | DSM | DSC | |
| DSP | 1 | ||
| DSM | 0.370*** | 1 | |
| DSC | 0.236*** | 0.256*** | 1 |
| Pearson chi2 statistic = 9.8841; p-value = 0.01957 | |||
|
*** Correlation significant at 0.01 level (2 tailed). Note: DSP denotes before 2015–2016 agricultural drought season coping strategies, DSM denotes coping strategies during 2015–2016 season, and DSC denotes coping strategies during the 2016–2018 season agricultural drought. |
|||
DownLoad:
CSV
| Variable | Description |
| Dependent Variable: | |
| cd | Before 2015–2016 agricultural drought season coping strategies—stopping farm, produce less livestock production, sell livestock, sell the asset, obtain credit from the bank, and a combination of strategies.During the 2015–2016 agricultural drought season (this period was the worst drought South Africa faced since 1982 and the Northern Cape province declared a disaster area by the South Africa government) - selling livestock production, sell the asset, buy more livestock, stopping farming, obtain credit, and combinations of strategies.During the 2016–2018 agricultural drought season -migrate, seeking food assistance, sell livestock, looking a job other than farming, lease part of the farm, and a combination of strategies. |
| Explanatory variables: | |
| ED | educational level |
| FE | farming experience |
| IN | source of income (off-farm activities, farm, and others) |
| LO | land ownership (rented, purchased, customary, others) |
| RV | equal 1 if the river is nearby, 0 if Not |
| OW | equals 1 if there other sources of water nearby, 0 if Not |
| COP | equals 1 if the livestock farmers a member of a cooperative, 0 if Not |
| WINF | source of weather information (newspaper, radio, friends, social media, and others) |
| RED | equal 1 if smallholder farmers ready and prepared for drought, 0 if Not |
| ENS | equals 1 if farmers receive the necessary support from the government and different stakeholder, 0 if Not |
| NAS | equals 1 if farmers receive the necessary support from neighbours, 0 if Not |
| CCOL | equals 1 if farmers received assistance from the community and their social network, 0 if Not |
| CPL | equals 1 if the community involved in drought strategy planning, 0 if Not |
| PGAS | equals 1 if farmers received assistance from the government in the past, 0 if Not |
| GOVI | equals 1 if the government interest and willingness in involving in agricultural drought activities, 0 if Not |
| GOVTR | equals 1 if the smallholder farmers receive training from government or different stakeholders, 0 if Not |
| GOVPOOL | equals 1 if the government or different stakeholder have effective communication with smallholder farmers in disseminating policies and other important announcements, 0 if Not |
| α0cd | constant term |
| α1cd,α2cd…α17cd | coefficients of the explanatory variables in the model |
| ecd | disturbance term |
| Source: Author observation. | |
| Characteristics | Sub-characteristics | Frequency | Mean | Median | Minimum | Maximum |
| Age | 18–40 | 33(16%) | 55 | 56 | 21 | 89 |
| 40–65 | 120 (58%) | |||||
| > 65 | 54 (26%) | |||||
| Marital status | Single | 41(20%) | ||||
| Married | 138 (67%) | |||||
| Widow | 24 (11%) | |||||
| Divorce | 4 (2%) | |||||
| Households Size | 1–5 | 201 (97%) | 2 | 1 | 1 | 11 |
| 5–10 | 4 (2%) | |||||
| > 10 | 2 (1%) | |||||
| Gender | Male | 168 (81%) | ||||
| Female | 39 (19%) | |||||
| Education level | No schooling | 23 (11%) | 8 | 8 | 0 | 16 |
| Elementary | 65 (32%) | |||||
| high school | 100 (48%) | |||||
| Diploma | 10 (5%) | |||||
| Degree | 9 (4%) | |||||
| Farm experience | 1–10 | 119 (58%) | 12 | 10 | 1 | 40 |
| 10–20 | 63 (30%) | |||||
| > 20 | 25 (12%) | |||||
| No. of livestock | Cattle | 4300 (45%) | ||||
| Sheep | 2425 (25%) | |||||
| Goat | 2928 (30%) | |||||
| Source: Author calculation. | ||||||
| Before the 2015–2016 season strategies (DSP)-which coping strategy smallholder livestock farmers used before the 2015–2016 season? | ||||||||||
| Stop Farming | Reduce production | Sell assets | Credit from bank | Combinations of other strategies | ||||||
| Coefficient | P≥/z/ | Coefficient | P≥/z/ | Coefficient | P≥/z/ | Coefficient | P≥/z/ | Coefficient | P≥/z/ | |
| ED | 0.077 | 0.640 | −0.088 | 0.081* | 1.377 | 1.000 | −8.102 | 0.994 | −0.107 | 0.041** |
| FE | 0.023 | 0.827 | −0.033 | 0.269 | −0.825 | 1.000 | −0.276 | 1.000 | −0.059 | 0.091* |
| IN | −1.551 | 0.068* | 0.029 | 0.900 | 9.433 | 0.999 | 19.296 | 0.998 | 0.106 | 0.656 |
| LO | 0.937 | 0.158 | −0.081 | 0.638 | 2.534 | 1.000 | 27.158 | 0.997 | 0.151 | 0.436 |
| RV | −0.061 | 0.963 | 0.300 | 0.496 | −17.348 | . | −19.285 | 0.999 | −0.388 | 0.442 |
| OW | 2.542 | 0.598 | 0.102 | 0.920 | −19.976 | 1.000 | −29.935 | 0.999 | −1.094 | 0.238 |
| COP | −1.617 | 0.241 | −0.007 | 0.990 | 28.254 | 0.999 | 45.158 | 0.999 | 0.560 | 0.345 |
| WINF | −0.604 | 0.526 | 0.307 | 0.291 | 1.748 | 1.000 | 26.628 | 0.999 | −0.012 | 0.975 |
| RED | 1.639 | 0.300 | −0.385 | 0.342 | 17.742 | 0.999 | −19.100 | 0.999 | −0.007 | 0.986 |
| ENS | 0.749 | 0.525 | −0.046 | 0.936 | −23.423 | . | −5.196 | 1.000 | 0.241 | 0.676 |
| NAS | 1.168 | 0.450 | −0.219 | 0.742 | −16.715 | . | −129.665 | 0.999 | −0.047 | 0.947 |
| CCOL | 1.102 | 0.721 | −1.585 | 0.136 | 0.047 | . | 57.528 | 1.000 | 3.225 | 0.012** |
| CPL | −0.512 | 0.856 | 0.789 | 0.436 | −17.490 | . | −32.369 | 1.000 | −4.403 | 0.002*** |
| PGAS | 17.345 | 0.996 | −0.268 | 0.633 | −10.266 | 1.000 | −7.304 | 1.000 | −0.730 | 0.280 |
| GOVI | 13.740 | . | −0.237 | 0.730 | −11.091 | 1.000 | 3.181 | 1.000 | −0.940 | 0.216 |
| GOVTR | 29.281 | . | 1.006 | 0.186 | 12.349 | 1.000 | −139.452 | 0.999 | 0.977 | 0.269 |
| GOVPOL | −1.995 | 0.139 | −0.622 | 0.355 | 17.448 | 1.000 | 86.077 | 0.999 | 0.179 | 0.819 |
| Strategy during the 2015–2016 season (DSM)-Which coping strategies smallholder livestock farmers adopt during 2015–2016? | ||||||||||
| Buy more livestock | Reduce production | Sell assets | Combinations of other strategies | |||||||
| Coefficient | P≥/z/ | Coefficient | P≥/z/ | Coefficient | P≥/z/ | Coefficient | P≥/z/ | |||
| ED | −0.928 | 1.000 | −0.108 | 0.215 | 3.133 | 0.998 | −0.055 | 0.180 | ||
| FE | 0.104 | 1.000 | −0.006 | 0.284 | −9.321 | 0.993 | −0.059 | 0.026** | ||
| IN | 30.411 | 0.999 | −0.840 | 0.082* | 10.990 | 0.999 | 0.237 | 0.210 | ||
| LO | 14.382 | 0.999 | 1.083 | 0.015** | 15.036 | 0.998 | 0.223 | 0.127 | ||
| RV | 41.679 | 0.999 | 0.552 | 0.519 | −15.298 | 0.998 | 0.297 | 0.439 | ||
| OW | 1.385 | 1.000 | 2.168 | 0.363 | −63.009 | 1.000 | −0.888 | 0.270 | ||
| COP | −46.398 | 0.999 | −3.014 | 0.033** | −174.767 | . | 0.367 | 0.425 | ||
| WINF | 2.557 | 1.000 | 0.376 | 0.249 | −4.727 | 1.000 | 0.084 | 0.664 | ||
| RED | −11.388 | 1.000 | 1.197 | 0.149 | −19.675 | 0.998 | 0.138 | 0.687 | ||
| ENS | 47.495 | 0.999 | 0.843 | 0.352 | −33.920 | 0.996 | −0.391 | 0.409 | ||
| NAS | −51.995 | 0.998 | 0.719 | 0.555 | 124.365 | 0.994 | −0.346 | 0.536 | ||
| CCOL | −53.393 | 0.999 | −1.609 | 0.408 | −177.629 | . | 1.365 | 0.154 | ||
| CPL | 99.675 | 0.998 | 1.643 | 0.354 | 0.214 | . | −1.945 | 0.054* | ||
| PGAS | −39.342 | 0.999 | 1.269 | 0.260 | 114.230 | 0.994 | −0.937 | 0.086* | ||
| GOVI | 52.972 | 0.999 | −3.195 | 0.037** | 10.595 | 1.000 | −1.559 | 0.025** | ||
| GOVTR | −15.980 | 1.000 | 2.677 | 0.077* | 79.354 | 1.000 | 1.180 | 0.118 | ||
| GOVPOL | −8.563 | 1.000 | −0.542 | 0.587 | −76.140 | 0.996 | 1.068 | 0.083* | ||
| Strategy 2016–2018 season (DSC)- ich coping strategies farmers adopt during the 2016–2018 season? | ||||||||||
| Migrate | Ask assistance (food fodder) | Looking for a job (off-farm) | Lessee par of farm | Combinations of other strategies | ||||||
| Coefficient | P≥/z/ | Coefficient | P≥/z/ | Coefficient | P≥/z/ | Coefficient | P≥/z/ | Coefficient | P≥/z/ | |
| ED | 1.005 | 0.999 | 0.012 | 0.890 | −0.007 | 0.937 | 0.896 | 0.999 | −0.045 | 0.239 |
| FE | −2.535 | 0.999 | −0.099 | 0.098* | 0.043 | 0.370 | −1.112 | 0.999 | −0.021 | 0.357 |
| IN | 33.330 | 0.994 | −0.753 | 0.083* | 0.126 | 0.747 | −0.811 | 1.000 | 0.117 | 0.515 |
| LO | 11.099 | 0.999 | −0.010 | 0.736 | −0.100 | 0.756 | 37.758 | 0.994 | −0.135 | 0.324 |
| RV | −27.809 | 0.994 | −0.927 | 0.307 | −1.268 | 0.182 | −90.378 | 0.992 | −0.401 | 0.260 |
| OW | 146.442 | 0.997 | −1.234 | 0.412 | −3.146 | 0.014** | −301.305 | 0.984 | 0.293 | 0.760 |
| COP | 32.425 | 0.999 | −0.608 | 0.601 | 1.355 | 0.112 | 83.366 | 0.998 | −0.244 | 0.588 |
| WINF | 5.415 | 1.000 | −0.338 | 0.539 | 0.630 | 0.065* | −33.788 | 0.999 | 0.261 | 0.153 |
| RED | 15.839 | 0.999 | 0.649 | 0.408 | 0.719 | 0.341 | −20.746 | 0.998 | 0.549 | 0.107 |
| ENS | 27.890 | 0.999 | −21.273 | . | −0.316 | 0.753 | 38.604 | 0.998 | −0.036 | 0.934 |
| NAS | −83.185 | 0.998 | 0.839 | 0.517 | −1.055 | 0.445 | 244.951 | 0.983 | −0.195 | 0.704 |
| CCOL | 19.425 | 1.000 | 1.018 | 0.542 | −2.226 | 0.149 | −249.882 | 0.999 | 1.704 | 0.063* |
| CPL | 56.268 | 1.000 | −0.223 | 0.892 | 1.945 | 0.222 | −42.607 | 1.000 | −2.002 | 0.035** |
| PGAS | 71.504 | 0.994 | 0.464 | 0.654 | 0.222 | 0.812 | 77.840 | 0.990 | −0.548 | 0.278 |
| GOVI | −126.117 | 0.995 | −1.599 | 0.163 | 0.001 | 0.999 | 29.178 | 0.999 | −0.193 | 0.740 |
| GOVTR | 0.647 | 1.000 | −0.197 | 0.885 | −1.659 | 0.199 | −315.184 | 0.996 | 0.269 | 0.660 |
| GOVPOL | 10.235 | 1.000 | 0.106 | 0.939 | 0.198 | 0.874 | 202.410 | 0.990 | 0.611 | 0.254 |
|
***, **, * significant at 1%, 5% and 10% respectively. Note: ED-educational level; FE-farming experience; IN-income; LO-land ownership; RV-river is nearby; OW-another source of water nearby; COP-a member of cooperative; WINF-weather information; RED-ready and prepared for drought; ENS-receive the necessary support from the government and different stakeholder; NAS-receive the necessary support from neighbours; CCOL-received assistance from the community and their social network; CPL-community involvement in drought strategy planning, PGAS-received assistance from the government in the past; GOVI-government interest and willingness in involving in agricultural drought activities; GOVTR-receive training from government or different stakeholders, and GOVPOL-government or different stakeholder have effective communication with smallholder farmers in disseminating policies and other important announcements. |
||||||||||
| DSP | DSM | DSC | |
| DSP | 1 | ||
| DSM | 0.370*** | 1 | |
| DSC | 0.236*** | 0.256*** | 1 |
| Pearson chi2 statistic = 9.8841; p-value = 0.01957 | |||
|
*** Correlation significant at 0.01 level (2 tailed). Note: DSP denotes before 2015–2016 agricultural drought season coping strategies, DSM denotes coping strategies during 2015–2016 season, and DSC denotes coping strategies during the 2016–2018 season agricultural drought. |
|||
