Citation: Masahiro Yasunaga, Shino Manabe, Masaru Furuta, Koretsugu Ogata, Yoshikatsu Koga, Hiroki Takashima, Toshirou Nishida, Yasuhiro Matsumura. Mass spectrometry imaging for early discovery and development of cancer drugs[J]. AIMS Medical Science, 2018, 5(2): 162-180. doi: 10.3934/medsci.2018.2.162
[1] | Sumbal Javed, Vijay Kumar Chattu . Patriarchy at the helm of gender-based violence during COVID-19. AIMS Public Health, 2021, 8(1): 32-35. doi: 10.3934/publichealth.2021003 |
[2] | Fnu Kajal, Ram Manohar Mishra, Amit Mehrotra, Vijay Kumar Chattu . Pandemic within a pandemic! Policy Implications of community-based Interventions to mitigate violence against women during COVID-19 in Urban Slums of Lucknow, India. AIMS Public Health, 2023, 10(2): 297-309. doi: 10.3934/publichealth.2023022 |
[3] | Niclas Olofsson . A life course model of self-reported violence exposure and illhealth with a public health problem perspective. AIMS Public Health, 2014, 1(1): 9-24. doi: 10.3934/publichealth.2014.1.9 |
[4] | Maha Hamad Mohammed Ali, Osman Babiker Osman, Mohamed AE. M. Ibrahim, Waled Amen Mohammed Ahmed . The effect of AIDS peer health education on knowledge, attitudes, and practices of secondary school students in Khartoum, Sudan. AIMS Public Health, 2015, 2(4): 718-726. doi: 10.3934/publichealth.2015.4.718 |
[5] | Joyce Lo, Sharan Jaswal, Matthew Yeung, Vijay Kumar Chattu, Ali Bani-Fatemi, Aaron Howe, Amin Yazdani, Basem Gohar, Douglas P. Gross, Behdin Nowrouzi-Kia . A systematic review of the literature: Gender-based violence in the construction and natural resources industry. AIMS Public Health, 2024, 11(2): 654-666. doi: 10.3934/publichealth.2024033 |
[6] | Ilenia Piras, Igor Portoghese, Massimo Tusconi, Federica Minafra, Mariangela Lecca, Giampaolo Piras, Paolo Contu, Maura Galletta . Professional and personal experiences of workplace violence among Italian mental health nurses: A qualitative study. AIMS Public Health, 2024, 11(4): 1137-1156. doi: 10.3934/publichealth.2024059 |
[7] | Val Bellman, David Thai, Anisha Chinthalapally, Nina Russell, Shazia Saleem . Inpatient violence in a psychiatric hospital in the middle of the pandemic: clinical and community health aspects. AIMS Public Health, 2022, 9(2): 342-356. doi: 10.3934/publichealth.2022024 |
[8] | Duong Minh Duc, Le Thi Vui, Hoang Ngoc Son, Hoang Van Minh . Smoking Initiation and Cessation among Youths in Vietnam: A Longitudinal Study Using the Chi Linh Demographic—Epidemiological Surveillance System (CHILILAB DESS). AIMS Public Health, 2017, 4(1): 1-18. doi: 10.3934/publichealth.2017.1.1 |
[9] | Michael G. Vaughn, Christopher P. Salas-Wright, Matt DeLisi, Brian E. Perron, David Cordova . Crime and Violence among MDMA Users in the United States. AIMS Public Health, 2015, 2(1): 64-73. doi: 10.3934/publichealth.2015.1.64 |
[10] | Wanda M. Williams, Michelle M. Yore, Melicia C. Whitt-Glover . Estimating physical activity trends among blacks in the United States through examination of four national surveys. AIMS Public Health, 2018, 5(2): 144-157. doi: 10.3934/publichealth.2018.2.144 |
The dynamics of the growth of GDP (gross domestic product) is arguably the most scrutinised metric quantifying the overall economic development of an economy. A weak annual growth rate of GDP, as has been characterising the US and Europe in the years following the financial crisis of 2008, is interpreted as underperformance, which has called for unorthodox monetary policies attempting to fix it (Erber, 2012). In contrast, a strong growth of GDP is usually lauded, because it reflects a rise of living standards and is generally accompanied by decreasing unemployment. But what is meant by "weak" or "strong" growth? Is there a "natural" growth rate? Does past growth rates of GDP imply future growth rates? This last question is particularly relevant in the present context of small growth compared with previous decades in developed countries and the argument by many that we may have shifted to a "new normal" of slower intrinsic growth (Dabla-Norris et al., 2015).
It is well-known that plotting the logarithm of the real US GDP per capita over the last one hundred years looks remarkably linear with a slope estimated between 0.019 and 0.02. In other words, the inflation adjusted GDP per capita exhibits a long term average growth of $1.9-2\%$ per year. * The occurrence of such a near trend-stationary long run growth covering a period with two world wars, the cold war and its associated proxy wars, the collapse of the Bretton Woods System in 1973, several large bubbles, crashes and recessions and strong changes in interest rate policies, is truly remarkable. It entices one to entertain the possibility of an equilibrium or natural growth rate, which then could be extrapolated in the future. Business cycles would then be viewed as fluctuations around this equilibrium growth rate.
* See the dashed linear fitted lines in figure 3 and figure A1.
In this paper, we challenge the standard hypothesis that business cycles are merely fluctuations (or transient deviations) around a stationary equilibrium growth rate. By analyzing quarterly data of real US GDP per capita (r-US-GDP-pc) between 1947 until 2015, we find both parametric and non-parametric evidence that the GDP growth rate density is bimodal, with peaks at a high and a low growth rate of $\rho_\text{high} \approx 3\%$, and $\rho_\text{low} \approx 1\%$, respectively. † This leads to the conclusion that the US economy per capita is intrinsically composed of alternation between regimes of strong growth rate $\rho_\text{high}$, associated with booms (or bubbles), and regimes of low growth rate $\rho_\text{low}$ that include plateaus (and recessions). Alternations between those two regimes give rise to business cycles. Only when viewed at larger scales, these two alternating regimes renormalize to an effective long-term growth rate $\rho_\text{lt} \approx 2\%$ that is between $\rho_\text{low}$ and $\rho_\text{high}$.‡
† Unless stated otherwise, we refer from hereon to the real GDP per capita (r-US-GDP-pc) simply as GDP.
‡ Throughout this article, we stick to quarterly dataset. In Appendix A we show the analysis for annual GDP data from 1800 until today. The conclusions are similar.
Our findings have important economic and policy implications. The existence of a well-characterised strong growth regime with average growth rate $\rho_\text{high}$ often leads to the misleading expectations that it is the normal that reflects a well-functioning economy, while the other mode of low growth $\rho_\text{low}$ is considered abnormal, often interpreted as due to a surprising shock, bringing considerable dismay and pain, and leading to policy interventions. Our finding of a robust bimodal distribution of GDP growth rates over the whole history of the US suggests that this interpretation is incorrect. Rather than accepting the existence of the long-term growth rate as given and interpreting the deviations from it as perturbations, the bimodal view of the GDP growth suggests a completely different picture. In this representation, the long-term growth rate is the result of a subtle compensation between the high and low growth regimes that alternate continuously. The overall growth dynamics that emerges is that the US economy is growing in a punctuated way, as illustrated in the model developed by Louzoun et al. (2003), following phases of strong growth that are intrinsically unsustainable, followed by corrections or consolidations until the next boom starts. In other words, the approximately long-term growth rate reflects an economy that oscillates between booms and consolidation regimes. Because of the remarkable recurrence of the strong regime and in view of its short-term beneficial effects, economists and policy makers are tempted (and actually incentivised) to form their expectations based on it, possibly catalysing or even creating it in a self-fulfilling prophecy fashion even when the real productivity gains are no more present, as occurred in the three decades before the 2008 crisis (Sornette and Cauwels, 2014).
We suggest that the transient strong growth regimes can be rationalised within the framework of the "social bubble hypothesis" (Sornette, 2008; Gisler and Sornette, 2009, 2010; Gisler et al., 2011), in the sense that they result from collective enthusiasm that are similar to those developing during financial bubbles, which foster collective attitude towards more risk taking. The social bubble hypothesis claims that strong social interactions between enthusiastic supporters weave a network of reinforcing feedbacks that lead to widespread endorsement and extraordinary commitment by those involved, beyond what would be rationalised by a standard cost-benefit analysis. For a time, the economy grows faster than its long-term trend, due to a number of factors that reinforce each other, leading to a phase of creative innovation (e.g. the internet dotcom bubble) or credit based expansion (e.g. the house boom and financialisation of the decade before 2008). These regimes then unavoidably metamorphose into a "hangover", the recovery and strengthening episode until the next upsurge.
Despite the huge attention paid to the analysis of GDP growth rate fluctuations, this work presents, to the best of our knowledge, for the first time a detailed analysis of the bimodal nature of its density distribution. In the next section, we first address the question of bimodality from the perspective of classic, parametric business cycle models. This yields first evidence of a bimodal distribution density. However, the reported results are susceptible to small changes in parameters and noise. Subsequently, we thus turn to a non-parametric analysis. The usage of wavelets as adequate tool for this analysis is motivated in section 3. Section 4 presents the wavelet methodology itself. Results are reported in 5. Section 6 is focused on the evidence supporting the bimodal structure of the distribution of GDP growth rates and section 7 concludes. Appendix A complements the presentation with annual GDP data over the past 200 years.
First introduced by Hamilton (1989), Markov autoregressive processes have become a popular tool for GDP business cycle analysis. In standardized form, such a process is written as
$ \rho_t = \mu(S_t) + \sum_{i=1}^n \phi_i \cdot \left(\rho_{t-i} - \mu \left(S_{t-i} \right) \right) + \epsilon_t \label{eq:Markov_AR} $ | (1) |
with $\rho_t$ the growth rate at time $t$, $S_t$ describes the regime of the economy at time $t$, which can take $m$ different states that are reflected in $m$ different values $\mu_1, \ldots, \mu_m$ for $\mu (S_t)$. The parameters $\phi_1, \ldots, \phi_n$ specify the autoregressive characteristics of the process and $\epsilon_t$ is Gaussian noise with zero mean and standard deviation $\sigma$. The switching from a regime $i$ to a regime $j$ at any time step is determined by a matrix of transition probabilities $p_{ij}$. In the classic Hamilton (1989) model, $m = 2$ and $n = 4$ and we shall stick here to this choice. The main idea is that there are two states of the economy, a boom state $S_t=1$ and a recession state $S_t = 0$. From time $t$ to $t+1$, the economy switches between these two states with probabilities $p_{01}$ and $p_{10}$, respectively. There is a debate about the nature of the switching probabilities $p_{ij}$. Hamilton (1989) assumes that the probabilities are independent of the business cycle duration whereas others assume that there is a dependence. A famous model of the second type is by Durland and McCurdy (1994). Duration dependence has been formally tested by Diebold and Rudebusch (1990), who conclude that Hamilton (1989)'s assumption of duration independence is legitimate. In own analysis simple, we therefore stick to the model of Hamilton (1989) to keep the discussion simple.
What is the prediction of these models for the GDP density distribution? In order to answer this question, we first fit the $9$ parameters of the model (1) to the $270$ datapoints of quarterly r-US-GDP-pc from 1947 to 2015. § Using these parameters, we then simulate a synthetic time series over a period of $100, 000$ years and extract the asymptotic density distribution from the simulated growth rates.
§ The following parameters have to be fit: $\mu_0 = \mu (S_t=0), \mu_1 = \mu (S_t=1), \phi_{1}, \phi_2, \phi_3, \phi_4, p_{12}, p_{21}$ and $\sigma$.
When fitting (1) to the raw GDP data, using the same data set of initially used by Hamilton (1989), we recover the same parameters, which are also close to those obtained for the expanded data from 1947 to 2015. However, the analysis of the GDP density distribution reveals a feature that has been underestimated, namely the fact that the model anchors on the few large negative outliers present in the data. Fitted parameters are reported in figure 1. The maximum likelihood algorithm identifies the few very negative outliers as one regime ($\mu_0=-1.7$, i.e. $-1.7\%$ quarterly, or $-6.8\%$ yearly growth rate), and the average $2\%$ yearly growth rate as the second regime $(\mu_1 = 0.5$, i.e. $0.5\%$ quarterly growth). The recession regime is interpreted by the calibration as a rare event (transition probability from average growth regime to recession regime $\approx 3\%$) that immediately jumps back to the normal average growth of roughly $2\%$ yearly growth. This anchoring on the few large negative quarters is clearly revealed by the synthetic GDP density distribution shown in figure 1c.
To obtain results that are more in line with actual business cycle fluctuations, we discard all datapoints below $-4\%$ and above $8\%$ yearly growth (below $-1\%$ and above $2\%$ growth per quarter). This specific choice for the cut-off range is ad hoc and determined through simple visual inspection. The results are robust to reasonable variations of these two thresholds. Moreover, we overcome this arbitrariness with non-parametric estimates in the subsequent sections. Without the outliers, the maximum likelihood estimates of model (1) converge to more balanced results. The boom and recession regimes are now identified as $0.8\%$ and $3.2\%$ yearly growth, respectively. As is clearly visible in figure 1d, the corresponding stationary growth rate distribution is bimodal. This is in good agreement with non-parametric evidence reported in the subsequent sections. We also observe that the left (recession) peak is larger than the right (boom) peak, indicating an imbalance between the two.
However, the results of this section have to be interpreted with caution, as there may be multiple local optima of the likelihood function. An inspection of the likelihood function (not shown here) also reveals that there are sloppy manifolds in the $9$-dimensional parameter space, making the calibration intrinsically difficult with several degenerate solutions (see (Filimonov et al., 2017) and references therein). We thus turn our attention to an alternative, parameter free approach in the next section.
The results of this section are summarized in figure 1. For comparison, we also show the density distribution corresponding to the original fits obtained by Hamilton (1989) and Durland and McCurdy (1994). Interestingly, the two models differ in their prediction: The Hamilton (1989) model converges to a unimodal distribution, whereas the model by Durland and McCurdy (1994) yields a more bimodal structure. It is interesting to see that the two models predict different shapes. One should be cautious in comparing the results of these two models with ours, since they have analyzed nominal GNP data, and not real GDP per capita. We use real GDP per capita since it represents a measure for real innovation and productivity gains. In contrast, the total nominal US GDP contains two additional contributions to its growth: population growth and inflation, both of which do not represent increased income per individual.
In order to examine further the modal structure of the USD growth rate distribution, we turn our attention to non-parametric models. The classification of economic growth into phases of booms and busts has been extensively investigated in the business cycle literature. Seminal papers that use non-parametric filters are by Hodrick and Prescott (1997) and Baxter and King (1999).
Parametric or non-parametric, the traditional business cycle literature is concerned with pinning down explicit dates indicating a turning point in an economy. Furthermore, such approaches are often constrained by a priori imposed minimum or maximum business cycle durations, as specified for instance by the NBER business cycle committee (Moore and Zarnowitz, 1984). Here, we avoid this approach of preconditioning and let the data decide what are the possible cycles that stand out and justify the identification of a cycle. A first parameter free approach to this problem is to perform a spectral analysis. Figure 2 shows the spectral density $P (f)$ of the $\ln \left (\text{r-US-GDP-pc} \right)$ for both quarterly data since 1947 and annual data since 1800. We observe a scale-free continuum of frequencies. There are no peak selecting a natural frequency. Instead, all frequencies seem to contribute to the overall GDP dynamics according to a spectral weight following a simple inverse power law function $P (f) \sim 1/f^p$, where $p \approx 1.8$ obtained via a least-squares calibration. In figure 2, we show two lines $P_{RW}(f) \sim 1/f^2$ (spectral density of the random walk) and $P_{1/f}(f) \sim 1/f$ ($1/f$-spectrum) that are often taken as references. This suggests that the fluctuations of the GDP dynamics are close to that of a random walk, albeit with some departure making it less volatilite than a genuine random walk and closer to a stationary (around its long term trend) long-memory process. We stress that this observation, of a smooth continuous spectrum with no special frequency standing out, casts some doubt on the reliability of previous findings on business cycle periods. We are particularly concerned with the procedure consisting in arguing that business cycle periods should be larger than two years, say, to avoid being contaminated by "noise" at short time scales and should be smaller than ten years, say, to avoid the influence of secular trends (Burns and Mitchell, 1946). To us, this looks dangerous because it is obvious that one or two characteristic periods will appear as dominant under these imposed conditions. From a time signal analysis perspective, this corresponds to distorting the spectral density by aliasing by a window constraint.
Given this first evidence that all frequencies are important and essentially undistinguishable, we turn to the wavelet transform as a convenient tool to disentangle frequencies appearing at all scales and determine their times of occurrence.
Originally developed in geophysics to analyze seismic signals (Morlet et al., 1982), the wavelet transform has proven useful for data analysis in a variety of fields such as image processing (Antonini et al., 1992), astrophysics (Slezak et al., 1990), and turbulence (Argoul et al., 1989). In economics, the wavelet transform has many useful applications (Ramsey, 1999; Crowley, 2007), especially in the context of business cycles (Yogo, 2008; Aguiar-Conraria and Joana Soares, 2014; Ardila and Sornette, 2016).
A $\psi$-wavelet transform $W_\psi$ is simply a projection of a signal $X (\tau)$ onto $t$-translated and $s$-dilated versions of $\psi$ (Yiou et al., 2000):
$ W_\psi[X](s, t) = \int \limits_{-\infty}^{\infty} d\tau~ \psi \left(\tau-t; s \right) ~X(\tau). $ | (2) |
We call $s$ the scale and $t$ the time parameter. The analyzing function $\psi$, called the wavelet, has to be a localized function both in time and frequency domain. Depending on the application, the wavelets must be endowed with several additional properties. See for instance Daubechies (1992) for mathematical details. For our purposes, it is important for the wavelet to be properly normalized. Assuming that $\psi (t; s)$ is approximately zero for values of $t$ outside the interval $[-s, s]$, the wavelet transform has then the following intuitive interpretation: $W_\psi[X](s, t)$ is the weighted average of $X$ over the interval $[t-s, t+s]$. The wavelet transform can thus be seen as a 'mathematical microscope' that resolves local structures of $X$ (determined by the shape of the wavelet $\psi (t; s)$) at 'position' (time) $t$ and at a 'magnification' (scale) $s$. Denoting by $\ast$ the convolution operator, expression (2) can also be written compactly as $W_\psi[X](s, t) = [X (\tau) \ast \psi (\tau; s)](t)$, or, for brevity, just $X \ast \psi$.
Replacing $\psi$ in (2) by its $n$-th derivative $\psi^{(n)}$ corresponds to a $\psi$-analysis of the $n$-th derivative of the time series $X (t)$ (up to a normalization factor), as a simple integration by parts derivation shows. In this context, $\psi = \psi^{(0)}$ is also called the mother wavelet. Arneodo et al. (1993) show that the overall statistical characterization of complex structures depends only weakly on the choice of the mother wavelet. We will therefore present here only results for the Gaussian mother wavelet $\psi (t; s) = \exp (-t^2 / 2 s^2) / \sqrt{2 \pi} s$. We have checked that other real-valued mother wavelets give similar results.
In this article, we use the wavelet transform to quantify the pattern of local slopes (giving the local growth rates) of the analyzed time series (logarithm of the real US GDP per capita). This amounts to replacing $\psi$ in (2) by the first derivative $\psi^{(1)}$ of the Gaussian mother wavelet, up to a normalization. The normalization is chosen such that the wavelet transform of the test signal $X (t) = p t$ with constant slope $p$ gives exactly its slope $p$ for all times $t$ and all scales $s$. This leads to the following expression for our analyzing mother wavelet used in expression in (2):
$ \psi^{(1)}(t;s) = \frac{t}{\sqrt{2 \pi} s^3} \exp \left(- \frac{1}{2} \left(\frac{t}{s} \right)^2 \right). $ | (3) |
Note also that, by construction, the wavelet transform performed with $\psi^{(1)}(t; s)$ of a constant signal is zero, meaning that the wavelet transform is insensitive to the absolute level and only quantifies precisely the local slope at a scale $s$.
Our approach uses the wavelet transform to achieve two goals in one stroke: (ⅰ) estimate the growth rates and (ⅱ) analyse them at multiple scales. This is different from the approach of Aguiar-Conraria and Joana Soares (2014), who first calculated the growth rates by taking the first difference of the logarithm of GDP, and then applied the wavelet transform with a $\psi^{(0)}$ wavelet to the obtained time series of growth rates. Our integrated approach is better suited to minimize aliasing and biases.
In the remainder of this article, all figures are the result of the wavelet transform $X \ast \psi^{(1)}$ with $\psi^{(1)}$ given by (3). We focus on the quarterly dataset r-US-GDP-pc dataset, and present a similar analysis for the annual data over the much larger extended period between 1800 and 2010 in Appendix A.
Plotting the r-US-GDP-pc in a semi-logarithmic plot (figure 3) shows, to a first approximation, a remarkably straight line, suggesting that the GDP grows exponentially as $\exp (\rho_\text{lt} t)$ with $t$ in units of years and a long-term annual growth rate $\rho_\text{lt} \approx 2\%$ determined by an ordinary least squares (OLS) fit. This value is often reported in the literature as the average long-term historical growth of real GDP per capita, e.g. (Fernald and Jones, 2014).
Beyond this long term average growth, one can see deviations that occur again and again. Moreover, it is interesting to observe that the long-term growth rate $\rho_\text{lt}$ represented by the slope of the straight dashed line seems to almost never describe the actual local growth rate of the r-US-GDP-pc. In other words, the average growth rate does not seem to be a good description of the typical growth rates. To quantify these qualitative observations, we perform a wavelet transform analysis of the logarithm of the the r-US-GDP-pc at different times $t$ and different scales $s$ to obtain the local growth rate at time $t$, averaged over a time interval $[t-s, t+s]$, defined by
$ \rho(s, t) = \ln(\text{r-US-GDP-pc}) \ast \psi^{(1)}. $ | (4) |
The results are encoded with the color scale for the annualized growth rates in figure 3 over the period from 1947 to 2015 shown on the horizontal axis. The left vertical axis plots the scale $s$ of the wavelet analysis, corresponding to an interval of analysis approximately equal to $2s$. For scales at and lower than $s \approx 4$ years (i.e. averaged over approximately 8 years), one can first observe a hierarchy of branches associated with alternating warm (low or negative growth rates) and cold (positive and strong growth rates) colors. As one goes to smaller and smaller time scales, more fine structures of alternating colors (growth rates) can be seen. At the larger scales, $s \geqslant 4$ years, the color settles to the green value, recovering the known, and also directly determined by OLS, long term growth $\rho_\text{lt} \approx 2\%$.
Because the continuous wavelet transform (2) contains a lot of redundant information (a function $X (t)$ of one variable $t$ is transformed into a function $W_\psi[X](s, t)$ of two variables $s$ and $t$), it is standard to compress the wavelet map shown in figure 3 into a so-called "skeleton". The skeleton of $W_\psi[X](s, t)$ is the set of all local maxima and minima of $W_\psi[X](s, t)$ considered as a function of $t$, for fixed scale $s$. The skeleton forms a set of connected curves in the time-scale space, called the extrema lines. Geometrically, each such skeleton line corresponds to either a crest or valley bottom of the three-dimensional representation of the wavelet function $W_\psi[X](s, t)$. A crest can be viewed as the typical value of the growth rate of a locally surging r-US-GDP-pc. The bottom of a valley is similarly the typical value of the growth rate of a locally slowing down or contracting r-US-GDP-pc. The skeleton structure thus serves as a proxy of (half-) business cycles.
As is clearly visible in figure 4, business cycles are emerging at all scales. There is thus no such thing as "the" business cycle, but rather a continous hierarchy of overlaid business cycle fluctuations. One can observe clearly the hierarchy of alternating growth regimes, which combine into an overall growth of $\approx 2\%$ at large scales. Written along each skeleton line in the figure, we give the values of the local annualized growth rates at four scale levels, 3 months, 6 months, 18 months and 3 years. The structure of the skeleton lines, their colors and the values of the local annualized growth rates confirm the existence of ubiquitous shifting regimes of slow and strong growths. In economics, it has been popular to detrend a time series for its long term growth rate. Our results make this detrending appear somewhat arbitrary, as there is no discrete distinction between short-, medium-and long-term growth.
The nature of the shifting regimes of slow and strong growths can be quantified further by constructing the probability density distributions (pdf) of annualized GDP growth rates at different fixed scales, both from the entire wavelet transform (figure 3) and from the skeleton structure (figure 4). The obtained pdf's for four different scales (6, 9, 15 and 30 months) are depicted in figure 5. They have been obtained using a Gaussian kernel estimations with width equal to $0.002$. We have checked the robustness of these pdf's by changing the width of the kernels within a factor of two.
The pdf's extracted from the wavelet transform shown in figure 3 and from the skeleton values shown in figure 4 exhibit the same structures. First, the pdf's at the largest scale of 30 months peak at the annualized growth rate of $\approx 2\%$, recovering the OLS value reported above (shown as the dashed line in figure 3). Second, as we go down to smaller scales, already at the scale of 15 months, and more pronounced at the scale of 9 and 6 months, a clear bimodal structure emerges (decorated by higher frequency structures, associated with the width of the estimating kernel). Denoting the two main peaks of the bimodal density extracted from the full wavelet transform (the skeleton gives similar results) at scale $s$ by $\rho_\text{low}(s)$ and $\rho_\text{high}(s)$ respectively, we obtain
$ \rho_\text{low}(6 \text{ months}) \approx 1\% \lesssim \rho_\text{low}(9 \text{ months}) \approx 1.1\% \lesssim \rho_\text{low}(15 \text{ months}) \approx 1.5\% \lesssim \rho_\text{lt} \approx 2\% $ | (5) |
and
$ \rho_\text{high}(6 \text{ months}) \approx 3.1\% \gtrsim \rho_\text{high}(9 \text{ months}) \approx 2.8\% \approx \rho_\text{high}(15 \text{ months}) \approx 2.8\% \gtrsim \rho_\text{lt} \approx 2\%. $ | (6) |
The pleasant stability for the estimates $\rho_\text{low}(6 \text{ months}) \approx \rho_\text{low}(9 \text{ months})$ and $\rho_\text{high}(6 \text{ months}) \approx \rho_\text{high}(9 \text{ months}) \approx \rho_\text{high}(15 \text{ months})$ suggests that real US GDP per capita can be modelled as an alternation of slow growth around a typical value of $1\%$ and strong growth around a typical value of $3\%$, which bracket the long-term average growth rate $\rho_\text{lt} \approx 2\%$. This bimodality and the appearance of business cycles at all scales constitute the main results of our article.
Finally, we examine the significance of our results from a statistical point of view. How reliable is the observed bimodality, considering that there are only $270$ datapoints? How likely is it to observe a bimodal structure, when sampling $270$ datapoints from a unimodal density? What is the probability of observing a tri-or multi-modal structure, when sampling from a bimodal density? These questions are formally addressed in the statistical test developed by Silverman (1981). This allows us to test the null hypothesis, $H_k$, that the density underlying the data has $k$ modes, against the alternative that the density has more than $k$ modes. Here, we test the quarterly growth rates obtained from the wavelet analysis for both unimodality $(k=1)$ and bimodality $(k=2)$. The $p$-value associated with $H_k$ gives the probability of observing such a sample distribution, assuming that underlying density is truly $k$-modal. Large $p$-values for test $H_k$ indicate thus strong statistical evidence for $k$-modality. The $p$-values, summarized in table 1, are in good agreement with our expectations. At smaller scales, the bimodality hypothesis $H_2$ is clearly preferred over a unimodal distribution. At larger scales, this relationship tips over in favor for the unimodal hypothesis $H_1$.
6 months scale | 9 months scale | 15 months scale | 30 months scale | |
H1 | 0.05 | 0.16 | 0.22 | 0.94 |
H2 | 0.31 | 0.62 | 0.47 | 0.09 |
In conclusion, we have presented evidence that the real US GDP per capita growth rate distribution exhibits a bimodal structure. This is, to the best of our knowledge, the first time that the bimodal character of this distribution has been analyzed explicitly. We stress again the subtle, but very important distinction between the interpretation of business cycles when the GDP distribution is unimodal versus bimodal. A unimodal distribution peaked at $2\%$ represents the case where a $2\%$ growth is the norm, in the sense that the bulk of probability mass is concentrated there. In contrast, a bimodal distribution represents the case where a $2\%$ growth rate is uncommon, in the sense of small probability mass in that regime.
Appendix A presents the wavelet transform, skeleton structure and growth rate distributions for annual r-US-GDP-pc data starting in 1800 till 2010. The important conclusion is that the previous observations presented above for quarterly data from 1950 to 2015 are broadly confirmed when using annual data over this much longer period.
We have presented a quantitative characterisation of the fluctuations of the annualized growth rate of the real US GDP per capita growth at many scales, using a wavelet transform analysis of two data sets, quarterly data from 1947 to 2015 and annual data from 1800 to 2010. We stress that our use of the chosen mother wavelet (first derivative of the Gaussian function) applied to the logarithm of the real US GDP per capita provides a robust estimation of the instantaneous growth rate at different scales. Our main finding is that business cycles appear at all scales and the distribution of GDP growth rates can be well approximated by a bimodal function associated to a series of switches between regimes of strong growth rate $\rho_\text{high}$ and regimes of low growth rate $\rho_\text{low}$. The succession of alternations of these two regimes compounds to produce a remarkably stable long term average real annualized growth rate of 1.6% from 1800 to 2010 and $\approx 2.0\%$ since 1950.
We thus infer that the robust constant growth rate since 1950 cannot be taken as evidence for a purely exogenous "natural" rate of innovations and productivity growth. It is rather a remarkable output of the succession of booms and corrections that punctuate the economic history of the US since more than 200 years. Our results suggest that alternating growth regimes are intrinsic to the dynamics of the US economy and appear at all scales. These alternating regimes can be identified as generalized business cycles, occurring at the scale of the whole economy.
Such business cycles may be briefly rationalised as follows. During the high growth regime, a number of positive feedback loops are in operation, such as deregulation, enhanced credit creation, the belief in a "new economy" and so on. This creates a transient boom, perhaps accelerating itself and leading to financial and social bubbles (Geraskin, 2013; Sornette, 2014; Yukalov, 2015; Sornette, 2008; Gisler, 2009; Gisler, 2011). This over heating of the economy then turns out not to be sustainable and leads to a correction and consolidation phase, the low growth regime. Then, the next strong growth regime starts and so on.
Our findings suggest that strong growth cannot be dissociated from periods of recessions, corrections or plateaus, which serve as a consolidation phase before the next boom starts. However, because of the remarkable recurrence of the strong regime and in view of its short-term beneficial effects, economists and policy makers tend to form expectations of strong continuous growth. Such way of thinking may lead to conclusions that, we argue, may have little merit. Consider the estimation of the US Federal Reserve Bank of Dallas (Atkinson et al., 2013) that the cost of the 2008 crisis, assuming output eventually returning to its pre-crisis trend path, is an output loss of $6 trillion to $14 trillion US dollars. These enormous numbers are based on the integration of the difference between the extrapolation of hypothetical GDP trajectories expected from a typical return to pre-crisis growth compared with the realised GDP per capita. In the light of our findings, we argue that it is incorrect to extrapolate to the pre-crisis growth rate, which is by construction abnormally high, and much higher than the long term growth rate. In addition, one should take into account the fact that the base rate after a crisis should be low or even negative, for the consolidation to work. Moreover, the duration of the boom years may have direct impact on that of the recovery period. In this vein, Sornette (2014) have argued that this 2008 crisis is special, as it is the culmination of a 30 year trend of accelerating financialization, deregulation and debt growth. Our present results impel the reader to ponder what is the "natural" growth rate and avoid naive extrapolations.
Using a simple generic agent-based model of growth, Louzoun et al. (2003) have identified the existence of a trade off between either low and steady growth or large growth associated with high volatility. Translating this insight to the US economy and combining with the reported empirical evidence, the observed growth features shown in the present paper seem to reveal a remarkable stable relationship between growth and its fluctuations over many decades, if not centuries. Perhaps, this is anchored in the political institutions as well as in the psychology of policy makers and business leaders over the long term that transcend the short-term vagaries of political power sharing and geopolitics. It is however important to include in these considerations the fact that the US is unique compared with other developed countries, having benefitted enormously from the two world wars in particular (compared with the destruction of the French, Japanese and UK empires and the demise of the economic dominance of European powers).
The research performed by S. Lera was conducted at the Future Resilient Systems at the Singapore-ETH Centre (SEC). The SEC was established as a collaboration between ETH Zurich and National Research Foundation (NRF) Singapore (FI 370074011) under the auspices of the NRF's Campus for Research Excellence and Technological Enterprise (CREATE) programme.
All authors declare no conflicts of interest in this paper.
In this appendix, we present wavelet transform, skeleton structure and growth rate distributions for annual r-US-GDP-pc data starting in 1800 till 2010. The important conclusion is that the previous observations presented in the main text for quarterly data from 1950 to 2015 are broadly confirmed when using annual data over this much longer period.
Figure A1 shows the wavelet transform $\ln (\text{r-US-GDP-pc}) \ast \psi^{(1)}$ of the logarithm of the annual real US GDP per capita data measured in 1990 Geary-Khamis dollar from 1800 to 2010 and represented by the continuous dark line (right vertical axis). An ordinary least squares fit determines a long-term annualized growth rate $\rho_\text{lt}$ of approximately $1.6\%$. This value is smaller than the average growth rate of $2\%$ determined for the period from 1950 to 2015. This smaller value is a compromise, given the rather clear long term upward curvature presented by the continuous curve shown in figure A1, expressing a tendency for the growth rate to grow itself (Johanssen and Sornette, 2001). Indeed, one can see that $\ln (\text{r-US-GDP-pc})$ departs more and more from the dashed straight line with a larger slope after 1950, in line with the observations shown in figure 3. Figure A2 depicts the skeleton structure extracted from figure A1 and figure A3 plots the distribution of growth rates of the r-US-GDP-pc extracted from annual real US GDP per capita data since 1800. As for the quarterly GDP data, the long term growth rate of $\approx 1.5\%$ is recovered as the peak of the distribution at the $8$ year scale. The bimodal structure is less clean, due to the fact that annual sampling of GDP growth rates is bound to average over the time scales during which the transitions between the different regimes occur. Nevertheless, one can observe two main peaks, except for the largest time scale of $8$ years. Moreover, both at the $1$ and $2$ year scales, the estimated probability density functions (pdf) exhibit a positive skewness, with an asymmetric tail to the right side of large positive growth rates. This means that a considerable part of the probability mass is concentrated at high growth regimes above $\rho_\text{lt}$. Quantitatively, the values of the growth rates corresponding to the two main peaks of the pdf's are: $\rho_\text{low}(1, 2, 4 \text{ years}) = 0.2\%, 1\%, 1.2\%$ and $\rho_\text{high}(1, 2, 4 \text{years}) = 1.4\%, 1.9\%, 1.8\%$. The rather low value $\rho_\text{high}(1 \text{year}) = 1.4\%$ should be considered together with the evidence of the strong positive skewness noted above: at the annual sampling rate, the granularity of the data is too coarse to recover the clean picture of the quarterly data due to overlapping intervals. However, we find that the $50\%$-quantile growth rate is $1.3\%$, while the expectation value of the growth rates conditional on growth rates above $1.3\%$ is equal to $3.3\%$, much larger than $\rho_\text{lt}$. The results are thus in broad agreement with those presented in figure 5 for quarterly data. The $p$-values obtained from the Silverman (1981) test, reported in table A1, furthermore support the bimodality hypothesis.
6 months scale | 9 months scale | 15 months scale | 30 months scale | |
H1 | 0.08 | 0.05 | 0.00 | 0.36 |
H2 | 0.19 | 0.13 | 0.38 | 0.12 |
[1] |
Gallo JM (2010) Pharmacokinetic/pharmacodynamic-driven drug development. Mt Sinai J Med N Y 77: 381–388. doi: 10.1002/msj.20193
![]() |
[2] |
Chien JY, Friedrich S, Heathman MA, et al. (2005) Pharmacokinetics/pharmacodynamics and the stages of drug development: Role of modeling and simulation. AAPS J 7: E544–E559. doi: 10.1208/aapsj070355
![]() |
[3] | Garralda E, Dienstmann R, Tabernero J (2017) Pharmacokinetic/pharmacodynamic modeling for drug development in oncology. Am Soc Clin Oncol Educ 37: 210–215. |
[4] | Dingemanse J, Krause A (2017) Impact of pharmacokinetic-pharmacodynamic modelling in early clinical drug development. Eur J Pharm Sci 109S: S53–S58. |
[5] | Glassman PM, Balthasar JP (2014) Mechanistic considerations for the use of monoclonal antibodies for cancer therapy. Cancer Biol Med 11: 20–33. |
[6] | Rajasekaran N, Chester C, Yonezawa A, et al. (2015) Enhancement of antibody-dependent cell mediated cytotoxicity: A new era in cancer treatment. ImmunoTargets Ther 4: 91–100. |
[7] | Krishna M, Nadler SG (2016) Immunogenicity to biotherapeutics-the role of anti-drug immune complexes. Front Immunol 7: 21. |
[8] | Kamath AV (2016) Translational pharmacokinetics and pharmacodynamics of monoclonal antibodies. Drug Discov Today Technol S21–22: 75–83. |
[9] |
Gomez-Mantilla JD, Troconiz IF, Parra-Guillen Z, et al. (2014) Review on modeling anti-antibody responses to monoclonal antibodies. J Pharmacokinet Pharmacodyn 41: 523–536. doi: 10.1007/s10928-014-9367-z
![]() |
[10] |
Adams GP, Weiner LM (2005) Monoclonal antibody therapy of cancer. Nat Biotechnol 23: 1147–1157. doi: 10.1038/nbt1137
![]() |
[11] |
Cornett DS, Reyzer ML, Chaurand P, et al. (2007) Maldi imaging mass spectrometry: Molecular snapshots of biochemical systems. Nat Methods 4: 828–833. doi: 10.1038/nmeth1094
![]() |
[12] |
Rompp A, Spengler B (2013) Mass spectrometry imaging with high resolution in mass and space. Histochem Cell Biol 139: 759–783. doi: 10.1007/s00418-013-1097-6
![]() |
[13] |
Calligaris D, Caragacianu D, Liu X, et al. (2014) Application of desorption electrospray ionization mass spectrometry imaging in breast cancer margin analysis. Proc Natl Acad Sci U. S. A 111: 15184–15189. doi: 10.1073/pnas.1408129111
![]() |
[14] |
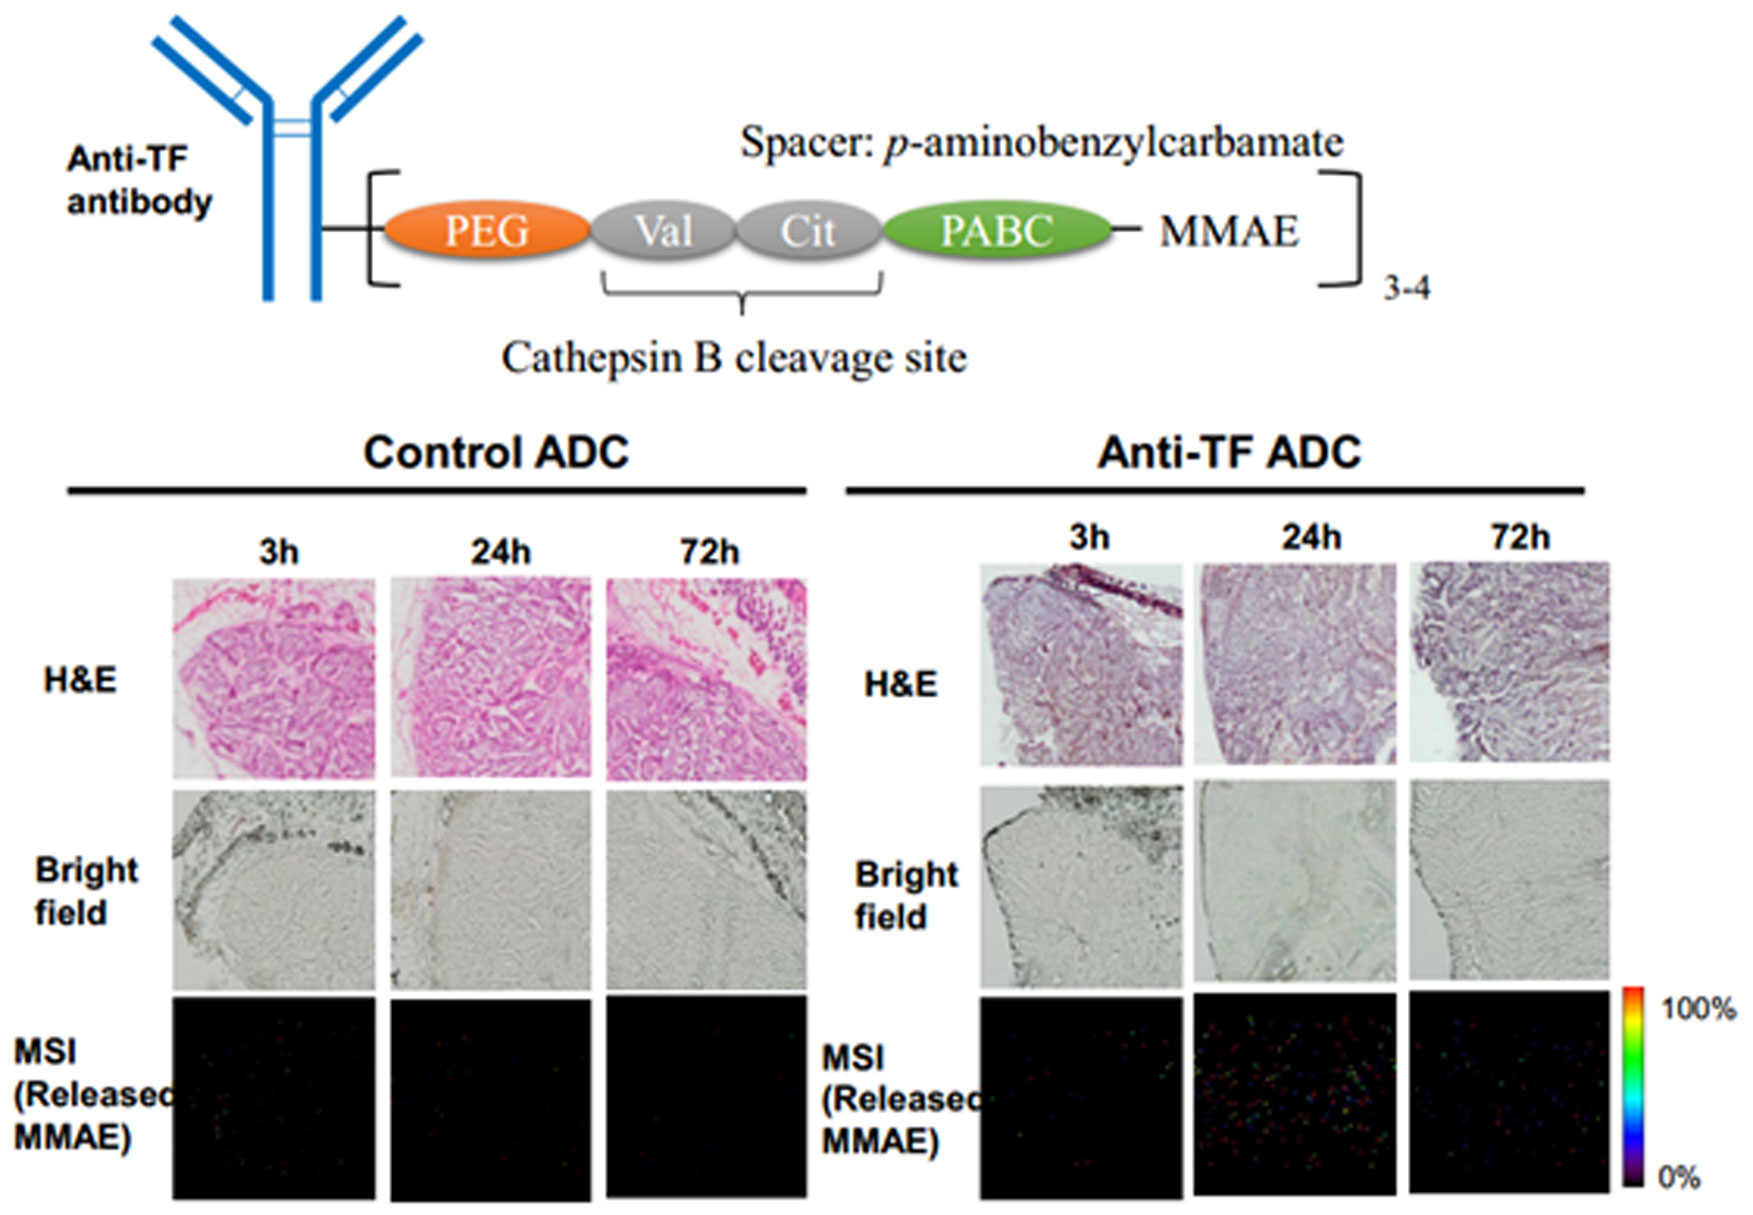
Yasunaga M, Manabe S, Tsuji A, et al. (2017) Development of antibody-drug conjugates using dds and molecular imaging. Bioengineering 4: 78. doi: 10.3390/bioengineering4030078
![]() |
[15] |
Wu C, Dill AL, Eberlin LS, et al. (2013) Mass spectrometry imaging under ambient conditions. Mass Spectrom Rev 32: 218–243. doi: 10.1002/mas.21360
![]() |
[16] |
Murray KK, Seneviratne CA, Ghorai S (2016) High resolution laser mass spectrometry bioimaging. Methods 104: 118–126. doi: 10.1016/j.ymeth.2016.03.002
![]() |
[17] |
Stoeckli M, Chaurand P, Hallahan DE, et al. (2001) Imaging mass spectrometry: A new technology for the analysis of protein expression in mammalian tissues. Nat Med 7: 493–496. doi: 10.1038/86573
![]() |
[18] |
McDonnell LA, Heeren RM (2007) Imaging mass spectrometry. Mass Spectrom Rev 26: 606–643. doi: 10.1002/mas.20124
![]() |
[19] |
Caprioli RM, Farmer TB, Gile J (1997) Molecular imaging of biological samples: Localization of peptides and proteins using maldi-tof ms. Anal Chem 69: 4751–4760. doi: 10.1021/ac970888i
![]() |
[20] |
Wulfkuhle JD, Liotta LA, Petricoin EF (2003) Proteomic applications for the early detection of cancer. Nat Rev Cancer 3: 267–275. doi: 10.1038/nrc1043
![]() |
[21] |
Fujiwara Y, Furuta M, Manabe S, et al. (2016) Imaging mass spectrometry for the precise design of antibody-drug conjugates. Sci Rep 6: 24954. doi: 10.1038/srep24954
![]() |
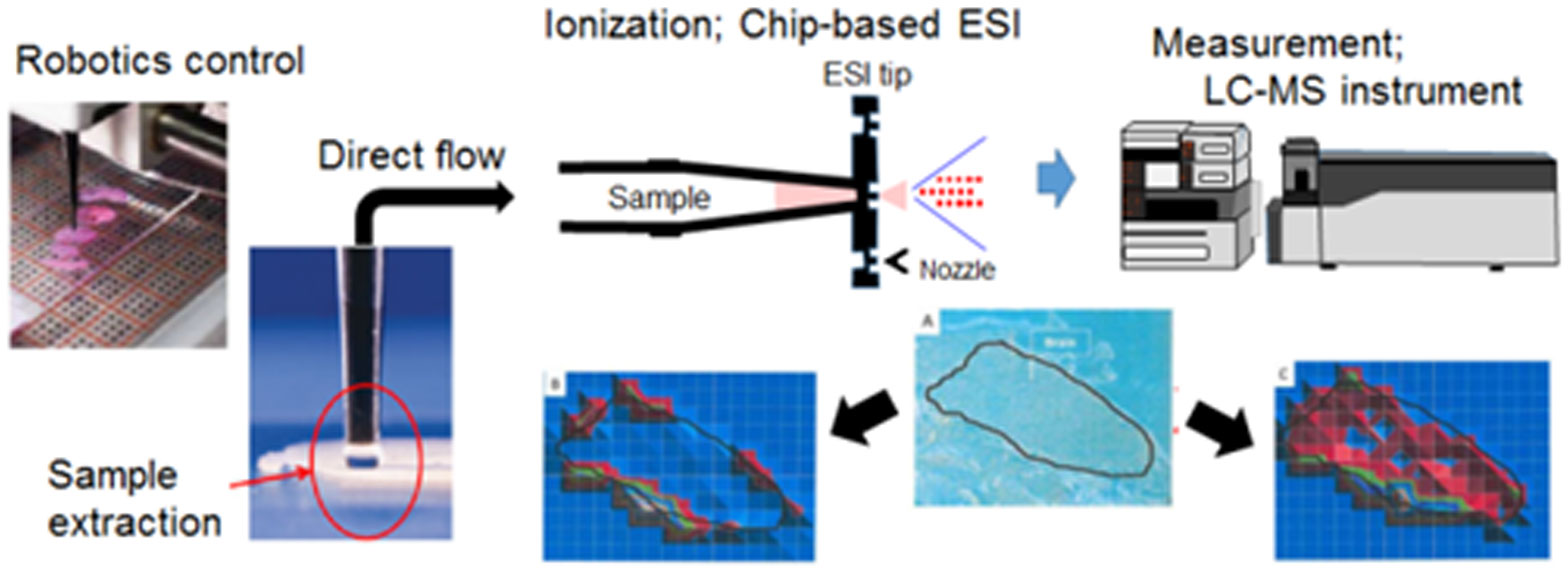
[22] | Yasunaga M, Furuta M, Ogata K, et al. (2013) The significance of microscopic mass spectrometry with high resolution in the visualisation of drug distribution. Sci Rep 3: 3050. |
[23] |
Peletier LA, Gabrielsson J (2012) Dynamics of target-mediated drug disposition: Characteristic profiles and parameter identification. J Pharmacokinet Pharmacodyn 39: 429–451. doi: 10.1007/s10928-012-9260-6
![]() |
[24] | Pineda C, Jacobs IA, Alvarez DF, et al. (2016) Assessing the immunogenicity of biopharmaceuticals. Biodrugs 30: 195–206. |
[25] |
Hampe CS (2012) Protective role of anti-idiotypic antibodies in autoimmunity-lessons for type 1 diabetes. Autoimmunity 45: 320–331. doi: 10.3109/08916934.2012.659299
![]() |
[26] |
Thomas A, Teicher BA, Hassan R (2016) Antibody-drug conjugates for cancer therapy. Lancet Oncol 17: e254–e262. doi: 10.1016/S1470-2045(16)30030-4
![]() |
[27] |
Diamantis N, Banerji U (2016) Antibody-drug conjugates-an emerging class of cancer treatment. Br J Cancer 114: 362–367. doi: 10.1038/bjc.2015.435
![]() |
[28] |
Damelin M, Zhong W, Myers J, et al. (2015) Evolving strategies for target selection for antibody-drug conjugates. Pharm Res 32: 3494–3507. doi: 10.1007/s11095-015-1624-3
![]() |
[29] |
Senter PD, Sievers EL (2012) The discovery and development of brentuximab vedotin for use in relapsed hodgkin lymphoma and systemic anaplastic large cell lymphoma. Nat Biotechnol 30: 631–637. doi: 10.1038/nbt.2289
![]() |
[30] |
Ogitani Y, Aida T, Hagihara K, et al. (2016) Ds-8201a, a novel her2-targeting adc with a novel DNA topoisomerase i inhibitor, demonstrates a promising antitumor efficacy with differentiation from t-dm1. Clin Cancer Res 22: 5097–5108. doi: 10.1158/1078-0432.CCR-15-2822
![]() |
[31] |
Sau S, Alsaab HO, Kashaw SK, et al. (2017) Advances in antibody-drug conjugates: A new era of targeted cancer therapy. Drug Discovery Today 22: 1547–1556. doi: 10.1016/j.drudis.2017.05.011
![]() |
[32] |
Mitsunaga M, Ogawa M, Kosaka N, et al. (2011) Cancer cell-selective in vivo near infrared photoimmunotherapy targeting specific membrane molecules. Nat Med 17: 1685–1691. doi: 10.1038/nm.2554
![]() |
[33] |
Larson SM, Carrasquillo JA, Cheung NK, et al. (2015) Radioimmunotherapy of human tumours. Nat Rev Cancer 15: 347–360. doi: 10.1038/nrc3925
![]() |
[34] | Sau S, Alsaab HO, Kashaw SK, et al. (2017) Advances in antibody-drug conjugates: A new era of targeted cancer therapy. Drug Discovery Today. |
[35] |
Gerber HP, Sapra P, Loganzo F, et al. (2016) Combining antibody-drug conjugates and immune-mediated cancer therapy: What to expect? Biochem Pharmacol 102: 1–6. doi: 10.1016/j.bcp.2015.12.008
![]() |
[36] |
Alsaab HO, Sau S, Alzhrani R, et al. (2017) Pd-1 and pd-l1 checkpoint signaling inhibition for cancer immunotherapy: Mechanism, combinations, and clinical outcome. Front Pharmacol 8: 561. doi: 10.3389/fphar.2017.00561
![]() |
[37] |
Matsumura Y (2014) The drug discovery by nanomedicine and its clinical experience. Jpn J Clin Oncol 44: 515–525. doi: 10.1093/jjco/hyu046
![]() |
[38] |
Nishiyama N, Matsumura Y, Kataoka K (2016) Development of polymeric micelles for targeting intractable cancers. Cancer Sci 107: 867–874. doi: 10.1111/cas.12960
![]() |
[39] | Matsumura Y, Maeda H (1986) A new concept for macromolecular therapeutics in cancer chemotherapy: Mechanism of tumoritropic accumulation of proteins and the antitumor agent smancs. Cancer Res 46: 6387–6392. |
[40] |
Cabral H, Matsumoto Y, Mizuno K, et al. (2011) Accumulation of sub-100 nm polymeric micelles in poorly permeable tumours depends on size. Nat Nanotechnol 6: 815–823. doi: 10.1038/nnano.2011.166
![]() |
[41] |
Oku N (2017) Innovations in liposomal dds technology and its application for the treatment of various diseases. Biol Pharm Bull 40: 119–127. doi: 10.1248/bpb.b16-00857
![]() |
[42] |
Kinoshita R, Ishima Y, Chuang VTG, et al. (2017) Improved anticancer effects of albumin-bound paclitaxel nanoparticle via augmentation of epr effect and albumin-protein interactions using s-nitrosated human serum albumin dimer. Biomaterials 140: 162–169. doi: 10.1016/j.biomaterials.2017.06.021
![]() |
[43] |
Duncan R (2006) Polymer conjugates as anticancer nanomedicines. Nat Rev Cancer 6: 688–701. doi: 10.1038/nrc1958
![]() |
[44] |
Yokoyama M (2014) Polymeric micelles as drug carriers: Their lights and shadows. J Drug Targeting 22: 576–583. doi: 10.3109/1061186X.2014.934688
![]() |
[45] |
Jain RK, Stylianopoulos T (2010) Delivering nanomedicine to solid tumors. Nat Rev Clin Oncol 7: 653–664. doi: 10.1038/nrclinonc.2010.139
![]() |
[46] |
Allen TM, Cullis PR (2013) Liposomal drug delivery systems: From concept to clinical applications. Adv Drug Delivery Rev 65: 36–48. doi: 10.1016/j.addr.2012.09.037
![]() |
[47] |
Bae Y, Nishiyama N, Fukushima S, et al. (2005) Preparation and biological characterization of polymeric micelle drug carriers with intracellular ph-triggered drug release property: Tumor permeability, controlled subcellular drug distribution, and enhanced in vivo antitumor efficacy. Bioconjugate Chem 16: 122–130. doi: 10.1021/bc0498166
![]() |
[48] |
Kraft JC, Freeling JP, Wang Z, et al. (2014) Emerging research and clinical development trends of liposome and lipid nanoparticle drug delivery systems. J Pharm Sci 103: 29–52. doi: 10.1002/jps.23773
![]() |
[49] | Rao W, Pan N, Yang Z (2016) Applications of the single-probe: Mass spectrometry imaging and single cell analysis under ambient conditions. J Visualized Exp JoVE 2016: 53911. |
[50] |
Calligaris D, Feldman DR, Norton I, et al. (2015) Molecular typing of meningiomas by desorption electrospray ionization mass spectrometry imaging for surgical decision-making. Int J Mass Spectrom 377: 690–698. doi: 10.1016/j.ijms.2014.06.024
![]() |
[51] |
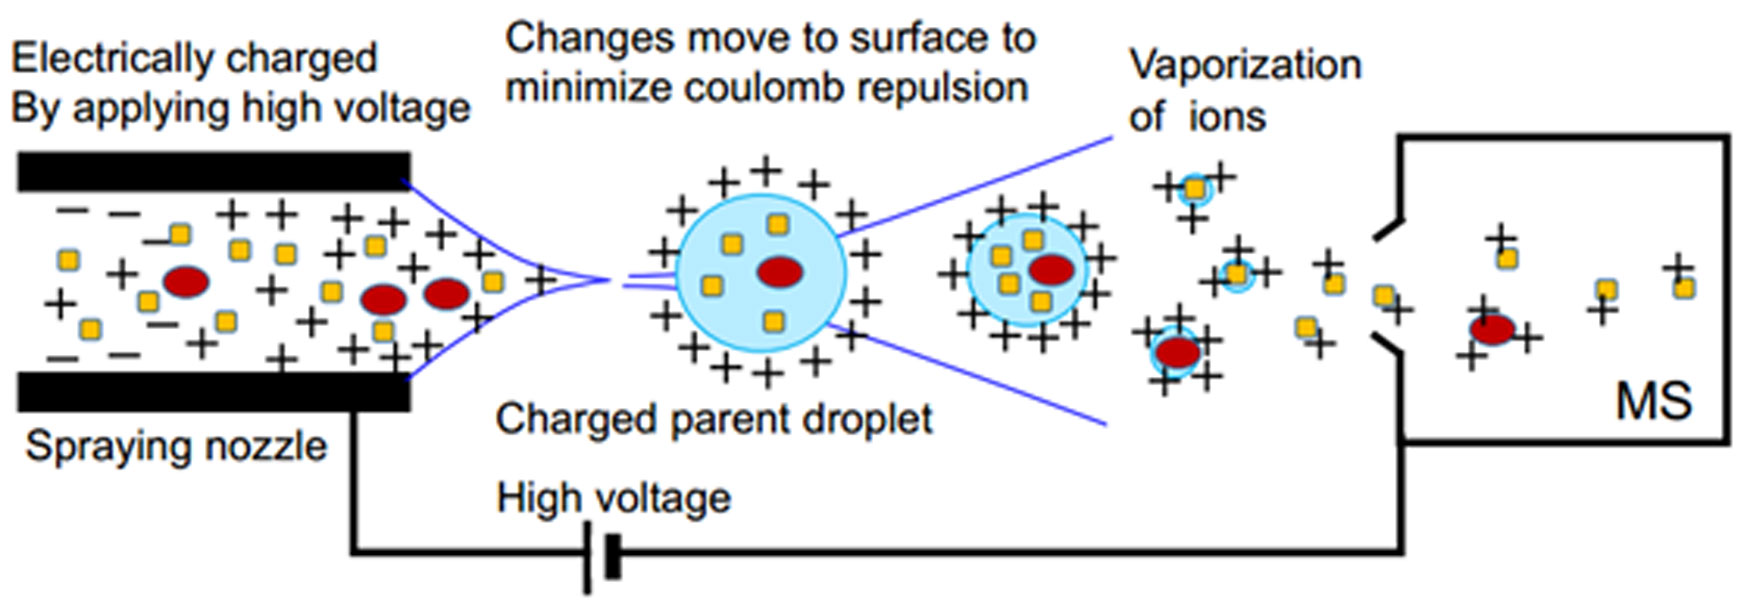
Fenn JB, Mann M, Meng CK, et al. (1989) Electrospray ionization for mass spectrometry of large biomolecules. Science 246: 64–71. doi: 10.1126/science.2675315
![]() |
[52] |
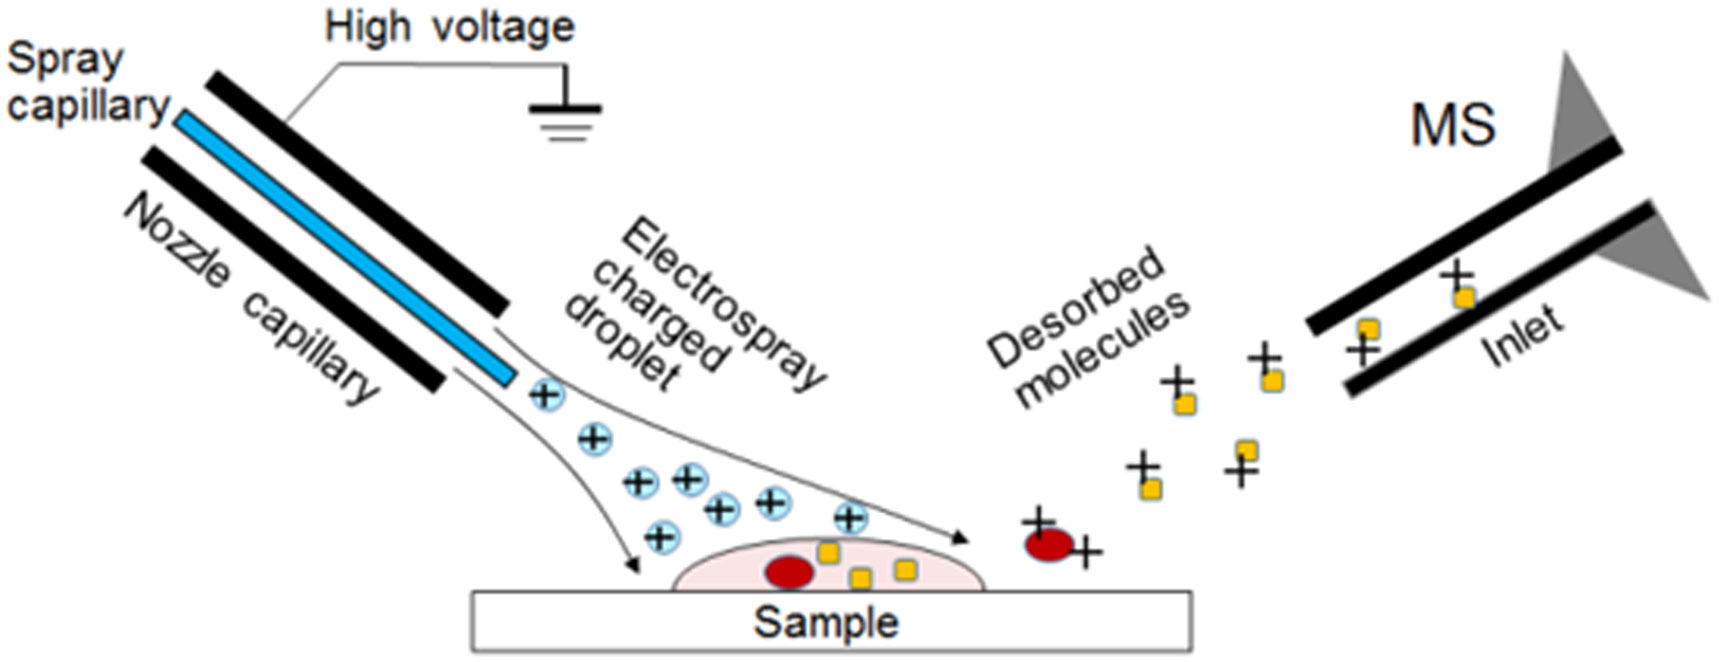
Takats Z, Wiseman JM, Gologan B, et al. (2004) Mass spectrometry sampling under ambient conditions with desorption electrospray ionization. Science 306: 471–473. doi: 10.1126/science.1104404
![]() |
[53] | Parrot D, Papazian S, Foil D, et al. (2018) Imaging the unimaginable: Desorption electrospray ionization-imaging mass spectrometry (desi-ims) in natural product research. Planta Med. |
[54] | Cooks RG, Ouyang Z, Takats Z, et al. (2006) Detection technologies. Ambient mass spectrometry. Science 311: 1566–1570. |
[55] |
Zimmerman TA, Monroe EB, Tucker KR, et al. (2008) Chapter 13: Imaging of cells and tissues with mass spectrometry: Adding chemical information to imaging. Methods Cell Biol 89: 361–390. doi: 10.1016/S0091-679X(08)00613-4
![]() |
[56] | Signor L, Boeri EE (2013) Matrix-assisted laser desorption/ionization time of flight (maldi-tof) mass spectrometric analysis of intact proteins larger than 100 kda. J Visualized Exp JoVE 108: e50635. |
[57] |
Sudhir PR, Wu HF, Zhou ZC (2005) Identification of peptides using gold nanoparticle-assisted single-drop microextraction coupled with ap-maldi mass spectrometry. Anal Chem 77: 7380–7385. doi: 10.1021/ac051162m
![]() |
[58] |
Abdelhamid HN, Wu HF (2012) A method to detect metal-drug complexes and their interactions with pathogenic bacteria via graphene nanosheet assist laser desorption/ionization mass spectrometry and biosensors. Anal Chim Acta 751: 94–104. doi: 10.1016/j.aca.2012.09.012
![]() |
[59] |
Abdelhamid HN, Wu HF (2013) Furoic and mefenamic acids as new matrices for matrix assisted laser desorption/ionization-(maldi)-mass spectrometry. Talanta 115: 442–450. doi: 10.1016/j.talanta.2013.05.050
![]() |
[60] |
Nasser AH, Wu BS, Wu HF (2014) Graphene coated silica applied for high ionization matrix assisted laser desorption/ionization mass spectrometry: A novel approach for environmental and biomolecule analysis. Talanta 126: 27–37. doi: 10.1016/j.talanta.2014.03.016
![]() |
[61] |
Abdelhamid HN, Wu HF (2015) Synthesis of a highly dispersive sinapinic acid@graphene oxide (sa@go) and its applications as a novel surface assisted laser desorption/ionization mass spectrometry for proteomics and pathogenic bacteria biosensing. Analyst 140: 1555–1565. doi: 10.1039/C4AN02158D
![]() |
[62] |
Abdelhamid HN, Wu HF (2016) Gold nanoparticles assisted laser desorption/ionization mass spectrometry and applications: From simple molecules to intact cells. Anal Bioanal Chem 408: 4485–4502. doi: 10.1007/s00216-016-9374-6
![]() |
[63] |
Harada T, Yuba-Kubo A, Sugiura Y, et al. (2009) Visualization of volatile substances in different organelles with an atmospheric-pressure mass microscope. Anal Chem 81: 9153–9157. doi: 10.1021/ac901872n
![]() |
[64] |
Saito Y, Waki M, Hameed S, et al. (2012) Development of imaging mass spectrometry. Biol Pharm Bull 35: 1417–1424. doi: 10.1248/bpb.b212007
![]() |
[65] |
Sugiura Y, Honda K, Suematsu M (2015) Development of an imaging mass spectrometry technique for visualizing localized cellular signaling mediators in tissues. Mass Spectrom 4: A0040. doi: 10.5702/massspectrometry.A0040
![]() |
[66] |
Setou M, Kurabe N (2011) Mass microscopy: High-resolution imaging mass spectrometry. J Electron Microsc 60: 47–56. doi: 10.1093/jmicro/dfq079
![]() |
[67] |
Maeda H (2001) Smancs and polymer-conjugated macromolecular drugs: Advantages in cancer chemotherapy. Adv Drug Delivery Rev 46: 169–185. doi: 10.1016/S0169-409X(00)00134-4
![]() |
[68] |
Barenholz Y (2012) Doxil(r)-the first fda-approved nano-drug: Lessons learned. J Controlled Release 160: 117–134. doi: 10.1016/j.jconrel.2012.03.020
![]() |
[69] |
Giordano G, Pancione M, Olivieri N, et al. (2017) Nano albumin bound-paclitaxel in pancreatic cancer: Current evidences and future directions. World J Gastroenterol 23: 5875–5886. doi: 10.3748/wjg.v23.i32.5875
![]() |
[70] |
Kogure K, Akita H, Yamada Y, et al. (2008) Multifunctional envelope-type nano device (mend) as a non-viral gene delivery system. Adv Drug Delivery Rev 60: 559–571. doi: 10.1016/j.addr.2007.10.007
![]() |
[71] |
Sugaya A, Hyodo I, Koga Y, et al. (2016) Utility of epirubicin-incorporating micelles tagged with anti-tissue factor antibody clone with no anticoagulant effect. Cancer Sci 107: 335–340. doi: 10.1111/cas.12863
![]() |
[72] |
Hiyama E, Ali A, Amer S, et al. (2015) Direct lipido-metabolomics of single floating cells for analysis of circulating tumor cells by live single-cell mass spectrometry. Anal Sci 31: 1215–1217. doi: 10.2116/analsci.31.1215
![]() |
[73] |
Hamaguchi T, Matsumura Y, Suzuki M, et al. (2005) Nk105, a paclitaxel-incorporating micellar nanoparticle formulation, can extend in vivo antitumour activity and reduce the neurotoxicity of paclitaxel. Br J Cancer 92: 1240–1246. doi: 10.1038/sj.bjc.6602479
![]() |
[74] |
Verma S, Miles D, Gianni L, et al. (2012) Trastuzumab emtansine for her2-positive advanced breast cancer. N Engl J Med 367: 1783–1791. doi: 10.1056/NEJMoa1209124
![]() |
[75] |
Younes A, Gopal AK, Smith SE, et al. (2012) Results of a pivotal phase ii study of brentuximab vedotin for patients with relapsed or refractory hodgkin's lymphoma. J Clin Oncol 30: 2183–2189. doi: 10.1200/JCO.2011.38.0410
![]() |
[76] |
Pro B, Advani R, Brice P, et al. (2012) Brentuximab vedotin (sgn-35) in patients with relapsed or refractory systemic anaplastic large-cell lymphoma: Results of a phase ii study. J Clin Oncol 30: 2190–2196. doi: 10.1200/JCO.2011.38.0402
![]() |
[77] |
Doronina SO, Toki BE, Torgov MY, et al. (2003) Development of potent monoclonal antibody auristatin conjugates for cancer therapy. Nat Biotechnol 21: 778–784. doi: 10.1038/nbt832
![]() |
[78] |
Lyon RP, Bovee TD, Doronina SO, et al. (2015) Reducing hydrophobicity of homogeneous antibody-drug conjugates improves pharmacokinetics and therapeutic index. Nat Biotechnol 33: 733–735. doi: 10.1038/nbt.3212
![]() |
[79] |
Hisada Y, Yasunaga M, Hanaoka S, et al. (2013) Discovery of an uncovered region in fibrin clots and its clinical significance. Sci Rep 3: 2604. doi: 10.1038/srep02604
![]() |
[80] |
Takashima H, Tsuji AB, Saga T, et al. (2017) Molecular imaging using an anti-human tissue factor monoclonal antibody in an orthotopic glioma xenograft model. Sci Rep 7: 12341. doi: 10.1038/s41598-017-12563-5
![]() |
[81] |
Koga Y, Manabe S, Aihara Y, et al. (2015) Antitumor effect of antitissue factor antibody-mmae conjugate in human pancreatic tumor xenografts. Int J Cancer 137: 1457–1466. doi: 10.1002/ijc.29492
![]() |
[82] |
Rao W, Celiz AD, Scurr DJ, et al. (2013) Ambient desi and lesa-ms analysis of proteins adsorbed to a biomaterial surface using in-situ surface tryptic digestion. J Am Soc Mass Spectrom 24: 1927–1936. doi: 10.1007/s13361-013-0737-3
![]() |
[83] | Takahashi T, Serada S, Ako M, et al. (2013) New findings of kinase switching in gastrointestinal stromal tumor under imatinib using phosphoproteomic analysis. Int J Cancer 133: 2737–2743. |
[84] |
Emara S, Amer S, Ali A, et al. (2017) Single-cell metabolomics. Adv Exp Med Biol 965: 323–343. doi: 10.1007/978-3-319-47656-8_13
![]() |
[85] |
Matsumura Y (2012) Cancer stromal targeting (cast) therapy. Adv Drug Delivery Rev 64: 710–719. doi: 10.1016/j.addr.2011.12.010
![]() |
[86] |
Yasunaga M, Manabe S, Tarin D, et al. (2011) Cancer-stroma targeting therapy by cytotoxic immunoconjugate bound to the collagen 4 network in the tumor tissue. Bioconjugate Chem 22: 1776–1783. doi: 10.1021/bc200158j
![]() |
[87] |
Yasunaga M, Manabe S, Tarin D, et al. (2013) Tailored immunoconjugate therapy depending on a quantity of tumor stroma. Cancer Sci 104: 231–237. doi: 10.1111/cas.12062
![]() |
[88] |
Yasunaga M, Manabe S, Matsumura Y (2017) Immunoregulation by il-7r-targeting antibody-drug conjugates: Overcoming steroid-resistance in cancer and autoimmune disease. Sci Rep 7: 10735. doi: 10.1038/s41598-017-11255-4
![]() |
1. | Sandro Claudio Lera, Didier Sornette, Gross domestic product growth rates as confined Lévy flights: Towards a unifying theory of economic growth rate fluctuations, 2018, 97, 2470-0045, 10.1103/PhysRevE.97.012150 | |
2. | Rebecca Westphal, Didier Sornette, Market impact and performance of arbitrageurs of financial bubbles in an agent-based model, 2020, 171, 01672681, 1, 10.1016/j.jebo.2020.01.004 | |
3. | Christoph Baumeister, Anne Scherer, Florian v. Wangenheim, Branding Access Offers: The Importance of Product Brands, Ownership Status, and Spillover Effects to Parent Brands, 2015, 1556-5068, 10.2139/ssrn.2598122 | |
4. | Peter Cauwels, Didier Sornette, Are ‘flow of ideas’ and ‘research productivity’ in secular decline?, 2022, 174, 00401625, 121267, 10.1016/j.techfore.2021.121267 | |
5. | Patrick M. Crowley, Andrew Hughes Hallett, The Evolution of US and UK Real GDP Components in the Time-Frequency Domain: A Continuous Wavelet Analysis, 2021, 17, 2509-7962, 233, 10.1007/s41549-021-00062-6 | |
6. | C. Colther, J. L. Rojo, R. Hornero, A Wavelet Method for Detecting Turning Points in the Business Cycle, 2022, 18, 2509-7962, 171, 10.1007/s41549-022-00072-y | |
7. | Pedro Vega-Jorquera, Erick de la Barra, Sérgio Luiz E.F. da Silva, Antropogenic seismicity and the breakdown of the self-similarity described by nonextensive models, 2023, 03784371, 128690, 10.1016/j.physa.2023.128690 |
6 months scale | 9 months scale | 15 months scale | 30 months scale | |
H1 | 0.05 | 0.16 | 0.22 | 0.94 |
H2 | 0.31 | 0.62 | 0.47 | 0.09 |
6 months scale | 9 months scale | 15 months scale | 30 months scale | |
H1 | 0.08 | 0.05 | 0.00 | 0.36 |
H2 | 0.19 | 0.13 | 0.38 | 0.12 |