The addition of fillers or additives to improve the mechanical properties of degradable plastics such as sago starch has gained the interest of researchers, scientists, and academicians. This research aims to investigate the addition of calcium silicate as an additive filler on the properties of a sago starch-based degradable plastic. The calcium silicate fillers used were 2, 4, 6, and 8% by weight starch, and the gelatinization process temperature used was 70, 80, and 90 ℃. The properties of these plastics were analyzed in terms of their strength, chemical composition, thermal stability, water absorption, and degradation rate. The optimum mechanical characteristics included a tensile strength of 28.04 MPa, 32.55 MPa of elongation at the break, and 70.02% of Young's modulus obtained with the addition of 8% calcium silicate and a gelatinization temperature of 90 ℃. Fourier Transform Infrared (FTIR) showed that there were O-H, C-H, and C = O groups that existed at wave numbers of 3795.91 cm-1, 2927.94 cm-1, and 1433.11–1616.35 cm-1; moreover, these groups are hydrophilic, which bind water, so they can be degraded by the microbial activity in the soil. Differential Scanning Calorimetry (DSC) showed that the degradable plastic had a thermogram peak at 271.38 ℃; additionally an endothermic peak occurred at 309.30 ℃. The maximum swelling value was 64.05% at 2% calcium silicate and a gelatinization temperature of 70 ℃. The addition of calcium silicate made the plastic more water-resistant. The degradation rate of the degradable plastic ranged from 12–15 days and conformed to the American Standard Testing and Materials (ASTM) D-20.96 (maximum 180 days of decomposition for degradable plastic).
Citation: Rozanna Dewi, Novi Sylvia, Zulnazri Zulnazri, Medyan Riza, Januar Parlaungan Siregar, Tezara Cionita. Use calcium silicate filler to improve the properties of sago starch based degradable plastic[J]. AIMS Environmental Science, 2025, 12(1): 1-15. doi: 10.3934/environsci.2025001
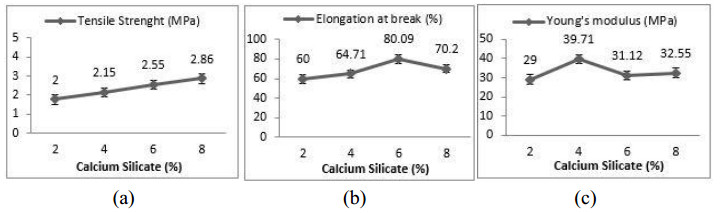
The addition of fillers or additives to improve the mechanical properties of degradable plastics such as sago starch has gained the interest of researchers, scientists, and academicians. This research aims to investigate the addition of calcium silicate as an additive filler on the properties of a sago starch-based degradable plastic. The calcium silicate fillers used were 2, 4, 6, and 8% by weight starch, and the gelatinization process temperature used was 70, 80, and 90 ℃. The properties of these plastics were analyzed in terms of their strength, chemical composition, thermal stability, water absorption, and degradation rate. The optimum mechanical characteristics included a tensile strength of 28.04 MPa, 32.55 MPa of elongation at the break, and 70.02% of Young's modulus obtained with the addition of 8% calcium silicate and a gelatinization temperature of 90 ℃. Fourier Transform Infrared (FTIR) showed that there were O-H, C-H, and C = O groups that existed at wave numbers of 3795.91 cm-1, 2927.94 cm-1, and 1433.11–1616.35 cm-1; moreover, these groups are hydrophilic, which bind water, so they can be degraded by the microbial activity in the soil. Differential Scanning Calorimetry (DSC) showed that the degradable plastic had a thermogram peak at 271.38 ℃; additionally an endothermic peak occurred at 309.30 ℃. The maximum swelling value was 64.05% at 2% calcium silicate and a gelatinization temperature of 70 ℃. The addition of calcium silicate made the plastic more water-resistant. The degradation rate of the degradable plastic ranged from 12–15 days and conformed to the American Standard Testing and Materials (ASTM) D-20.96 (maximum 180 days of decomposition for degradable plastic).

| [1] |
Adhitama R, Setiawan JV, Sukweenadhi J, et al. (2023) Utilization of breadfruit (artocarpus altilis) peel waste and blood clam shell waste (anadara granosa) as raw materials for glycerol-plasticized degradable bioplastic production. IJOBB 7: 12–21. https://doi.org/10.47007/ijobb.v7i1.167 doi: 10.47007/ijobb.v7i1.167

|
| [2] |
Chia WY, Tang DY, Khoo KS, et al. (2020) Nature's fight against plastic pollution: Algae for plastic biodegradation and bioplastics production. Environ Sci Ecotech 4: 100065. https://doi.org/10.1016/j.ese.2020.100065 doi: 10.1016/j.ese.2020.100065
|
| [3] |
Tanjung DA, Jamarun N, Arief S, et al. (2022) Influence of LLDPE-g-MA on mechanical properties, degradation performance and water absorption of thermoplastic sago starch blends. Indones J Chem 22: 171. https://doi.org/10.22146/ijc.68558 doi: 10.22146/ijc.68558
|
| [4] |
Falua KJ, Pokharel A, Ghazvini AB, et al. (2022) Valorization of starch to biobased materials: A review. Polymers 14: 2215. https://doi.org/10.3390/polym14112215 doi: 10.3390/polym14112215
|
| [5] | Alebooyeh R, MohammadiNafchi A, Jokar M (2012) The effects of ZnOnanorodson the characteristics of sago starch biodegradable films. J Chem Health Risks 2: 13–16. |
| [6] | Ehara H, ToyodaY, Johnson DV (2018) Sago palm: Multiple contributions to food security and sustainable livelihoods, Springer Nature. https://doi.org/10.1007/978-981-10-5269-9 |
| [7] |
Ismail H, Zaaba NF (2014) Effect of unmodified and modified sago starch on properties of (sago starch)/silica/PVA plastic films. J Vinyl Addit Techn 20: 185–192. https://doi.org/10.1002/vnl.21344 doi: 10.1002/vnl.21344
|
| [8] | Nuriyah L, Saroja G, Rohmad J (2019) The effect of Calcium Carbonate addition to mechanical properties of bioplastic made from Cassava starch with Glycerol as plasticizer, IOP Conference Series: Materials Science and Engineering, IOP Publishing, 546: 042030. https://doi.org/10.1088/1757-899X/546/4/042030 |
| [9] |
Azevedo LCD, Rovani S, Santos JJ, et al. (2020) Biodegradable films derived from corn and potato starch and study of the effect of silicate extracted from sugarcane waste ash. ACS Appl Polym Mater 2: 2160–2169. https://doi.org/10.1021/acsapm.0c00124 doi: 10.1021/acsapm.0c00124
|
| [10] |
Post W, Kuijpers LJ, Zijlstra M, et al. (2021) Effect of mineral fillers on the mechanical properties of commercially available biodegradable polymers. Polymers 13: 394. https://doi.org/10.3390/polym13030394 doi: 10.3390/polym13030394
|
| [11] | Saleh ERM, Rakhman KA, Samad S (2022) Synthesis of biofoam from sago waste as a biodegradable food storage candidate. KnE Life Sci 162–169. |
| [12] |
Patil PD (2022) Production of Agar-Agar and sago based bioplastic. IJRASET 10: 1998–2005. https://doi.org/10.22214/ijraset.2022.42710 doi: 10.22214/ijraset.2022.42710
|
| [13] |
Kamali M, Ghahremaninezhad A (2018) A study of calcium-silicate-hydrate/polymer nanocomposites fabricated using the layer-by-layer method. Materials 11: 527. https://doi.org/10.3390/ma11040527 doi: 10.3390/ma11040527
|
| [14] |
Youness RA, El-Deen DMT, Taha MA (2023) A review on calcium silicate ceramics: Properties, limitations, and solutions for their use in biomedical applications. Silicon 15: 2493–2505. https://doi.org/10.1007/s12633-022-02207-3 doi: 10.1007/s12633-022-02207-3
|
| [15] |
Sasimowski E, Majewski Ł (2019) Effect of the intensive plasticizing zone design on the effectiveness of corotating twin-screw extrusion. Adv Polym Techn 2019: 1–11. https://doi.org/10.1155/2019/8518341 doi: 10.1155/2019/8518341
|
| [16] |
Sasimowski E, Majewski Ł, Grochowicz M (2019) Influence of the conditions of corotating twin-screw extrusion for Talc-filled polypropylene on selected properties of the extrudate. Polymers 11: 1460. https://doi.org/10.3390/polym11091460 doi: 10.3390/polym11091460
|
| [17] |
Melo PMA, Macêdo OB, Barbosa GP, et al. (2019) High-density polyethylene/mollusk shell-waste composites: Effects of particle size and coupling agent on morphology, mechanical and thermal properties. J Mater Res Technol 8: 1915–1925. https://doi.org/10.1016/j.jmrt.2019.01.008 doi: 10.1016/j.jmrt.2019.01.008
|
| [18] |
Martín LA, Silva DKG, Perilla JE, et al. (2023) Preliminary modeling study of a tape casting system for thermoplastic starch film forming. Biol Life Sci Forum 28: 4. https://doi.org/10.3390/blsf2023028004 doi: 10.3390/blsf2023028004
|
| [19] |
Du C, Jiang F, Jiang W, et al. (2020) Physicochemical and structural properties of sago starch. Int J Biol Macromol 164: 1785–1793. https://doi.org/10.1016/j.ijbiomac.2020.07.310 doi: 10.1016/j.ijbiomac.2020.07.310
|
| [20] |
Shanmathy M, Mohanta M, Thirugnanam A (2021) Development of biodegradable bioplastic films from Taro starch reinforced with bentonite. Carbohydr Polym Tech 2: 100173. https://doi.org/10.1016/j.carpta.2021.100173 doi: 10.1016/j.carpta.2021.100173
|
| [21] |
Zain AHM, Wahab MKA, Ismail H (2019) Effect of calcium carbonate incorporation on the properties of low linear density polyethylene/thermoplastic starch blends. J Eng Sci 15: 97–108. https://doi.org/10.21315/jes2019.15.2.7 doi: 10.21315/jes2019.15.2.7
|
| [22] |
Syafri E, Kasim A, Abral H, et al. (2017) Effect of precipitated calcium carbonate on physical, mechanical and thermal properties of cassava starch bioplastic composites. Int J Adv Sci Eng Inform Tech 7: 1950. https://doi.org/10.18517/ijaseit.7.5.1292 doi: 10.18517/ijaseit.7.5.1292
|
| [23] |
Boey JY, Lee CK, Tay GS (2022) Factors affecting mechanical properties of reinforced bioplastics: A review. Polymers 14: 3737. https://doi.org/10.3390/polym14183737 doi: 10.3390/polym14183737
|
| [24] | Maryam, Kasim A, Novelina, et al. (2022) Improvement on the bioplastic properties of Polyvinyl Alcohol (PVA) with the sago starch nanoparticle addition. Sylwan 1: 130. |
| [25] |
Tian J, Kong Y, Qian S, et al. (2024) Mechanically robust multifunctional starch films reinforced by surface-tailored nanofibrillated cellulose. Compos Part B-Eng 275: 111339. https://doi.org/10.1016/j.compositesb.2024.111339 doi: 10.1016/j.compositesb.2024.111339
|
| [26] |
Kong Y, Qian S, Zhang Z, et al. (2023) The impact of esterified nanofibrillated cellulose content on the properties of thermoplastic starch/PBAT biocomposite films through ball-milling. Int J Biol Macromol 253: 127462. https://doi.org/10.1016/j.ijbiomac.2023.127462 doi: 10.1016/j.ijbiomac.2023.127462
|
| [27] |
Sasimowski E, Majewski Ł, Grochowicz M (2020) Analysis of selected properties of biocomposites based on polyethylene with a natural origin filler. Materials 13: 4182. https://doi.org/10.3390/ma13184182 doi: 10.3390/ma13184182
|
| [28] | Dewi R, Sylvia N, Riza M, et al. (2024) Characterization of sago starch-based degradable plastic with agricultural waste cellulose fiber as filler. AIMS Environ 11: 304–323. https://doi.org/10.3934/environsci.2024014 |
| [29] |
Kubík Ľ, Zeman S (2014) Mechanical properties of polyethylene foils. J Cent Eur Agric 15: 138–145. https://doi.org/10.5513/JCEA01/15.1.1425 doi: 10.5513/JCEA01/15.1.1425
|
| [30] |
Tan SX, Andriyana A, Ong HC, et al. (2022) A comprehensive review on the emerging roles of nanofillers and plasticizers towards sustainable starch-based bioplastic fabrication. Polymers 14: 664. https://doi.org/10.3390/polym14040664 doi: 10.3390/polym14040664
|
| [31] |
Srihanam P, Thongsomboon W, Baimark Y (2023) Phase morphology, mechanical, and thermal properties of calcium carbonate-reinforced poly(L-lactide)-b-poly(ethylene glycol)-b-poly(L-lactide) bioplastics. Polymers 15: 301. https://doi.org/10.3390/polym15020301 doi: 10.3390/polym15020301
|
| [32] | Dewi R, Ibrahim N, Sylvia N (2017) Thermal behavior of modified thermoplastic starch (TPS) synthesized from sago (metroxylon sagu) with diphenylmethane diisocyanate and castor oil, In Proceedings of MICoMS 2017, Emerald Publishing Limited, 387–393. https://doi.org/10.1108/978-1-78756-793-1-00033 |
| [33] |
Lang H, Chen X, Tian J, et al. (2022) Effect of microcrystalline cellulose on the properties of PBAT/thermoplastic starch biodegradable film with chain extender. Polymers 14: 4517. https://doi.org/10.3390/polym14214517 doi: 10.3390/polym14214517
|
| [34] |
Gunawardene OHP, Gunathilake C, Amaraweera SM, et al. (2021) Compatibilization of starch/synthetic biodegradable polymer blends for packaging applications: A review. J Compos Sci 5: 300. https://doi.org/10.3390/jcs5110300 doi: 10.3390/jcs5110300
|
| [35] | Dewi R, Agusnar H, Wirjosentono B, et al. (2014) Synthesis of modified thermoplastic starch (TPS) using in-situ technique, Adv Environ Biol 8: 26–33. |
| [36] |
Nasir NN, Othman SA (2021) The physical and mechanical properties of Corn-based bioplastic films with different starch and glycerol content. J Phys Sci 32: 89–101. https://doi.org/10.21315/jps2021.32.3.7 doi: 10.21315/jps2021.32.3.7
|
| [37] | Abidin NDZ, Azhar NS, Sarip MN, et al. (2021) Production of bioplastic from cassava peel with different concentrations of glycerol and CaCO3 as filler, In AIP Conference Proceedings, AIP Publishing, 2332. https://doi.org/10.1063/5.0043482 |
| [38] | Pilla S (2011) Handbook of bioplastics & biocomposites engineering applications, John Wiley & Sons. https://doi.org/10.1002/9781118203699 |
| [39] |
Coppola G, Gaudio MT, Lopresto CG, et al. (2021) Bioplastic from renewable biomass: A facile solution for a greener environment. Earth Syst Environ 5: 231–251. https://doi.org/10.1007/s41748-021-00208-7 doi: 10.1007/s41748-021-00208-7
|
| [40] |
Elgharbawy AS, El Demerdash AGM, Sadik WA, et al. (2024) Synthetic degradable Polyvinyl Alcohol polymer and its blends with starch and cellulose—A comprehensive overview. Polymers 16: 1356. https://doi.org/10.3390/polym16101356 doi: 10.3390/polym16101356
|


Figures(4) / Tables(1)

Rozanna Dewi, Novi Sylvia, Zulnazri Zulnazri, Medyan Riza, Januar Parlaungan Siregar, Tezara Cionita. Use calcium silicate filler to improve the properties of sago starch based degradable plastic[J]. AIMS Environmental Science, 2025, 12(1): 1-15. doi: 10.3934/environsci.2025001


 DownLoad: