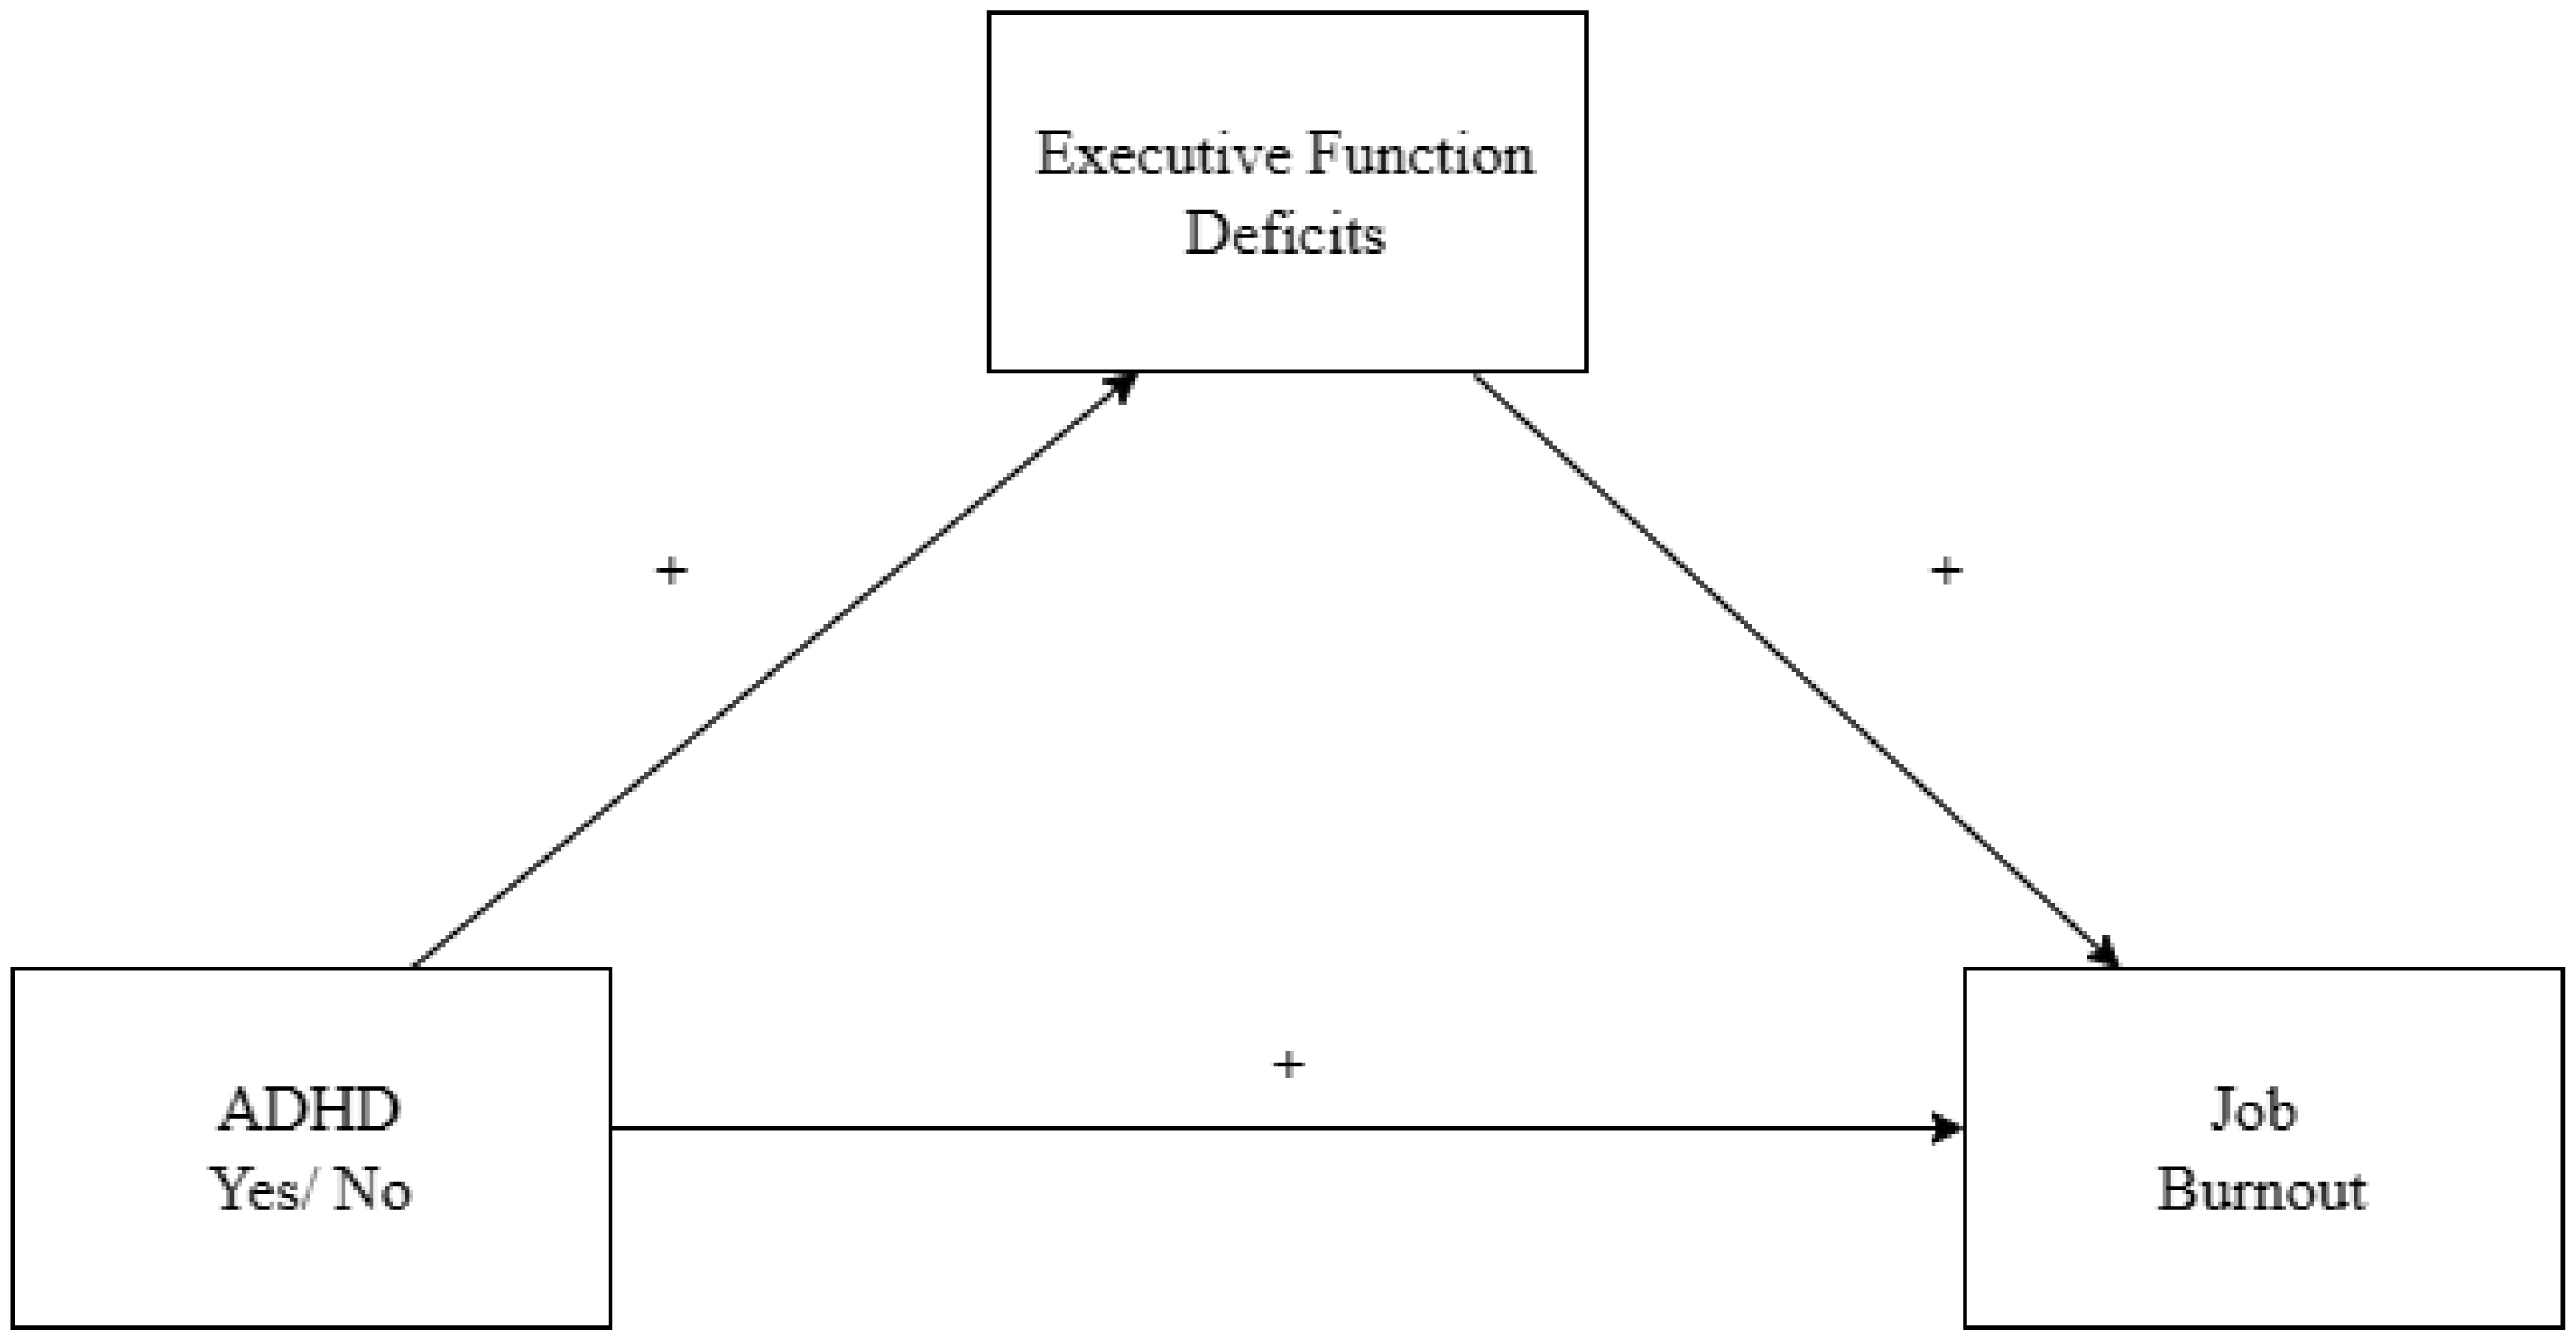
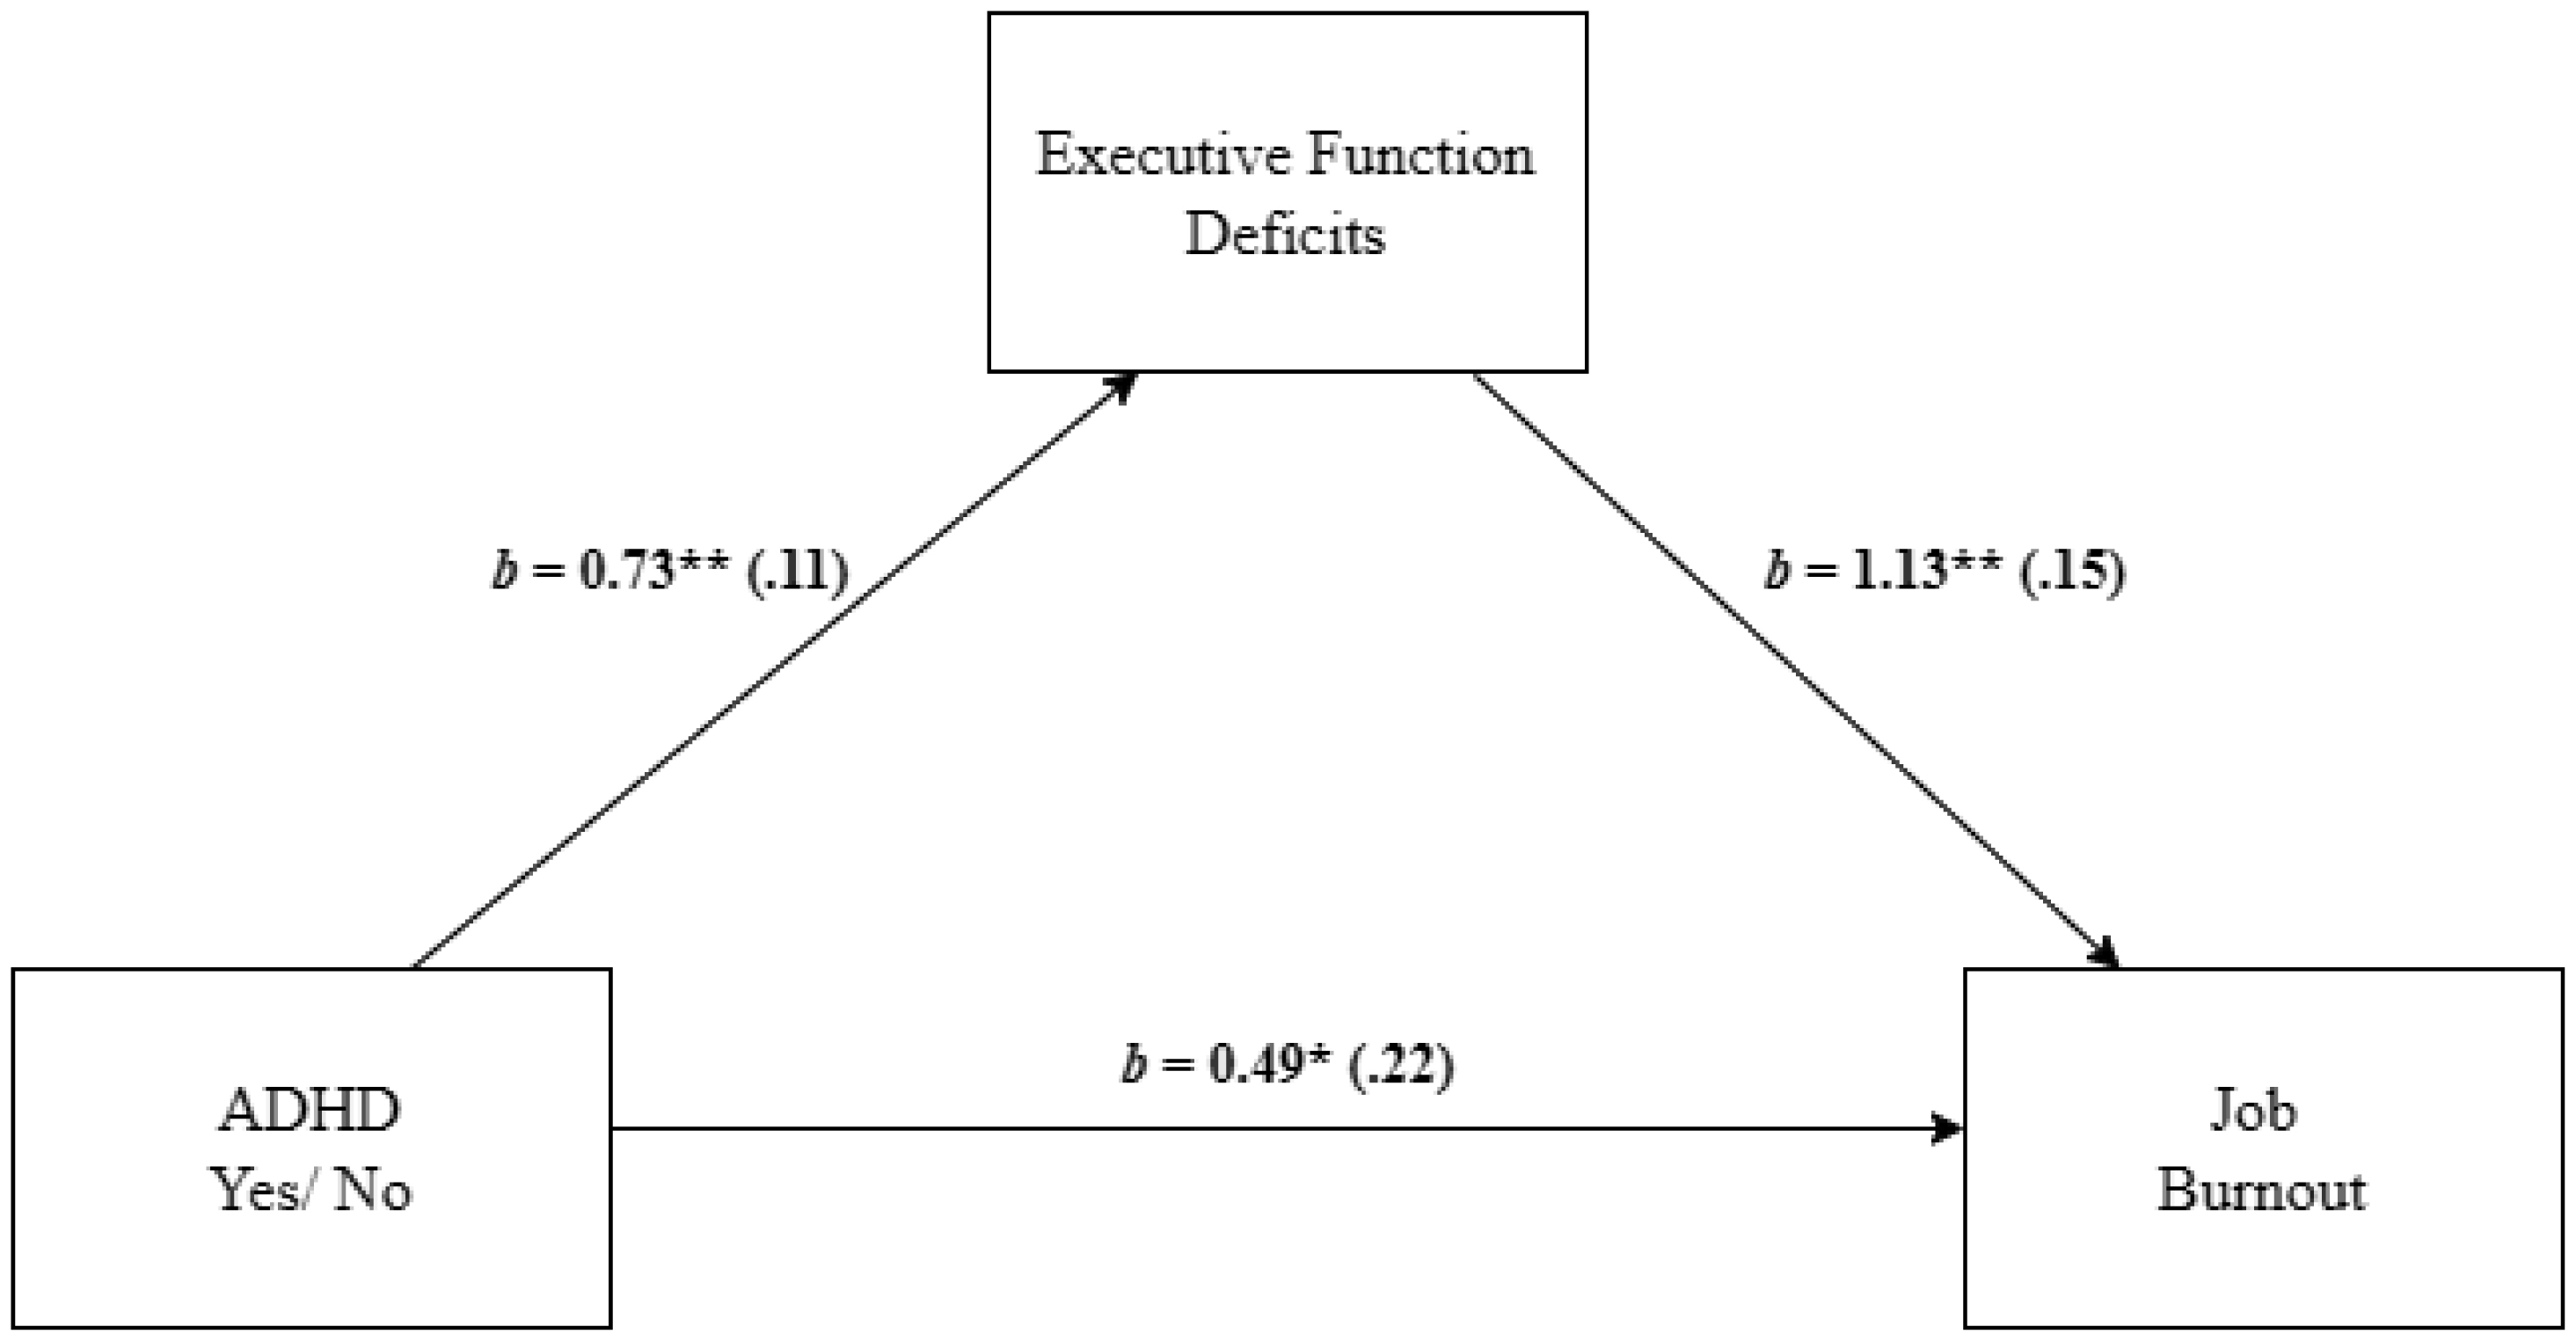
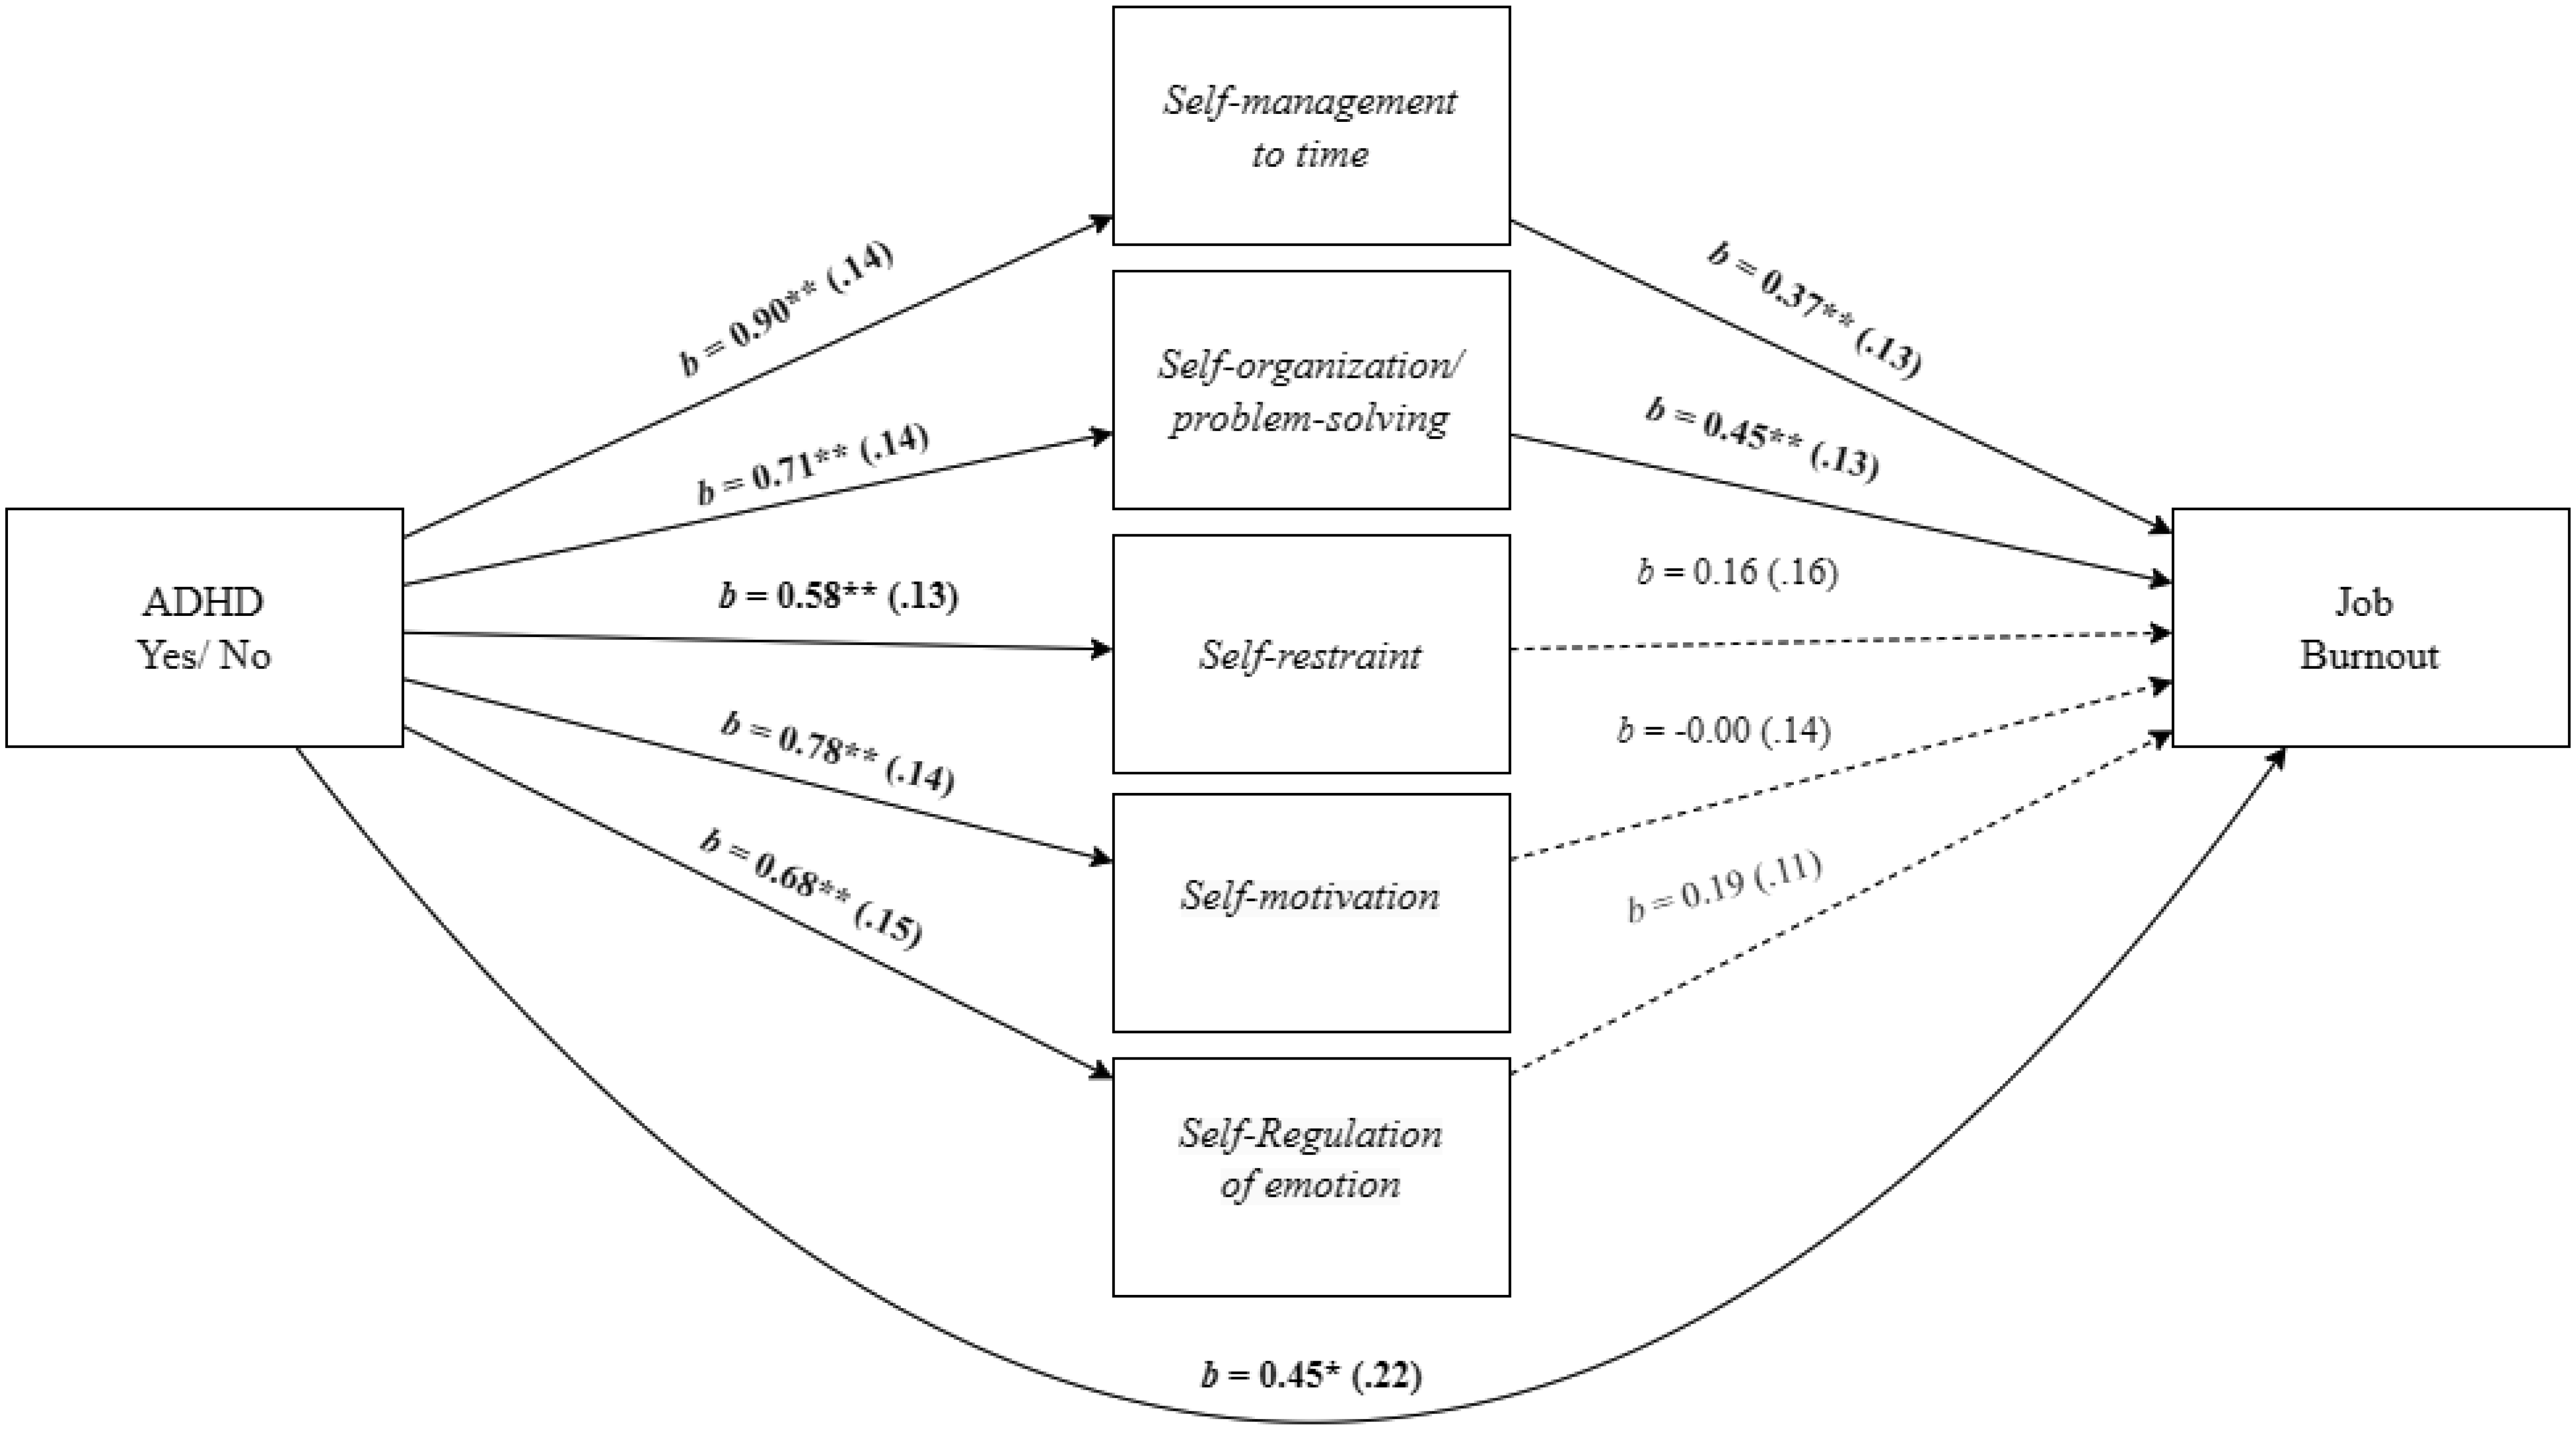
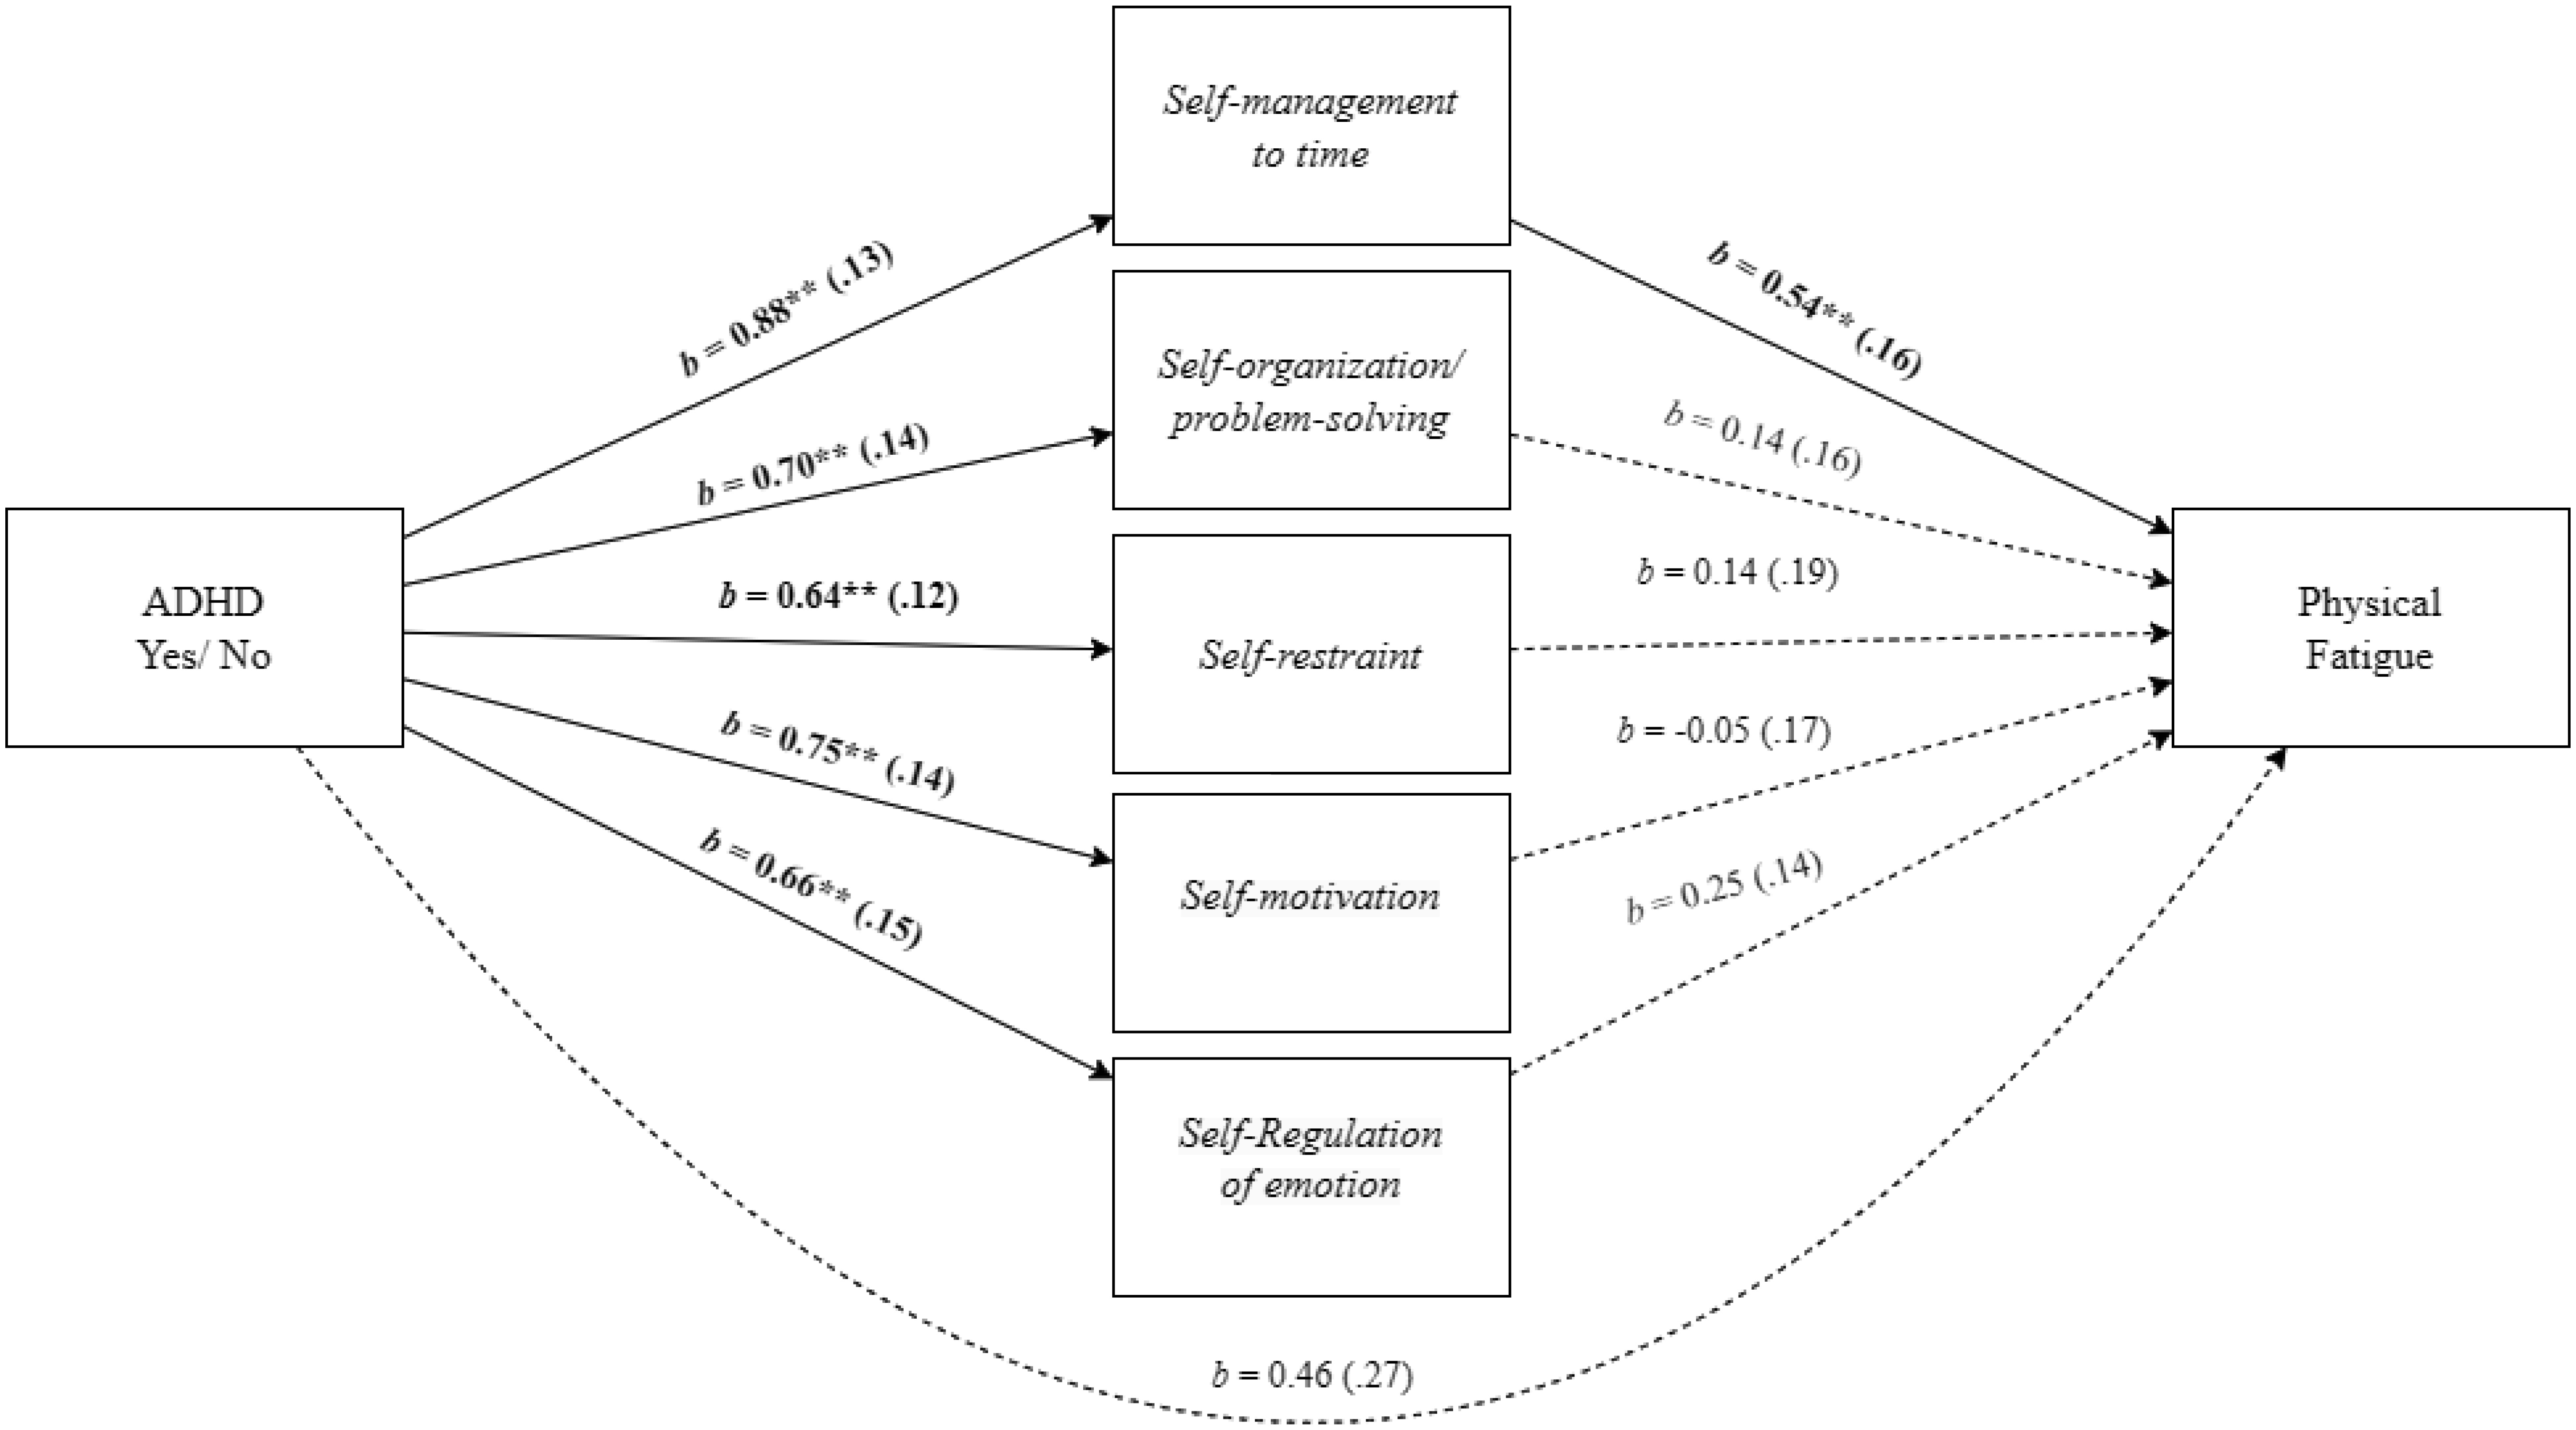
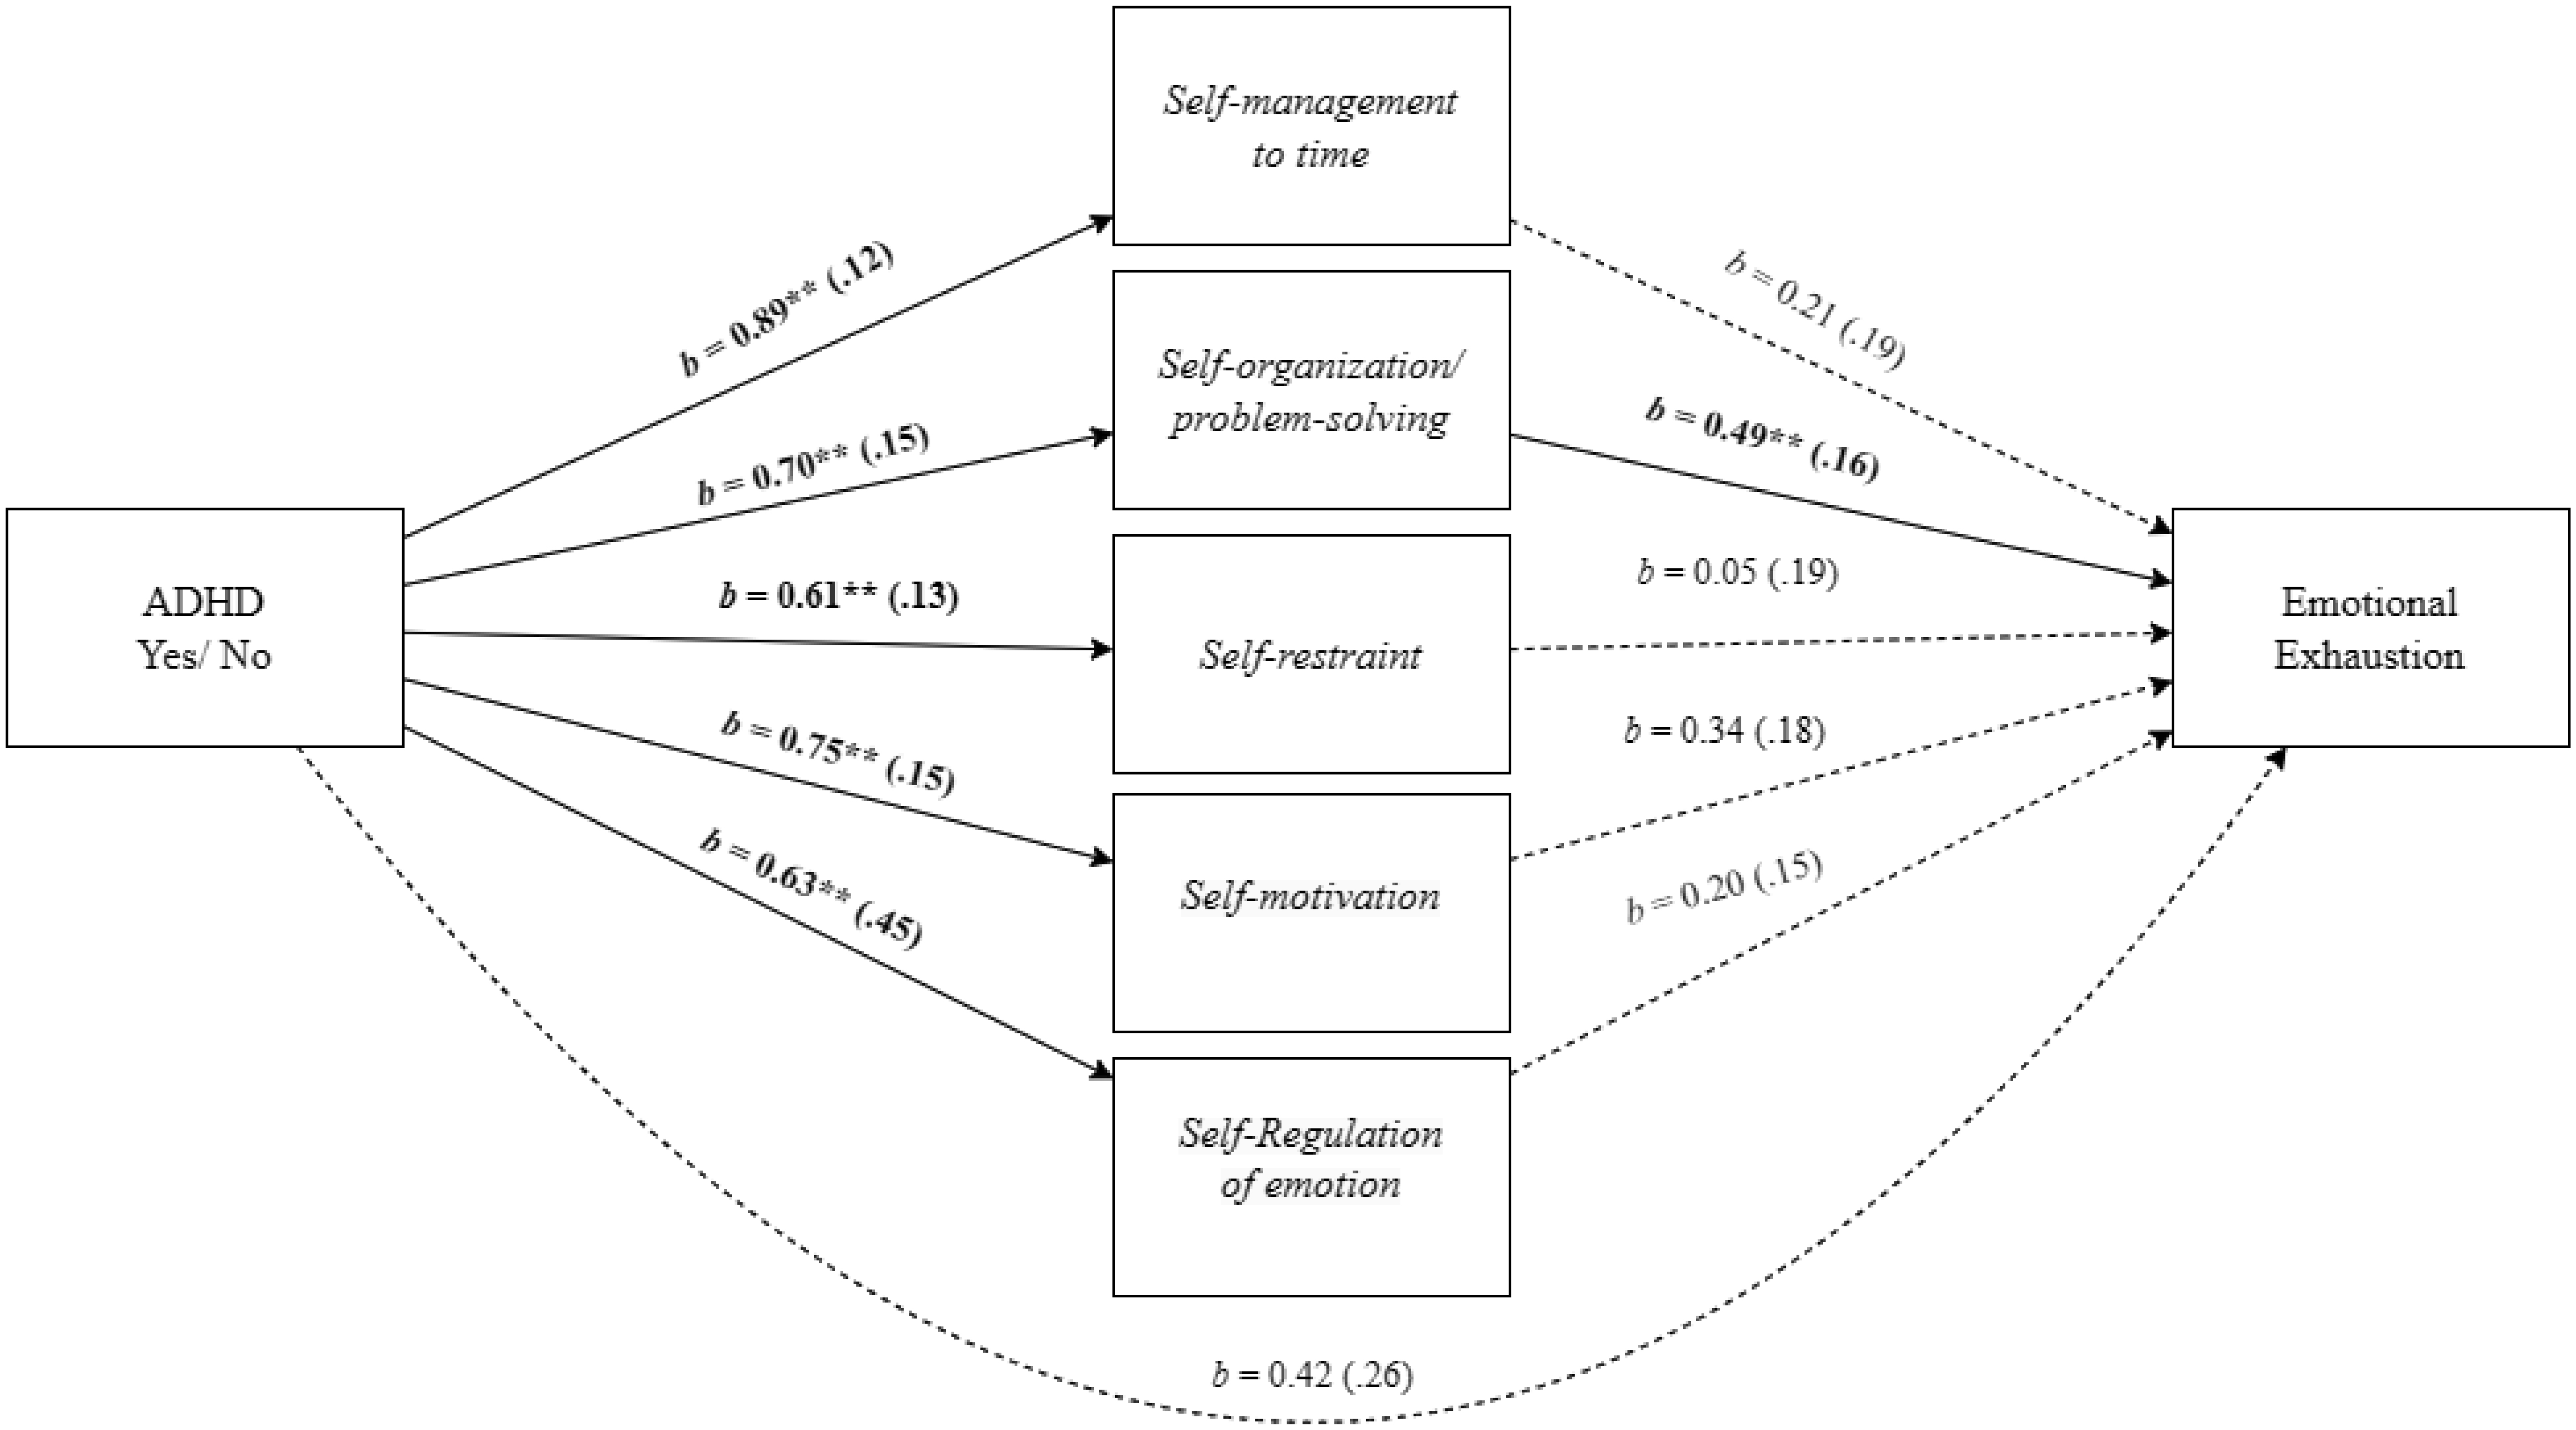
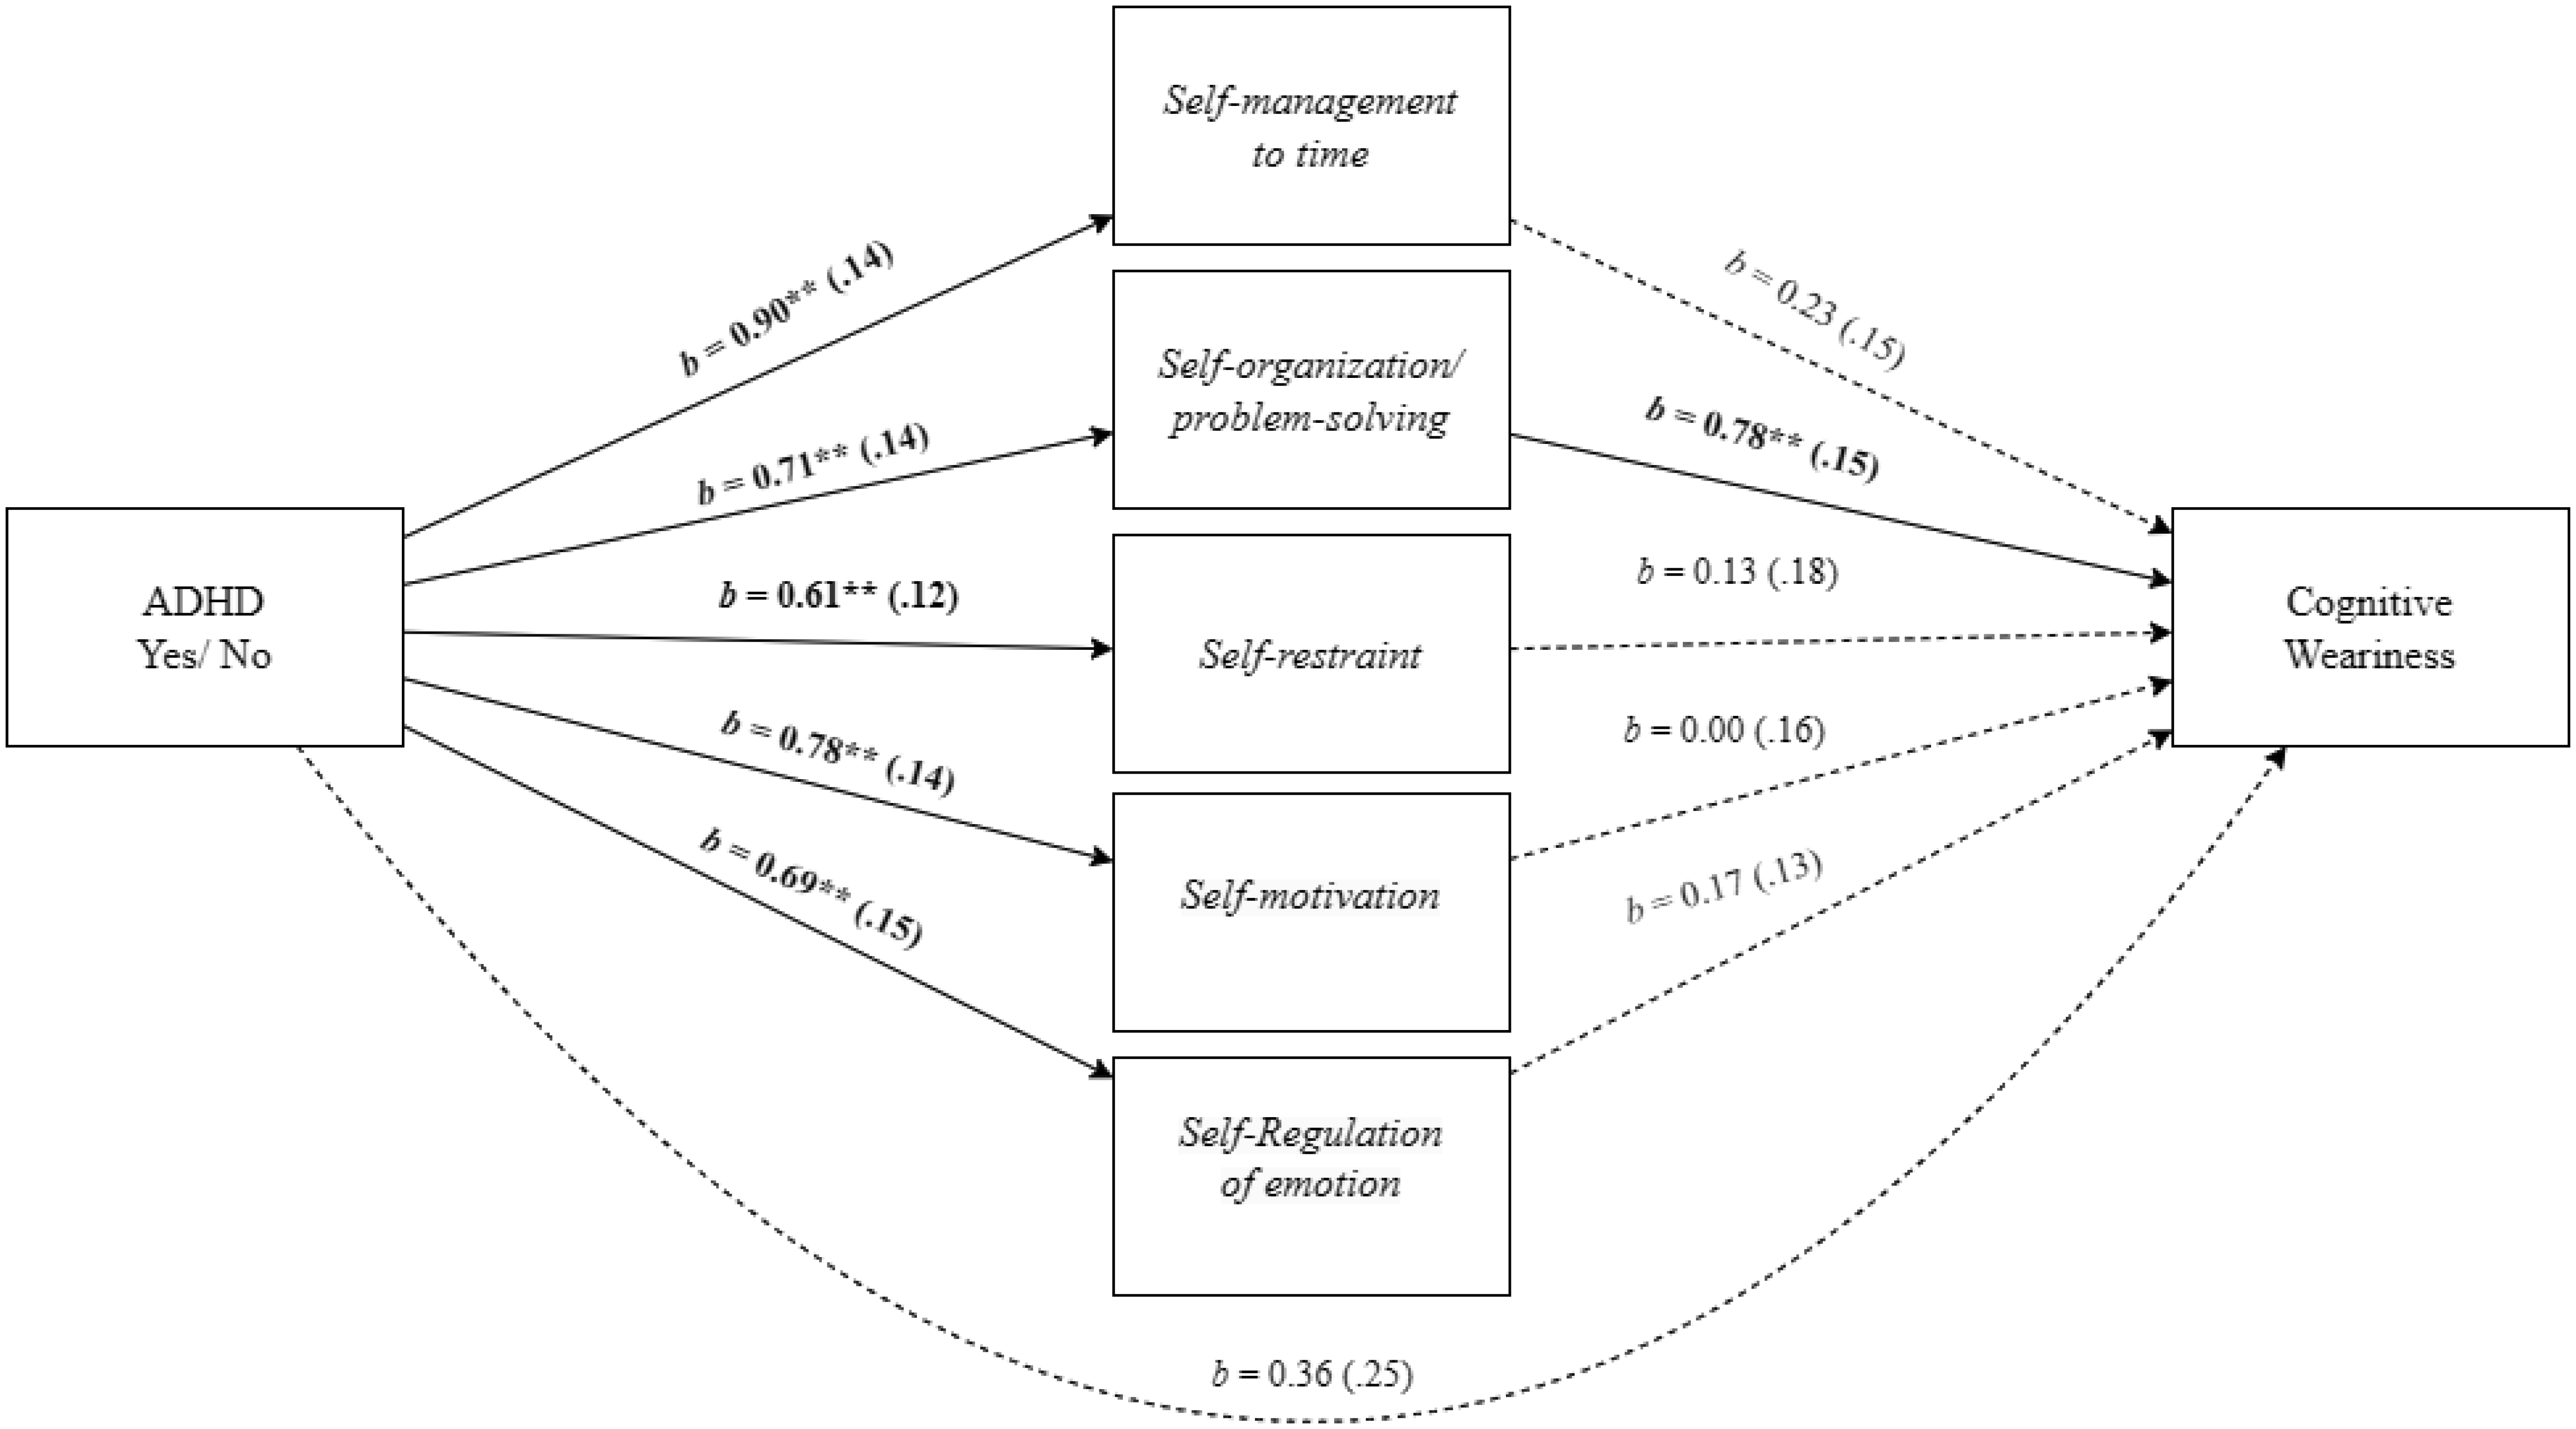
Adults with Attention-Deficit/Hyperactivity Disorder (ADHD) often face significant deficits in executive function and adverse work-related outcomes. This study aimed to explore the role of executive function deficits in job burnout of employees with ADHD. We hypothesized that employees with ADHD, relative to employees without ADHD, will experience higher levels of job burnout and deficits in executive function. We also hypothesized that the ADHD-job burnout relationship would be mediated through executive function deficits, specifically by self-management to time and self-organization/problem-solving. A field study with 171 employees provided support for the research hypotheses and mediation model in which the employees' ADHD-job burnout relationship was mediated through executive function deficits. Additional mediation analyses indicated that the specific executive function of self-management to time and self-organization/problem-solving mediated the effect of ADHD on job burnout and its facets. Specifically, for physical fatigue, the mediation was realized through self-management to time, and for emotional exhaustion and cognitive weariness, the mediation was significant through self-organization/problem-solving. The present findings shed light on the relevance of referring ADHD among employees, their vulnerability to job burnout, and the role of executive function deficits in job burnout of employees with ADHD.
Citation: Yaara Turjeman-Levi, Guy Itzchakov, Batya Engel-Yeger. Executive function deficits mediate the relationship between employees' ADHD and job burnout[J]. AIMS Public Health, 2024, 11(1): 294-314. doi: 10.3934/publichealth.2024015
Adults with Attention-Deficit/Hyperactivity Disorder (ADHD) often face significant deficits in executive function and adverse work-related outcomes. This study aimed to explore the role of executive function deficits in job burnout of employees with ADHD. We hypothesized that employees with ADHD, relative to employees without ADHD, will experience higher levels of job burnout and deficits in executive function. We also hypothesized that the ADHD-job burnout relationship would be mediated through executive function deficits, specifically by self-management to time and self-organization/problem-solving. A field study with 171 employees provided support for the research hypotheses and mediation model in which the employees' ADHD-job burnout relationship was mediated through executive function deficits. Additional mediation analyses indicated that the specific executive function of self-management to time and self-organization/problem-solving mediated the effect of ADHD on job burnout and its facets. Specifically, for physical fatigue, the mediation was realized through self-management to time, and for emotional exhaustion and cognitive weariness, the mediation was significant through self-organization/problem-solving. The present findings shed light on the relevance of referring ADHD among employees, their vulnerability to job burnout, and the role of executive function deficits in job burnout of employees with ADHD.

| [1] | American Psychiatric Association (2013) Diagnostic and statistical manual of mental disorders: DSM-5. American Psychiatric Publishing 31-86. |
| [2] | Barkley RA (2002) Major life activity and health outcomes associated with attention-deficit/hyperactivity disorder. J Clin Psychiatry 63: 10-15. |
| [3] |
Caye A, Swanson J, Thapar A, et al. (2016) Life span studies of ADHD—conceptual challenges and predictors of persistence and outcome. Curr Psychiatry Rep 18: 1-11. https://doi.org/10.1007/s11920-016-0750-x 
|
| [4] |
Kooij JS, Buitelaar JK, FURER JW, et al. (2005) Internal and external validity of attention-deficit hyperactivity disorder in a population-based sample of adults. Psychol Med 35: 817-827. https://doi.org/10.1017/S003329170400337X
|
| [5] |
Weiss G, Hechtman L, Milroy T, et al. (1985) Psychiatric status of hyperactives as adults: A controlled prospective 15-year follow-up of 63 hyperactive children. J Am Acad Child Psychiatry 24: 211-220. https://doi.org/10.1016/S0002-7138(09)60450-7
|
| [6] |
Mannuzza S, Klein RG, Bessler A, et al. (1993) Adult outcome of hyperactive boys: Educational achievement, occupational rank, and psychiatric status. Arch Gen Psychiatry 50: 565-576. https://doi.org/10.1001/archpsyc.1993.01820190067007
|
| [7] |
Fuermaier AB, Tucha L, Butzbach M, et al. (2021) ADHD at the workplace: ADHD symptoms, diagnostic status, and work-related functioning. J Neural Transm 128: 1021-1031. https://doi.org/10.1007/s00702-021-02309-z
|
| [8] |
Secnik K, Swensen A, Lage MJ (2005) Comorbidities and costs of adult patients diagnosed with attention-deficit hyperactivity disorder. Pharmacoeconomics 23: 93-102. https://doi.org/10.2165/00019053-200523010-00008
|
| [9] |
Mannuzza S, Klein RG (2000) Long-term prognosis in attention-deficit/hyperactivity disorder. Child Adolesc Psychiatr Clin N Am 9: 711-726. https://doi.org/10.1016/S1056-4993(18)30114-7
|
| [10] |
Murphy K, Barkley RA (1996) Attention deficit hyperactivity disorder adults: comorbidities and adaptive impairments. Compr Psychiatry 37: 393-401. https://doi.org/10.1016/S0010-440X(96)90022-X
|
| [11] |
Biederman J, Petty C, Fried R, et al. (2006) Impact of psychometrically defined deficits of executive functioning in adults with attention deficit hyperactivity disorder. Am J Psychiatry 163: 1730-1738. https://doi.org/10.1176/ajp.2006.163.10.1730
|
| [12] |
Frazier TW, Youngstrom EA, Glutting JJ, et al. (2007) ADHD and achievement: Meta-analysis of the child, adolescent, and adult literatures and a concomitant study with college students. J Learn Disabil 40: 49-65. https://doi.org/10.1177/00222194070400010401
|
| [13] |
Kessler RC, Adler L, Ames M, et al. (2005) The World Health Organization Adult ADHD Self-Report Scale (ASRS): a short screening scale for use in the general population. Psychol Med 35: 245-256. https://doi.org/10.1017/S0033291704002892
|
| [14] |
Oscarsson M, Nelson M, Rozental A, et al. (2022) Stress and work-related mental illness among working adults with ADHD: A qualitative study. BMC Psychiatry 22: 751. https://doi.org/10.1186/s12888-022-04409-w
|
| [15] |
Willcutt EG, Doyle AE, Nigg JT, et al. (2005) Validity of the executive function theory of attention-deficit/hyperactivity disorder: A meta-analytic review. Biol Psychiatry 57: 1336-1346. https://doi.org/10.1016/j.biopsych.2005.02.006
|
| [16] |
Pihlaja M, Tuominen P, Peräkylä J, et al. (2022) Occupational burnout is linked with inefficient executive functioning, elevated average heart rate, and decreased physical activity in daily life-initial evidence from teaching professionals. Brain Sci 12: 1723. https://doi.org/10.3390/brainsci12121723
|
| [17] |
Shirom A (2003) Job-related burnout. Handbook of Occupational Health Psychology . Washington, DC: American Psychological Association 245-264.
|
| [18] | Shirom A (1989) Burnout in work organizations. International review of industrial and organizational psychology . USA: John Wiley & Sons 25-48. |
| [19] | Schaufeli WB, Buunk BP (2003) Burnout: An overview of 25 years of research and theorizing. The Handbook of Work and Health Psychology : 282-424. https://doi.org/10.1002/0470013400.ch19 |
| [20] | Pines A, Aronson E (1988) Career burnout: Causes and cures. New York: Free press. |
| [21] |
Shanafelt TD, Balch CM, Bechamps GJ, et al. (2009) Burnout and career satisfaction among American surgeons. Ann Surg 250: 463-471. https://doi.org/10.1097/SLA.0b013e3181ac4dfd
|
| [22] |
Soler JK, Yaman H, Esteva M, et al. (2008) Burnout in European family doctors: The EGPRN study. Fam Pract 25: 245-265. https://doi.org/10.1093/fampra/cmn038
|
| [23] |
Borritz M, Rugulies R, Christensen KB, et al. (2006) Burnout as a predictor of self-reported sickness absence among human service workers: Prospective findings from three year follow up of the PUMA study. Occup Environ Med 63: 98-106. https://doi.org/10.1136/oem.2004.019364
|
| [24] |
Duijts SF, Kant I, Swaen GM, et al. (2007) A meta-analysis of observational studies identifies predictors of sickness absence. J Clin Epidemiol 60: 1105-1115. https://doi.org/10.1016/j.jclinepi.2007.04.008
|
| [25] |
Maslach C, Schaufeli WB, Leiter MP (2001) Job burnout. Annu Rev Psychol 52: 397-422. https://doi.org/10.1146/annurev.psych.52.1.397
|
| [26] |
Shanafelt TD, Bradley KA, Wipf JE, et al. (2002) Burnout and self-reported patient care in an internal medicine residency program. Ann Intern Med 136: 358-367. https://doi.org/10.7326/0003-4819-136-5-200203050-00008
|
| [27] |
West CP, Huschka MM, Novotny PJ, et al. (2006) Association of perceived medical errors with resident distress and empathy: a prospective longitudinal study. JAMA 296: 1071-1078. https://doi.org/10.1001/jama.296.9.1071
|
| [28] |
Shanafelt TD, Balch CM, Bechamps G, et al. (2010) Burnout and medical errors among American surgeons. Ann Surg 251: 995-1000. https://doi.org/10.1097/SLA.0b013e3181bfdab3
|
| [29] |
Leiter MP, Maslach C (2009) Nurse turnover: the mediating role of burnout. J Nurs Manag 17: 331-339. https://doi.org/10.1111/j.1365-2834.2009.01004.x
|
| [30] | Deligkaris P, Panagopoulou E, Montgomery AJ, et al. (2014) Job burnout and cognitive functioning: A systematic review. Work & Stress 28: 107-123. |
| [31] |
Sarkis E (2014) Addressing attention-deficit/hyperactivity disorder in the workplace. Postgrad Med 126: 25-30. https://doi.org/10.3810/pgm.2014.09.2797
|
| [32] |
Adamou M, Arif M, Asherson P, et al. (2013) Occupational issues of adults with ADHD. BMC Psychiatry 13: 1-7. https://doi.org/10.1186/1471-244X-13-59
|
| [33] |
Lee RT, Seo B, Hladkyj S, et al. (2013) Correlates of physician burnout across regions and specialties: A meta-analysis. Hum Resour Health 11: 1-16. https://doi.org/10.1186/1478-4491-11-48
|
| [34] |
Brattberg G (2006) PTSD and ADHD: Underlying factors in many cases of burnout. Stress Health 22: 305-313. https://doi.org/10.1002/smi.1112
|
| [35] |
Chan T, Wang I, Ybarra O (2021) Leading and managing the workplace: The role of executive functions. Acad Manage Perspect 35: 142-164. https://doi.org/10.5465/amp.2017.0215
|
| [36] | Barkley RA (2011) Barkley deficits in executive functioning scale (BDEFS). New York: Guilford Press 3-14. |
| [37] | Kizony R, Demayo-Dayan T, Sinoff G, et al. (2011) Validation of the executive function route-finding task (EFRT) in people with mild cognitive impairment. OTJR (Thorofare N J) 31: S47-S52. https://doi.org/10.3928/15394492-20101108-08 |
| [38] |
Thorell L, Holst Y, Chistiansen H, et al. (2017) Neuropsychological deficits in adults age 60 and above with attention deficit hyperactivity disorder. Eur Psychiatry 45: 90-96. https://doi.org/10.1016/j.eurpsy.2017.06.005
|
| [39] |
Bodalski EA, Knouse LE, Kovalev D (2019) Adult ADHD, emotion dysregulation, and functional outcomes: Examining the role of emotion regulation strategies. J Psychopathol Behav 41: 81-92. https://doi.org/10.1007/s10862-018-9695-1
|
| [40] |
Harpin VA (2005) The effect of ADHD on the life of an individual, their family, and community from preschool to adult life. Arch Dis Childhood 90: i2-i7. https://doi.org/10.1136/adc.2004.059006
|
| [41] |
Murphy KR, Barkley RA (2007) Occupational functioning in adults with ADHD. ADHD Report 15: 6-10. https://doi.org/10.1521/adhd.2007.15.1.6
|
| [42] |
Nadeau KG (2005) Career choices and workplace challenges for individuals with ADHD. J Clin Psychol 61: 549-563. https://doi.org/10.1002/jclp.20119
|
| [43] | Tominey EW, Tominey M, Bruyere SM Working effectively with people with attention deficit/hyperactivity disorder (2001). Available from: https://ecommons.cornell.edu/items/2fec620c-98d7-41b7-9eb5-a852e555bed0 |
| [44] |
Primich C, Iennaco J (2012) Diagnosing adult attention-deficit hyperactivity disorder: The importance of establishing daily life contexts for symptoms and impairments. J Psychiatr Ment Health Nurs 19: 362-373. https://doi.org/10.1111/j.1365-2850.2011.01845.x
|
| [45] |
Toner M, O'Donoghue T, Houghton S (2006) Living in chaos and striving for control: How adults with attention deficit hyperactivity disorder deal with their disorder. Int J Disabil De Edu 53: 247-261. https://doi.org/10.1080/10349120600716190
|
| [46] |
Boonstra AM, Oosterlaan J, Sergeant JA, et al. (2005) Executive functioning in adult ADHD: A meta-analytic review. Psychol Med 35: 1097-1108. https://doi.org/10.1017/S003329170500499X
|
| [47] |
Kamradt JM, Ullsperger JM, Nikolas MA (2014) Executive function assessment and adult attention-deficit/hyperactivity disorder: Tasks versus ratings on the Barkley deficits in executive functioning scale. Psychol Assess 26: 1095-1105. https://doi.org/10.1037/pas0000006
|
| [48] |
Hervey AS, Epstein JN, Curry JF (2004) Neuropsychology of adults with attention-deficit/hyperactivity disorder: A meta-analytic review. Neuropsychology 18: 485-503. https://doi.org/10.1037/0894-4105.18.3.485
|
| [49] |
Frazier TW, Demaree HA, Youngstrom EA (2004) Meta-analysis of intellectual and neuropsychological test performance in attention-deficit/hyperactivity disorder. Neuropsychology 18: 543-555. https://doi.org/10.1037/0894-4105.18.3.543
|
| [50] |
Faul F, Erdfelder E, Lang A-G, et al. (2007) G* Power 3: A flexible statistical power analysis program for the social, behavioral, and biomedical sciences. Behav Res Methods 39: 175-191. https://doi.org/10.3758/BF03193146
|
| [51] |
Faraone SV, Spencer TJ, Montano CB, et al. (2004) Attention-deficit/hyperactivity disorder in adults: A survey of current practice in psychiatry and primary care. Arch Intern Med 164: 1221-1226. https://doi.org/10.1001/archinte.164.11.1221
|
| [52] |
Wender PH, Wolf LE, Wasserstein J (2001) Adults with ADHD: An overview. Ann N Y Acad Sci 931: 1-16. https://doi.org/10.1111/j.1749-6632.2001.tb05770.x
|
| [53] |
Ustun B, Adler LA, Rudin C, et al. (2017) The World Health Organization adult attention-deficit/hyperactivity disorder self-report screening scale for DSM-5. Jama Psychiatry 74: 520-527. https://doi.org/10.1001/jamapsychiatry.2017.0298
|
| [54] | Barkley RS (2011) Barkley deficits in executive functioning scale (BDEFS). New York: Guilford Press 154-155. |
| [55] | Lace JW, McGrath A, Merz ZC (2020) A factor analytic investigation of the Barkley deficits in executive functioning scale, short form. Curr Psychol 41: 1-9. https://doi.org/10.1007/s12144-020-00756-7 |
| [56] |
Flannery AJ, Luebbe AM, Becker SP (2017) Sluggish cognitive tempo is associated with poorer study skills, more executive functioning deficits, and greater impairment in college students. J Clin Psychol 73: 1091-1113. https://doi.org/10.1002/jclp.22406
|
| [57] |
Shirom A, Melamed S (2006) A comparison of the construct validity of two burnout measures in two groups of professionals. Int J Stress Manage 13: 176. https://doi.org/10.1037/1072-5245.13.2.176
|
| [58] |
Gerber M, Colledge F, Mücke M, et al. (2018) Psychometric properties of the Shirom-Melamed Burnout Measure (SMBM) among adolescents: Results from three cross-sectional studies. BMC Psychiatry 18: 266-278. https://doi.org/10.1186/s12888-018-1841-5
|
| [59] |
Melamed S, Shirom A, Toker S, et al. (2006) Burnout and risk of type 2 diabetes: A prospective study of apparently healthy employed persons. Psychosom Med 68: 863-869. https://doi.org/10.1097/01.psy.0000242860.24009.f0
|
| [60] | Hayes AF (2017) Introduction to mediation, moderation, and conditional process analysis: A regression-based approach. New York: Guilford publications 79-230. |
| [61] |
Itzchakov G, Weinstein N, Cheshin A (2022) Learning to listen: Downstream effects of listening training on employees' relatedness, burnout, and turnover intentions. Hum Resour Man 62: 565-580. https://doi.org/10.1002/hrm.22103
|
| [62] |
Barthauer L, Kaucher P, Spurk D, et al. (2020) Burnout and career (un) sustainability: Looking into the Blackbox of burnout triggered career turnover intentions. J Vocat Behav 117: 103334. https://doi.org/10.1016/j.jvb.2019.103334
|
| [63] |
Fukui S, Wu W, Salyers MP (2019) Impact of supervisory support on turnover intention: The mediating role of burnout and job satisfaction in a longitudinal study. Adm Policy Ment Health 46: 488-497. https://doi.org/10.1007/s10488-019-00927-0
|
| [64] |
Dunford BB, Shipp AJ, Boss RW, et al. (2012) Is burnout static or dynamic? A career transition perspective of employee burnout trajectories. J Appl Psychol 97: 637-650. https://doi.org/10.1037/a0027060
|
| [65] |
Holst Y, Thorell LB (2019) Functional impairments among adults with ADHD: a comparison with adults with other psychiatric disorders and links to executive deficits. Appl Neuropsychol Adult 27: 243-255. https://doi.org/10.1080/23279095.2018.1532429
|
| [66] |
D'Agati E, Curatolo P, Mazzone L (2019) Comorbidity between ADHD and anxiety disorders across the lifespan. Int J Psychiatry Clin Pract 23: 238-244. https://doi.org/10.1080/13651501.2019.1628277
|
| [67] |
Koyuncu A, Ayan T, İnce Guliyev E, et al. (2022) ADHD and anxiety disorder comorbidity in children and adults: Diagnostic and therapeutic challenges. Curr Psychiatry Rep 24: 129-140. https://doi.org/10.1007/s11920-022-01324-5
|
| [68] |
Riglin L, Leppert B, Dardani C, et al. (2021) ADHD and depression: Investigating a causal explanation. Psychol Med 51: 1890-1897. https://doi.org/10.1017/S0033291720000665
|
| [69] | Zelazo PD, Blair CB, Willoughby MT (2016) Executive function: Implications for education. NCER 2017–2000. Washington: National Center for Education Research. Available from: https://eric.ed.gov/?id=ED570880 |
Figures(6) / Tables(2)

Yaara Turjeman-Levi, Guy Itzchakov, Batya Engel-Yeger. Executive function deficits mediate the relationship between employees' ADHD and job burnout[J]. AIMS Public Health, 2024, 11(1): 294-314. doi: 10.3934/publichealth.2024015


 DownLoad: