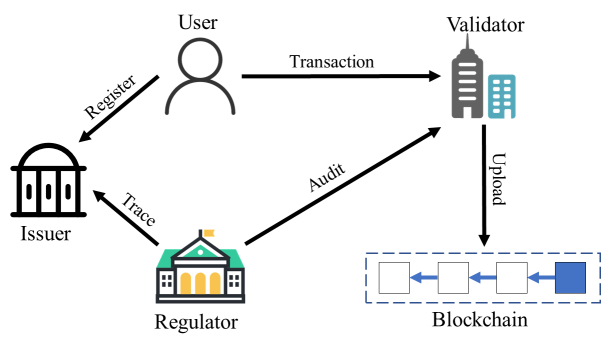
The rapid development of blockchain transactions highlights the importance of privacy protection (including anonymity and confidentiality) and underscores the necessity for auditability. Some schemes, such as PGC and Miniledger, support privacy protection and auditability. However, they only offer incomplete privacy protection (i.e., supporting anonymity or confidentiality exclusively). In response to these issues, we propose a scheme that achieves partial anonymity, confidentiality, auditability, and traceability. By integrating a variant of Pedersen commitments and randomizable signatures, we achieve partial anonymity for users and the auditability of transactions, thereby protecting user privacy under audit conditions. Based on the twisted ElGamal encryption algorithm and specially constructed zero-knowledge proofs, we achieve confidentiality of transaction amounts under legal and regulatory conditions. System test results indicate that this scheme effectively meets the above requirements. The feasibility of this scheme is confirmed through system testing, comparative analysis, and security analysis.
Citation: Le Gao, Junzhe Zhang, Jiaxin Yu, Yin Tang, Zhiqiang Zeng. BPA: A decentralized payment system that balances privacy and auditability[J]. AIMS Mathematics, 2024, 9(3): 6183-6206. doi: 10.3934/math.2024302
The rapid development of blockchain transactions highlights the importance of privacy protection (including anonymity and confidentiality) and underscores the necessity for auditability. Some schemes, such as PGC and Miniledger, support privacy protection and auditability. However, they only offer incomplete privacy protection (i.e., supporting anonymity or confidentiality exclusively). In response to these issues, we propose a scheme that achieves partial anonymity, confidentiality, auditability, and traceability. By integrating a variant of Pedersen commitments and randomizable signatures, we achieve partial anonymity for users and the auditability of transactions, thereby protecting user privacy under audit conditions. Based on the twisted ElGamal encryption algorithm and specially constructed zero-knowledge proofs, we achieve confidentiality of transaction amounts under legal and regulatory conditions. System test results indicate that this scheme effectively meets the above requirements. The feasibility of this scheme is confirmed through system testing, comparative analysis, and security analysis.

| [1] | Z. B. Zheng, S. A. Xie, H. N. Dai, X. P. Chen, H. M. Wang, Blockchain challenges and opportunities: A survey, Int. J. Web. Grid. Serv., 2018,352–375. https://doi.org/10.1504/IJWGS.2018.095647 |
| [2] | Google Scholar. Available from: https://scholar.google.com/. |
| [3] | CoinMarketCap. Available from: https://coinmarketcap.com/. |
| [4] | R. B. Grinberg, Bitcoin: An innovative alternative digital currency, J. Amer. Math. Soc., 2012. http://dx.doi.org/10.1090/S0894-0347-1992-1124979-1 |
| [5] |
E. Androulaki, G. O. Karame, M. Roeschlin, T. Scherer, S. Capkun, Evaluating user privacy in bitcoin, Financ. Cryptogr. Data Secur., 7859 (2013), 34–51. https://doi.org/10.1007/978-3-642-39884-1_4 doi: 10.1007/978-3-642-39884-1_4

|
| [6] | D. Hopwood, S. Bowe, T. Hornby, N. Wilcox, Zcash protocol specification, GitHub: San Francisco, CA, USA, 4 (2016), 220. |
| [7] | G. Maxwell, Coinjoin: Bitcoin privacy for the real world. Available from: https://bitcointalk.org/index.php?topic = 279249. |
| [8] |
S. F. Sun, M. H. Au, J. K. Liu, T. H. Yuen, Ringct 2.0: A compact accumulator-based (linkable ring signature) protocol for blockchain cryptocurrency monero, Comput. Secur., 10493 (2017), 456–474. https://doi.org/10.1007/978-3-319-66399-9_25 doi: 10.1007/978-3-319-66399-9_25
|
| [9] | C. M. Christensen, T. Hall, K. Dillon, D. S. Duncan, Know your customers' jobs to be done, Harvard Bus. Rev., 94 (2016), 54–62. |
| [10] |
J. Ferwerda, The economics of crime and money laundering: Does anti-money laundering policy reduce crime?, Rev. Law. Econ., 5 (2009), 903–929. https://doi.org/10.2202/1555-5879.1421 doi: 10.2202/1555-5879.1421
|
| [11] | R. Auer, R. Böhme, The technology of retail central bank digital currency, J. Amer. Math. Soc., 2020. http://dx.doi.org/10.1090/S0894-0347-1992-1124979-1 |
| [12] | T. P. Pedersen, Non-interactive and information-theoretic secure verifiable secret sharing, CRYPTO 1991: Advances in Cryptology, Springer, Berlin, Heidelberg, 576 (2001), 129–140. https://doi.org/10.1007/3-540-46766-1_9 |
| [13] | Mimblewimble, Tom Elvis Jedusor. Available from: https://download.wpsoftware.net/bitcoin/wizardry/mimblewimble.txt. |
| [14] | N. Van Saberhagen, CryptoNote v 2.0, J. Amer. Math. Soc., 2013. |
| [15] | E. Fujisaki, K. Suzuki, Traceable ring signature, PKC 2007: Public Key Cryptography, Springer, Berlin, Heidelberg, 4450 (2007), 181–200. https://doi.org/10.1007/978-3-540-71677-8_13 |
| [16] | T. H. Yuen, S. Sun, J. K. Liu, M. H. Au, M. F. Esgin, Q. Z. Zhang, Ringct 3.0 for blockchain confidential transaction: Shorter size and stronger security, Financial Cryptography and Data Security, Springer, Cham, 12059 (2020), 464–483. https://doi.org/10.1007/978-3-030-51280-4_25 |
| [17] | P. Fauzi, S. Meiklejohn, R. Mercer, C. Orlandi, Quisquis: A new design for anonymous cryptocurrencies, ASIACRYPT 2019: Advances in Cryptology, Springer, Cham, 11921 (2019), 649–678. https://doi.org/10.1007/978-3-030-34578-5_23 |
| [18] | I. Miers, C. Garman, M. Green, A. D. Rubin, Zerocoin: Anonymous distributed e-cash from bitcoin, In: 2013 IEEE Symposium on Security and Privacy, IEEE, Berkeley, CA, USA, 2013,397–411. https://doi.org/10.1109/SP.2013.34 |
| [19] | A. De Santis, S. Micali, G. Persiano, Non-interactive zero-knowledge proof systems, CRYPTO 1987: Advances in Cryptology, Springer, Berlin, Heidelberg, 293 (1988), 52–72. https://doi.org/10.1007/3-540-48184-2_5 |
| [20] | E. B. Sasson, A. Chiesa, C. Garman, M. Green, I. Miers, E. Tromer, et al., Zerocash: Decentralized anonymous payments from bitcoin, In: 2014 IEEE Symposium on Security and Privacy, IEEE, Berkeley, CA, USA, 2014,459–474. http://dx.doi.org/10.1109/SP.2014.36 |
| [21] | N. Bitansky, R. Canetti, A. Chiesa, E. Tromer, From extractable collision resistance to succinct non-interactive arguments of knowledge, and back again, ITCS '12: Proceedings of the 3rd Innovations in Theoretical Computer Science Conference, 2012,326–349. https://doi.org/10.1145/2090236.2090263 |
| [22] | M. Szydlo, Merkle tree traversal in log space and time, EUROCRYPT 2004: Advances in Cryptology, Springer, Berlin, Heidelberg, 3027 (2004), 541–554. https://doi.org/10.1007/978-3-540-24676-3_32 |
| [23] | C. Garman, M. Green, I. Miers, Accountable privacy for decentralized anonymous payments, FC 2016: Financial Cryptography and Data Security, Springer, Berlin, Heidelberg, 2017, 81–98. https://doi.org/10.1007/978-3-662-54970-4_5 |
| [24] | E. Cecchetti, F. Zhang, Y. Ji, A. Kosba, A. Juels, E. Shi, Solidus: Confidential distributed ledger transactions via PVORM, CCS '17: Proceedings of the 2017 ACM SIGSAC Conference on Computer and Communications Security, 2017,701–717. https://doi.org/10.1145/3133956.3134010 |
| [25] | Y. Li, G. Yang, W. Susilo, Y. Yu, M. H. Au, D. X. Liu, Traceable monero: Anonymous cryptocurrency with enhanced accountability, In: IEEE Transactions on Dependable and Secure Computing, IEEE, 18 (2019), 679–691. http://dx.doi.org/10.1109/TDSC.2019.2910058 |
| [26] | N. Narula, W. Vasquez, M. Virza, zkLedger: Privacy-Preserving auditing for distributed ledgers, In: Proceedings of the 15th USENIX Symposium on Networked Systems Design and Implementation (NSDI '18), USA, 2018, 65–80. |
| [27] | P. Chatzigiannis, F. Baldimtsi, Miniledger: Compact-sized anonymous and auditable distributed payments, ESORICS 2021: Computer Security, Springer, Cham, 12972 (2021), 407–429. https://doi.org/10.1007/978-3-030-88418-5_20 |
| [28] | Y. Chen, X. Ma, C. Tang, M. H. Au, PGC: decentralized confidential payment system with auditability, ESORICS 2020: Computer Security, Springer, Cham, 12308 (2020), 591–610. https://doi.org/10.1007/978-3-030-58951-6_29 |
| [29] | B. Bünz, J. Bootle, D. Boneh, A. Poelstra, P. Wuille, G. Maxwell, Bulletproofs: Short proofs for confidential transactions and more, In: 2018 IEEE symposium on security and privacy (SP), IEEE, San Francisco, CA, USA, 2018,315–334. https://doi.org/10.1109/SP.2018.00020 |
| [30] | B. Bünz, S. Agrawal, M. Zamani, D. Boneh, Zether: Towards privacy in a smart contract world, FC 2020: Financial Cryptography and Data Security, Springer, Cham, 12059 (2020), 423–443. https://doi.org/10.1007/978-3-030-51280-4_23 |
| [31] | Z. Guan, Z. Wan, Y. Yang, Y. Zhou, B. Huang, BlockMaze: An efficient privacy-preserving account-model blockchain based on zk-SNARKs, IEEE Transactions on Dependable and Secure Computing, IEEE, 19 (2020), 1446–1463. https://doi.org/10.1109/TDSC.2020.3025129 |
| [32] | E. Androulaki, J. Camenisch, A. D. Caro, M. Dubovitskaya, K. Elkhiyaoui, B. Tackmann, Privacy-preserving auditable token payments in a permissioned blockchain system, AFT '20: Proceedings of the 2nd ACM Conference on Advances in Financial Technologies, 2020,255–267. https://doi.org/10.1145/3419614.3423259 |
| [33] | I. Damgård, C. Ganesh, H. Khoshakhlagh, C. Orlandi, L. Siniscalchi, Balancing privacy and accountability in blockchain identity management, CT-RSA 2021: Topics in Cryptology, Springer, Cham, 12704 (2021), 552–576. https://doi.org/10.1007/978-3-030-75539-3_23 |
| [34] | O. Goldreich, Secure multi-party computation, Manuscript Preliminary Version, 1998, 78–110. |
| [35] | M. M. Islam, M. K. Islam, M. Shahjalal, M. Z. Chowdhury, Y. M. Jang, A low-cost cross-border payment system based on auditable cryptocurrency with consortium blockchain: Joint digital currency, In: IEEE Transactions on Services Computing, IEEE, 16 (2022), 1616–1629. https://doi.org/10.1109/TSC.2022.3207224 |
| [36] | K. Wüst, K. Kostiainen, N. Delius, S. Capkun, Platypus: A central bank digital currency with unlinkable transactions and privacy-preserving regulation, CCS '22: Proceedings of the 2022 ACM SIGSAC Conference on Computer and Communications Security, 2022, 2947–2960. https://doi.org/10.1145/3548606.3560617 |
| [37] | A. Tomescu, A. Bhat, B. Applebaum, I. Abraham, G. Gueta, B. Pinkas, et al., Utt: Decentralized ecash with accountable privacy, Cryptology ePrint Archive, 2022, in press. Available from: https://ia.cr/2022/452. |
| [38] | L. Xue, D. Liu, J. Ni, X. Lin, X. S. Shen, Enabling regulatory compliance and enforcement in decentralized anonymous payment, IEEE Transactions on Dependable and Secure Computing, IEEE, 20 (2022), 931–943. https://doi.org/10.1109/TDSC.2022.3144991 |
| [39] | C. Lin, X. Huang, J. Ning, D. He, Aca: Anonymous, confidential and auditable transaction systems for blockchain, IEEE Transactions on Dependable and Secure Computing, IEEE, 20 (2022), 4536–4550. https://doi.org/10.1109/TDSC.2022.3228236 |
| [40] | A. Menezes, The discrete logarithm problem, Elliptic Curve Public Key Cryptosystems, Springer, Boston, MA, 234 (1993), 49–59. https://doi.org/10.1007/978-1-4615-3198-2_4 |
| [41] | D. Pointcheval, O. Sanders, Short randomizable signatures, CT-RSA 2016: Topics in Cryptology, Springer, Cham, 9610 (2016), 111–126. https://doi.org/10.1007/978-3-319-29485-8_7 |
Figures(3) / Tables(5)

Le Gao, Junzhe Zhang, Jiaxin Yu, Yin Tang, Zhiqiang Zeng. BPA: A decentralized payment system that balances privacy and auditability[J]. AIMS Mathematics, 2024, 9(3): 6183-6206. doi: 10.3934/math.2024302


 DownLoad: