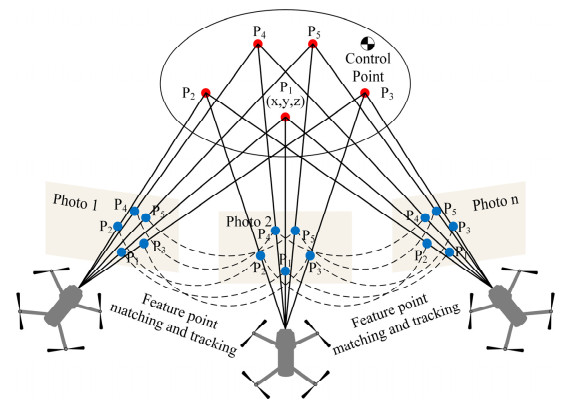
The use of unmanned aerial vehicles (UAVs) for photogrammetry allows the rapid acquisition of high-resolution images of geological masses in complex landforms. However, effective analysis of the acquired image information remains a key research issue. At K158 + 837 on the Chongqing-Huaihua Railway, Baima jointed rock masses were reconstructed with high accuracy using UAV close-range photogrammetry technology, and rock discontinuities were extracted from the projected image. The proposed modeling algorithm for jointed rock masses enables the preprocessing of two-dimensional jointed rock mass slopes. Numerical simulations using the disk-based discontinuous deformation analysis method show that the discontinuity network formed by initial cutting significantly affects the subsequent crack development. Meanwhile, simulation results under different scenarios indicate the importance of the pre-reinforcement measures applied to unstable rock masses. The workflow developed based on these results can serve as a reference for the comprehensive acquisition, recognition and numerical modeling analysis of similar jointed rock masses.
Citation: Quan Dai, Biao Zhao, Shuguang Wang, Dongliang Huang, Changrui Jin. Numerical simulation scheme of jointed rock masses using UAV photogrammetry and a disk-based discontinuous deformation analysis model[J]. Electronic Research Archive, 2023, 31(6): 3381-3399. doi: 10.3934/era.2023171
The use of unmanned aerial vehicles (UAVs) for photogrammetry allows the rapid acquisition of high-resolution images of geological masses in complex landforms. However, effective analysis of the acquired image information remains a key research issue. At K158 + 837 on the Chongqing-Huaihua Railway, Baima jointed rock masses were reconstructed with high accuracy using UAV close-range photogrammetry technology, and rock discontinuities were extracted from the projected image. The proposed modeling algorithm for jointed rock masses enables the preprocessing of two-dimensional jointed rock mass slopes. Numerical simulations using the disk-based discontinuous deformation analysis method show that the discontinuity network formed by initial cutting significantly affects the subsequent crack development. Meanwhile, simulation results under different scenarios indicate the importance of the pre-reinforcement measures applied to unstable rock masses. The workflow developed based on these results can serve as a reference for the comprehensive acquisition, recognition and numerical modeling analysis of similar jointed rock masses.

| [1] |
H. Chen, H. Tang, S. Ye, Damage model of control fissure in perilous rock, Appl. Math. Mech., 27 (2006), 967–974. https://doi.org/10.1007/s10483-006-0713-y doi: 10.1007/s10483-006-0713-y

|
| [2] |
J. W. Fu, X. Z. Zhang, W. S. Zhu, K. Chen, J. F. Guan, Simulating progressive failure in brittle jointed rock masses using a modified elastic-brittle model and the application, Eng. Fract. Mech., 178 (2017), 212–230. https://doi.org/10.1016/j.engfracmech.2017.04.037 doi: 10.1016/j.engfracmech.2017.04.037
|
| [3] |
B. Shen, O. Stephansson, Modification of the G-criterion for crack propagation subjected to compression, Eng. Fract. Mech., 47 (1994), 177–189. https://doi.org/10.1016/0013-7944(94)90219-4 doi: 10.1016/0013-7944(94)90219-4
|
| [4] |
H. Yan, P. Cao, X. Jiang, Z. Li, Effective shear stress criterion for closed-crack fracture, Rock Soil Mech., 29 (2008), 470–474. https://doi.org/10.3969/j.issn.1000-7598.2008.z1.095 doi: 10.3969/j.issn.1000-7598.2008.z1.095
|
| [5] |
A. X. Zheng, X. Q. Luo, Research on combined fracture criterion of rock under compression-shear stress, Rock Soil Mech., 36 (2015), 1892–1898. https://doi.org/10.16285/j.rsm.2015.07.009 doi: 10.16285/j.rsm.2015.07.009
|
| [6] |
N. Li, W. Chen, P. Zhang, G. Swoboda, The mechanical properties and a fatigue-damage model for jointed rock masses subjected to dynamic cyclical loading, Int. J. Rock Mech. Min. Sci., 38 (2001), 1071–1079. https://doi.org/10.1016/S1365-1609(01)00058-2 doi: 10.1016/S1365-1609(01)00058-2
|
| [7] |
H. Liu, L. Zhang, A damage constitutive model for rock mass with nonpersistently closed joints under uniaxial compression, Arab. J. Sci. Eng., 40 (2015), 3107–3117. https://doi.org/10.1007/s13369-015-1777-8 doi: 10.1007/s13369-015-1777-8
|
| [8] |
S. Chen, C. Qiao, Composite damage constitutive model of jointed rock mass considering crack propagation length and joint friction effect, Arab. J. Geosci., 11 (2018), 283. https://doi.org/10.1007/s12517-018-3643-y doi: 10.1007/s12517-018-3643-y
|
| [9] |
X. X. Yang, H. W. Jing, C. A. Tang, S. Q. Yang, Effect of parallel joint interaction on mechanical behavior of jointed rock mass models, Int. J. Rock Mech. Min. Sci., 92 (2017), 40–53. https://doi.org/10.1016/j.ijrmms.2016.12.010 doi: 10.1016/j.ijrmms.2016.12.010
|
| [10] |
Q. Lin, P. Cao, J. Meng, R. Cao, Z. Zhao, Strength and failure characteristics of jointed rock mass with double circular holes under uniaxial compression: Insights from discrete element method modelling, Theor. Appl. Fract. Mech., 109 (2020), 102692. https://doi.org/10.1016/j.tafmec.2020.102692 doi: 10.1016/j.tafmec.2020.102692
|
| [11] |
P. Yin, R. H. C. Wong, K. T. Chau, Coalescence of two parallel pre-existing surface cracks in granite, Int. J. Rock Mech. Min. Sci., 68 (2014), 66–84. https://doi.org/10.1016/j.ijrmms.2014.02.011 doi: 10.1016/j.ijrmms.2014.02.011
|
| [12] |
E. Gerolymatou, T. Triantafyllidis, Shearing of materials with intermittent Joints, Rock Mech. Rock Eng., 49 (2016), 2689–2700. https://doi.org/10.1007/s00603-016-0956-6 doi: 10.1007/s00603-016-0956-6
|
| [13] |
G. Chen, Y. Zhang, R. Huang, F. Guo, G. Zhang, Failure mechanism of rock bridge based on acoustic emission technique, J. Sensors, 2015 (2015), 1–11. https://doi.org/10.1155/2015/964730 doi: 10.1155/2015/964730
|
| [14] |
S. Q. Yang, Z. Yang, H. W. Jing, T. Xu, Fracture evolution mechanism of hollow sandstone under conventional triaxial compression by X-ray micro-CT observations and three-dimensional numerical simulations, Int. J. Solids Struct., 190 (2020), 156–180. https://doi.org/10.1016/j.ijsolstr.2019.11.011 doi: 10.1016/j.ijsolstr.2019.11.011
|
| [15] |
B. D. Thompson, R. P. Young, D. A. Lockner, Premonitory acoustic emissions and stick-slip in natural and smooth-faulted Westerly granite, J. Geophys. Res. Solid Earth, 114 (2009), 1–14. https://doi.org/10.1029/2008JB005753 doi: 10.1029/2008JB005753
|
| [16] |
S. D. Goodfellow, N. Tisato, M. Ghofranitabari, M. H. B. Nasseri, R. P. Young, Attenuation properties of fontainebleau sandstone during true-triaxial deformation using active and passive ultrasonics, Rock Mech. Rock Eng., 48 (2015), 2551–2566. https://doi.org/10.1007/s00603-015-0833-8 doi: 10.1007/s00603-015-0833-8
|
| [17] |
J. B. Zhu, T. Zhou, Z. Y. Liao, L. Sun, X. B. Li, R. Chen, Replication of internal defects and investigation of mechanical and fracture behaviour of rock using 3D printing and 3D numerical methods in combination with X-ray computerized tomography, Int. J. Rock Mech. Min. Sci., 106 (2018), 198–212. https://doi.org/10.1016/j.ijrmms.2018.04.022 doi: 10.1016/j.ijrmms.2018.04.022
|
| [18] |
S. Q. Yang, P. F. Yin, Y. H. Huang, Experiment and discrete element modelling on strength, deformation and failure behaviour of shale under Brazilian compression, Rock Mech. Rock Eng., 52 (2019), 4339–4359. https://doi.org/10.1007/s00603-019-01847-z doi: 10.1007/s00603-019-01847-z
|
| [19] |
T. De Kock, M. A. Boone, T. De Schryver, J. Van Stappen, H. Derluyn, B. Masschaele, et al., A pore-scale study of fracture dynamics in rock using X-ray micro-CT under ambient freeze-thaw cycling, Environ. Sci. Technol., 49 (2015), 2867–2874. https://doi.org/10.1021/es505738d doi: 10.1021/es505738d
|
| [20] |
P. Zhang, Y. I. Lee, J. Zhang, A review of high-resolution X-ray computed tomography applied to petroleum geology and a case study, Micron, 124 (2019), 102702. https://doi.org/10.1016/j.micron.2019.102702 doi: 10.1016/j.micron.2019.102702
|
| [21] |
S. Fereshtenejad, J. J. Song, Fundamental study on applicability of powder-based 3D printer for physical modeling in rock mechanics, Rock Mech. Rock Eng., 49 (2016), 2065–2074. https://doi.org/10.1007/s00603-015-0904-x doi: 10.1007/s00603-015-0904-x
|
| [22] |
L. Kong, M. Ostadhassan, C. Li, N. Tamimi, Pore characterization of 3D-printed gypsum rocks: a comprehensive approach, J. Mater. Sci., 53 (2018), 5063–5078. https://doi.org/10.1007/s10853-017-1953-1 doi: 10.1007/s10853-017-1953-1
|
| [23] |
S. Zhang, S. Wu, C. Chu, P. Guo, G. Zhang, Acoustic emission associated with self-sustaining failure in low-porosity sandstone under uniaxial compression, Rock Mech. Rock Eng., 52 (2019), 2067–2085. https://doi.org/10.1007/s00603-018-1686-8 doi: 10.1007/s00603-018-1686-8
|
| [24] | A. Palmström, Measurement and characterizations of rock mass jointing, in In-Situ Characterization of Rocks-Chapter 2 (eds. V.M. Sharma and K.R. Saxena), A. A. Balkema Publishers (2001), 1–40. |
| [25] |
U. Niethammer, M. R. James, S. Rothmund, J. Travelletti, M. Joswig, UAV-based remote sensing of the Super-Sauze landslide: Evaluation and results, Eng. Geol., 128 (2012), 2–11. https://doi.org/10.1016/j.enggeo.2011.03.012 doi: 10.1016/j.enggeo.2011.03.012
|
| [26] |
J. A. Gonçalves, R. Henriques, UAV photogrammetry for topographic monitoring of coastal areas, ISPRS J. Photogramm. Remote Sens., 104 (2015), 101–111. https://doi.org/10.1016/j.isprsjprs.2015.02.009 doi: 10.1016/j.isprsjprs.2015.02.009
|
| [27] |
D. Dominici, M. Alicandro, V. Massimi, UAV photogrammetry in the post-earthquake scenario: case studies in L'Aquila, Geomatics, Nat. Hazards Risk, 8 (2017), 87–103. https://doi.org/10.1080/19475705.2016.1176605 doi: 10.1080/19475705.2016.1176605
|
| [28] |
X. Zhang, P. Zhao, Q. Hu, M. Ai, D. Hu, J. Li, A UAV-based panoramic oblique photogrammetry (POP) approach using spherical projection, ISPRS J. Photogramm. Remote Sens., 159 (2020), 198–219. https://doi.org/10.1016/j.isprsjprs.2019.11.016 doi: 10.1016/j.isprsjprs.2019.11.016
|
| [29] |
J. Chen, H. Zhu, X. Li, Automatic extraction of discontinuity orientation from rock mass surface 3D point cloud, Comput. Geosci., 95 (2016), 18–31. https://doi.org/10.1016/j.cageo.2016.06.015 doi: 10.1016/j.cageo.2016.06.015
|
| [30] |
W. C. Haneberg, Using close range terrestrial digital photogrammetry for 3-D rock slope modeling and discontinuity mapping in the United States, Bull. Eng. Geol. Environ., 67 (2008), 457–469. https://doi.org/10.1007/s10064-008-0157-y doi: 10.1007/s10064-008-0157-y
|
| [31] |
D. Kong, C. Saroglou, F. Wu, P. Sha, B. Li, Development and application of UAV-SfM photogrammetry for quantitative characterization of rock mass discontinuities, Int. J. Rock Mech. Min. Sci., 141 (2021), 104729. https://doi.org/10.1016/j.ijrmms.2021.104729 doi: 10.1016/j.ijrmms.2021.104729
|
| [32] |
S. Mineo, D. Caliò, G. Pappalardo, UAV-based photogrammetry and infrared thermography applied to rock mass survey for geomechanical purposes, Remote Sens., 14 (2022), 473. https://doi.org/10.3390/rs14030473 doi: 10.3390/rs14030473
|
| [33] |
W. Wang, W. B. Zhao, B. Chai, J. Du, L. S. Tang, X. W. Yi, Discontinuity interpretation and identification of potential rockfalls for high-steep slopes based on UAV nap-of-the-object photogrammetry, Comput. Geosci., 166 (2022), 105191. https://doi.org/10.1016/j.cageo.2022.105191 doi: 10.1016/j.cageo.2022.105191
|
| [34] |
M. J. Herrero, A. P. Pérez-Fortes, J. I. Escavy, J. M. Insua-Arévalo, R. De la Horra, F. López-Acevedo, et.al., 3D model generated from UAV photogrammetry and semi-automated rock mass characterization, Comput. Geosci., 163 (2022), 105121. https://doi.org/10.1016/j.cageo.2022.105121 doi: 10.1016/j.cageo.2022.105121
|
| [35] | G. H. Shi, Discontinuous deformation analysis: A new numerical model for the statics and dynamics of block systems, University of California, Berkeley, 1988. |
| [36] |
X. B. Wang, W. J. Xu, B. Y. Zhang, Q. C. Sun, Particle crushing simulations with improved discontinuous deformation analysis, Eng. Comput. (Swansea, Wales), 31 (2014), 1321–1341. https://doi.org/10.1108/EC-02-2013-0051 doi: 10.1108/EC-02-2013-0051
|
| [37] |
Y. Y. Jiao, G. H. Huang, Z. Y. Zhao, F. Zheng, L. Wang, An improved three-dimensional spherical DDA model for simulating rock failure, Sci. China Technol. Sci., 58 (2015), 1533–1541. https://doi.org/10.1007/s11431-015-5898-9 doi: 10.1007/s11431-015-5898-9
|
| [38] |
K. Zhang, F. Liu, K. Xia, Formulation, calibration, and applications of disk-based discontinuous deformation analysis for rock failure simulation, Int. J. Rock Mech. Min. Sci., 148 (2021), 104944. https://doi.org/10.1016/j.ijrmms.2021.104944 doi: 10.1016/j.ijrmms.2021.104944
|
| [39] |
S. Verykokou, C. Ioannidis, A photogrammetry-based structure from motion algorithm using robust iterative bundle adjustment techniques, ISPRS Ann. Photogramm. Remote Sens. Spat. Inf. Sci., IV-4/W6 (2018), 73–80. https://doi.org/10.5194/isprs-annals-IV-4-W6-73-2018 doi: 10.5194/isprs-annals-IV-4-W6-73-2018
|
| [40] |
L. Cui, C. O'Sullivan, Analysis of a triangulation based approach for specimen generation for discrete element simulations, Granul. Matter, 5 (2003), 135–145. https://doi.org/10.1007/s10035-003-0145-7 doi: 10.1007/s10035-003-0145-7
|
| [41] |
K. Zhang, F. Liu, G. Zhao, K. Xia, Fast and efficient particle packing algorithms based on triangular mesh, Powder Technol., 366 (2020), 448–459. https://doi.org/10.1016/j.powtec.2020.01.079 doi: 10.1016/j.powtec.2020.01.079
|
| [42] |
M. Obermayr, K. Dressler, C. Vrettos, P. Eberhard, A bonded-particle model for cemented sand, Comput. Geotech., 49 (2013), 299–313. https://doi.org/10.1016/j.compgeo.2012.09.001 doi: 10.1016/j.compgeo.2012.09.001
|
| [43] |
S. Utili, R. Nova, DEM analysis of bonded granular geomaterials, Int. J. Numer. Anal. Methods Geomech., 32 (2008), 1997–2031. https://doi.org/10.1002/nag.728 doi: 10.1002/nag.728
|
| [44] |
G. H. Huang, Y. Z. Xu, X. W. Yi, M. Xia, An efficient disk-based discontinuous deformation analysis model for simulating large-scale problems, Int. J. Geomech., 20 (2020), 04020103. https://doi.org/10.1061/(asce)gm.1943-5622.0001711 doi: 10.1061/(ASCE)GM.1943-5622.0001711
|
| [45] |
G. H. Huang, X. F. Chen, X. W. Yi, Y. Z. Xu, S. Zhang, Z. B. Lin, An improved disk discontinuous deformation analysis model for simulating particle mixing process in rotary drums, Powder Technol., 368 (2020), 202–212. https://doi.org/10.1016/j.powtec.2020.04.061 doi: 10.1016/j.powtec.2020.04.061
|


Figures(13) / Tables(1)
Quan Dai, Biao Zhao, Shuguang Wang, Dongliang Huang, Changrui Jin. Numerical simulation scheme of jointed rock masses using UAV photogrammetry and a disk-based discontinuous deformation analysis model[J]. Electronic Research Archive, 2023, 31(6): 3381-3399. doi: 10.3934/era.2023171


 DownLoad: