


Figure 1.
Fresh food e-commerce network with front warehouses.
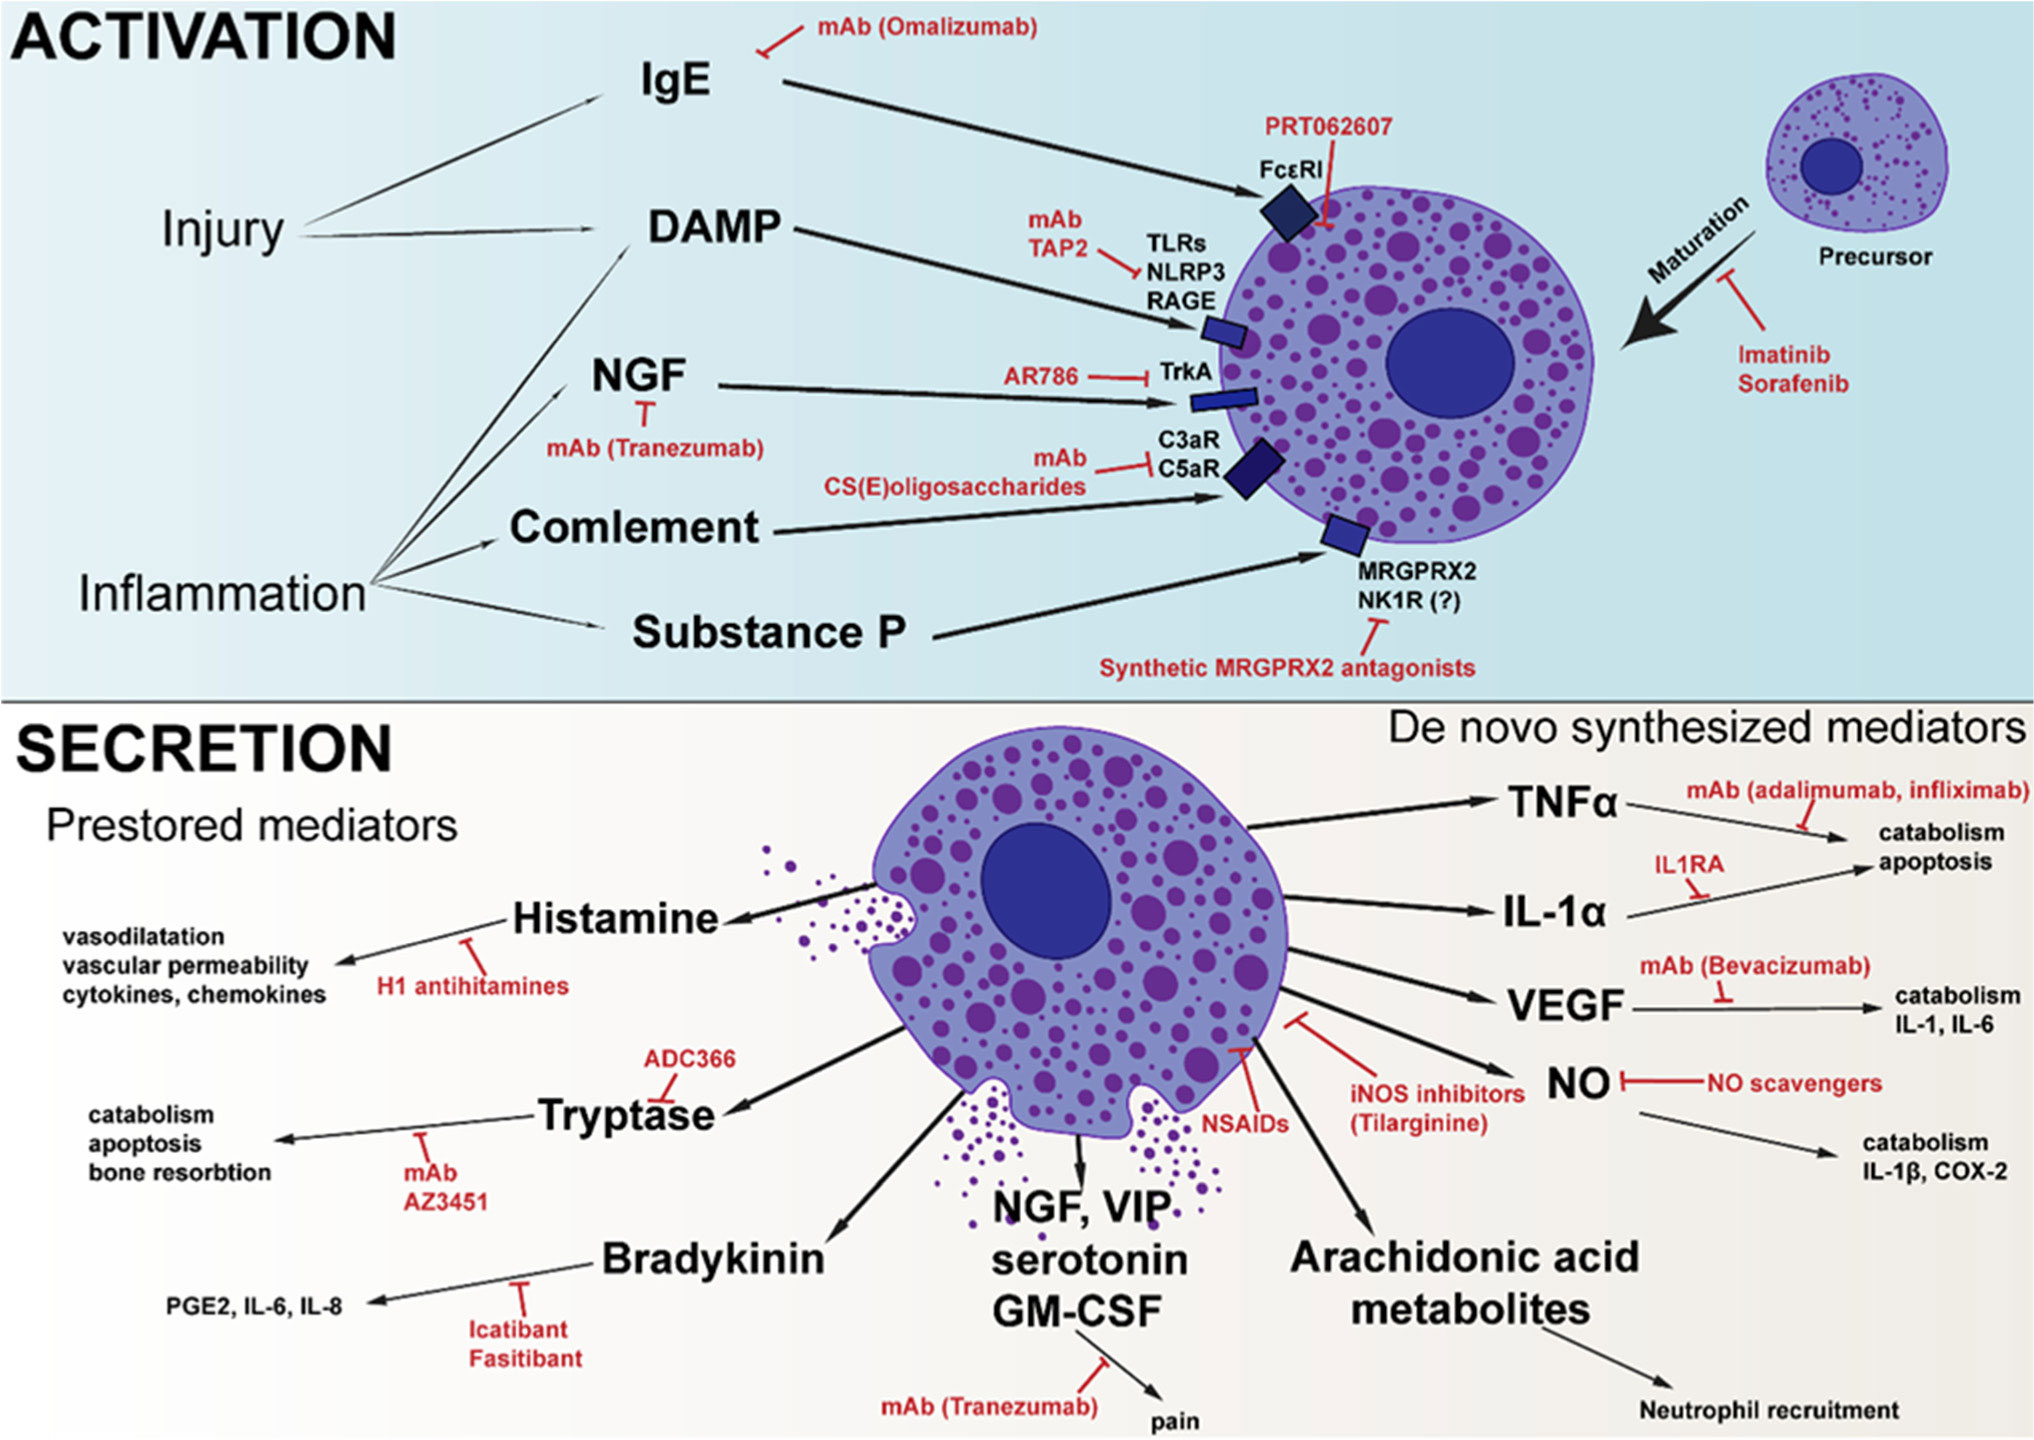
Mast cells are best known for their involvement in the pathogenesis of allergic reactions and inflammation. Due to the wide variety of activation methods and the various mediators that mast cells can synthesize and store, they can regulate all stages of the inflammatory process. There are a large amount of data describing the role of mast cells in the development of autoimmune rheumatoid arthritis, but their role in the development of inflammatory traumatic osteoarthritis remains poorly described. However, non-autoimmune cartilage damage is the main reason for joint replacement surgeries. As important regulators of the inflammatory process, mast cells could be an interesting target for the treatment of osteoarthritis. Herein, we summarize the knowledge about the role of mast cells in the pathogenesis of osteoarthritis and outline various approaches that, to varying degrees, seem promising for the correction of the disease.
Citation: Anastasiia D. Kurenkova, Peter S. Timashev. Mast cells: A dark horse in osteoarthritis treatment[J]. AIMS Allergy and Immunology, 2022, 6(4): 228-247. doi: 10.3934/Allergy.2022017
| [1] | Wenqiang Zhang, Chen Li, Mitsuo Gen, Weidong Yang, Zhongwei Zhang, Guohui Zhang . Multiobjective particle swarm optimization with direction search and differential evolution for distributed flow-shop scheduling problem. Mathematical Biosciences and Engineering, 2022, 19(9): 8833-8865. doi: 10.3934/mbe.2022410 |
| [2] | Shiqi Zou, Xiaoping Shi, Shenmin Song . A multi-objective optimization framework with rule-based initialization for multi-stage missile target allocation. Mathematical Biosciences and Engineering, 2023, 20(4): 7088-7112. doi: 10.3934/mbe.2023306 |
| [3] | Ruiping Yuan, Jiangtao Dou, Juntao Li, Wei Wang, Yingfan Jiang . Multi-robot task allocation in e-commerce RMFS based on deep reinforcement learning. Mathematical Biosciences and Engineering, 2023, 20(2): 1903-1918. doi: 10.3934/mbe.2023087 |
| [4] | Rongmei Geng, Renxin Ji, Shuanjin Zi . Research on task allocation of UAV cluster based on particle swarm quantization algorithm. Mathematical Biosciences and Engineering, 2023, 20(1): 18-33. doi: 10.3934/mbe.2023002 |
| [5] | Yanpei Liu, Yunjing Zhu, Yanru Bin, Ningning Chen . Resources allocation optimization algorithm based on the comprehensive utility in edge computing applications. Mathematical Biosciences and Engineering, 2022, 19(9): 9147-9167. doi: 10.3934/mbe.2022425 |
| [6] | Haolan Zhou, Gang Chen, Yujun Lu, Xiaoya Cheng, Hao Xin . A permutation-combination heuristics for crane-based automated storage and retrieval systems considering order fulfillment time and energy consumption. Mathematical Biosciences and Engineering, 2024, 21(1): 116-143. doi: 10.3934/mbe.2024006 |
| [7] | Rui Zhu, Yuhang Chen, Qianqian Yu, Siqing Liu, Jianjie Wang, Zhili Zeng, Liming Cheng . Effects of contusion load on cervical spinal cord: A finite element study. Mathematical Biosciences and Engineering, 2020, 17(3): 2272-2283. doi: 10.3934/mbe.2020120 |
| [8] | Begoña González, Daniel A. Rossit, Máximo Méndez, Mariano Frutos . Objective space division-based hybrid evolutionary algorithm for handing overlapping solutions in combinatorial problems. Mathematical Biosciences and Engineering, 2022, 19(4): 3369-3401. doi: 10.3934/mbe.2022156 |
| [9] | Smita Shandilya, Ivan Izonin, Shishir Kumar Shandilya, Krishna Kant Singh . Mathematical modelling of bio-inspired frog leap optimization algorithm for transmission expansion planning. Mathematical Biosciences and Engineering, 2022, 19(7): 7232-7247. doi: 10.3934/mbe.2022341 |
| [10] | Bin Deng, Ran Ding, Jingfeng Li, Junfeng Huang, Kaiyi Tang, Weidong Li . Hybrid multi-objective metaheuristic algorithms for solving airline crew rostering problem with qualification and language. Mathematical Biosciences and Engineering, 2023, 20(1): 1460-1487. doi: 10.3934/mbe.2023066 |
Mast cells are best known for their involvement in the pathogenesis of allergic reactions and inflammation. Due to the wide variety of activation methods and the various mediators that mast cells can synthesize and store, they can regulate all stages of the inflammatory process. There are a large amount of data describing the role of mast cells in the development of autoimmune rheumatoid arthritis, but their role in the development of inflammatory traumatic osteoarthritis remains poorly described. However, non-autoimmune cartilage damage is the main reason for joint replacement surgeries. As important regulators of the inflammatory process, mast cells could be an interesting target for the treatment of osteoarthritis. Herein, we summarize the knowledge about the role of mast cells in the pathogenesis of osteoarthritis and outline various approaches that, to varying degrees, seem promising for the correction of the disease.
Online sourcing of fresh food for daily needs has grown in popularity as a way to avoid human contact in public places and reduce the risk of infection during epidemics. Farmers' markets have moved to e-commerce platforms, and fresh food retail e-commerce has emerged as a popular new retail type [1]. The impact of the epidemic will continue to accelerate the development of fresh food e-commerce in the future, with the fresh food e-commerce industry expected to exceed a trillion yuan in 2023, with a high growth trend [2]. There are three major forms of logistics network and operational models in the retail form of fresh food e-commerce: (1) Front warehouse mode. Fresh e-commerce platforms set up multiple small warehouses (front warehouses) near communities where consumers are concentrated, and couriers provide customers with instant delivery service from these front warehouses [3]. (2) Warehouse and store integration mode. The store serves as a small fresh food supermarket and fulfills online orders. Consumers can purchase from the store or place orders online, with express delivery [4]. (3) Community group buying mode. Fresh e-commerce initiates group purchases, summarizes orders and distributes products to customers in the community through group buying leaders, while the fresh platform is responsible for the procurement, transportation and after-sales service of fresh food [5].
Front warehouse mode can solve the last mile problem and ensure freshness and timely delivery [6], and it is distinguished from the other two e-commerce modes by its small scale, proximity to the consumer, high layout density and efficient distribution [7]. However, compared to the other two operating modes, front warehouse mode increases the length of the supply chain and incurs higher fulfillment costs (including warehouse rent, inventory costs and order delivery costs), which have become one of the main bottlenecks restricting the development of fresh e-commerce corporations operating in front warehouse mode [8]. Consequently, research on the location optimization of fresh food e-commerce front warehouses is of great application value. This paper presents a case study of an e-commerce company locating new locations for front warehouses using a location optimization model with the goal of minimizing total distribution system cost. The location and allocation decision of front warehouses can be described as follows: In the given set of alternative front warehouse and customer locations, select a certain number to open according to the distribution of customer locations and the quantity of demand, and allocate the customer orders to the open front warehouses nearby, to ensure optimal cost of the distribution network.
The remainder of the paper is structured as follows. Section 2 is a review of the literature. Section 3 discusses the problem description, assumptions and mathematical model. Section 4 presents the solution approach, Section 5 gives a real case study, and Section 6 concludes the paper with limitations and recommendations for future research.
The concepts of sustainable development and circular economy have received extensive attention. Scholars delve into sustainable closed-loop supply chain networks, and have adopted sustainability factors, such as carbon emission, energy consumption and environmental pollution, into their research to respond to real challenges [9]. Goodarzian et al. investigated a citrus fruit supply chain network in Iran to minimize the total cost and CO2 emission simultaneously [10]. Momenitabar et al. designed a sustainable bioethanol supply chain network to cope with the demand increase of bioethanol [11]. Fresh food requires low-temperature preservation during transportation, which greatly meets the quality requirements of consumers but also creates huge energy consumption and carbon emissions [12]. Therefore, research on the sustainability of cold chain transportation is particularly important. Govindan et al. [13] and Wang et al. [14] both studied the cold chain location and routing problem (VRP) from the perspective of low carbon and environmental protection to minimize the impact of carbon emissions on the environment. Wang et al. constructed a bi-objective model to realize carbon emission reduction in fresh agricultural cold chain logistics [15]. Liu designed a dynamic model to reflect the carbon emission cost affected by time-varying vehicle speed [16].
Specifically, scholars have basically matured their research methods on the e-commerce warehouse location problem, mainly based on quantitative analysis, which quantifies costs, service level, demand, time window and other elements to formulate a location model, with designs of specific algorithms to solve it. For example, Nuno et al. presented a solution for selecting a location for the installation of an e-commerce warehouse with the goals of lowering logistics costs and ensuring service improvements, and the problem was solved using multiple criteria decision-making [17]. Wang used the effective covering model to conduct an empirical analysis on the location selection problem of marine product e-commerce distribution centers, taking into account factors such as the surrounding environment, public facilities and population [18]. Ahmadi et al. established a mixed integer programming location model with the goal of maximizing the total profit of serving customers, considering the price elasticity of demand [19]. Macedo et al. proposed a heuristic algorithm based on skewed universal variable neighborhood search to solve the VRP for perishable goods with time constraints [20].
Both precise and heuristic algorithms can solve location problems. The former is suitable for situations where the problem size is not large and can obtain the optimal solution. When the scale of the problem is large, heuristic algorithms can efficiently obtain the Pareto optimization. The location problem is a classic NP-hard problem, and the Pareto optimal solution of an instance can be obtained using heuristic algorithms [21]. Torabi et al. proposed a new fuzzy-stochastic hybrid programming model based on two-stage scenarios and designed an effective multi-step solution to solve practical problems [22]. Erdin and Akbas took the location of storage facilities as a multi-criteria problem, and applied multi-criteria decision-making and TOPSIS (technique for order preference by similarity to an ideal solution) method to plan the location of storage facilities [23]. Silva et al. used three linear relaxation heuristic algorithms and genetic algorithm combined with variable neighborhood hybrid algorithm to solve the problem. The research showed that the performance of the hybrid algorithm was better than the linear relaxation heuristic algorithm [24]. Considering random demand, Silva et al. designed location models for internal distribution and outsourcing operation strategies of e-commerce enterprises, and carried out accurate solutions and heuristic solutions for the models, respectively [25].
Most of the literature only considers the process from front warehouses to customers, neglecting the process from urban distribution center to front warehouses. The improvement of distribution efficiency of a logistics system involves every circulation of the supply chain. This paper takes the front warehouse location problem as a three-tier two-stage logistics network. Although there is extensive research on fresh food e-commerce, the research in specific fields is limited, especially the quantitative research on front warehouse location. The main difference is that the front warehouse of fresh food e-commerce studied in this paper is the end node in the logistics process, providing last-mile service, with a small service scope and scattered service objects. Therefore, it is necessary to finely depict practical problems and systematically consider factors such as cost and environment.
This work presents two major contributions. First, a model of front warehouse location with the objective of total minimum cost is established, and the model and case study make a detailed description of the location of the front warehouse and comprehensive consideration of the location cost. Second, the improved immune algorithm is applied to solve the model, and the comparison with GA proves the validity of the proposed algorithm. Also, a real case study shows that the proposed algorithm is better in performance than the traditional genetic algorithm, and the real case study gives a reference for optimizing the layout of a front warehouse for fresh food e-commerce enterprises. In a word, the research of this study is of practical and academical significance.
Figure 1 depicts the operating mode of a fresh produce e-commerce business with forward warehouses, which includes a point of origin, regional warehouses, front warehouses and customer points. Regional warehouses are large warehouses that are set up for each province or city, with good cold chain storage and processing facilities, and they are typically located far from urban centers. Front warehouses are typically located within the city or in densely populated areas of the city, making it easier to deliver fresh goods to customers in a shorter period of time. First, the e-commerce company buys fresh produce directly from the source and transports it to a regional warehouse where it is processed and packaged. The fresh goods are then transported to front warehouses, where they are temporarily stored to fulfill customer orders. When a customer order is received, the front warehouse with available stock will fulfill the order quickly. To meet the needs of consumers, two specific issues should be addressed. To begin with, in order to make profit, the goal is to reduce total delivery cost. Furthermore, all demand points should be covered. This model divides logistics distribution into two phases: First, products are supplied from urban distribution centers to front warehouses, and then, products are delivered from front warehouses to consumers.
Before developing a model, the following assumptions are made in order to solve the problems listed above:
(1) Only choose the front warehouse from the list of alternative addresses.
(2) Distribution vehicles have the same model and limited capacity.
(3) The operating costs of front warehouses and vehicles are not taken into account.
(4) Customer service time, and loading and unloading time are not taken into account.
(5) Only one supply point can serve a front warehouse, and two or more front warehouses cannot serve a demand point at the same time.
(6) Maintain a constant temperature throughout the delivery process.
(7) Vehicles travel at a fixed value.
The following are the definitions of the model's parameters.
I{i|i=1,2,⋯,I}: set of candidate front warehouses;
J{j|j=1,2,⋯,J}: set of demand points;
L{l|l=1,2,⋯,L}: set of vehicles;
K{k|k=1,2,⋯,K}: set of supply vendors;
Ci: fixed costs for establishing a front warehouse in area i;
C: total cost for establishing a front warehouse;
V: capacity of vehicle;
To: outdoor ambient temperature;
Tr: refrigeration temperature;
λ: energy consumption factor;
α1: unit transportation cost from supplier to front warehouse;
α2: unit transportation cost from front warehouse to demand point;
dki: distance from supply vendor k to front warehouse i;
dij: distance from front warehouse i to demand point j;
qk: supply quantity of vendor k;
qki: cargo volume from supply vendor k to front warehouse i;
qij: demand from front warehouse i to demand point j;
Pj: demand of point j;
s: speed of vehicle;
tki: time of vehicle traveling from supply vendor k to front warehouse i;
tij: time of vehicle traveling from front warehouse i to demand point j;
Xi:Xi=1 means i(i∈I) is selected as front warehouse: for others, Xi=0;
xkil:xkil=1 means vehicle l transporting from supply vendor k to front warehouse i;
for others, xijl=0;
xijl:xijl=1 means vehicle l transporting from front warehouse i to demand point j;
for others, xijl=0;
yij:yij=1 means demand point j is served by front warehouse i;
for others, yij=0.
The front warehouse location allocation problem (FWLAP) model for fresh food logistics constructed in this paper takes the minimum total cost as the objective function. First, the components of the objective function are analyzed, and then the specific composition of the FWLAP model is determined.
(1) Infrastructure and operating costs of fresh logistics distribution system
The infrastructure cost of the fresh food logistics distribution system mainly includes the purchase cost of land, the construction cost of the front warehouse distribution center, the salary and management expenses of workers employed by the distribution center and the expenses incurred by water and electricity consumption. The facility cost is
| C1=∑Ii=1XiCi | (1) |
(2) Fresh logistics distribution and transportation cost
The transportation cost of fresh food logistics and distribution includes the transportation cost from the supply point to the distribution point and cost from the distribution point to the demand point. The total transportation and distribution cost of the two stages is
| C2=∑Ii=1∑Kk=1dkiqkixkilα1+∑Ii=1∑Jj=1dijqijxijlα2 | (2) |
(3) Energy consumption cost
It is well known that vehicles loaded with fresh products need to keep the fresh products in a low-temperature environment during the distribution process. Compared to ordinary vehicles, fresh vehicles consume much more energy. The low-temperature environment of fresh vehicles requires fuel and power consumption to maintain, and the temperature of fresh vehicles is determined by the product type. The fuel and power consumption of different types of products are also different. If the outdoor ambient temperature is below zero, there is no need to refrigerate fresh foods such as vegetables and fruits, and the energy consumption cost will be very low.
| C3=λ(∑Ii=1∑Kk=1dkiqkixkil+∑Ii=1∑Jj=1dijqijxijl) | (3) |
where λ={0,To≤Trconstants,To<Tr, To is outdoor ambient temperature, and Tr is reefertemperature required.
Through detailed analysis of the targets, the FWLAP model is formulated as follows:
| min C=C1+C2+C3 | (4) |
s.t.
| ∑i∈IXiCi≤C | (5) |
| ∑i∈Iqki≤qk | (6) |
| ∑k∈Kqki=∑j∈Jqij i∈I | (7) |
| ∑i∈Iqij≥∑i∈Irj i∈I | (8) |
| ∑i∈IXi≥1 | (9) |
| qki=∑i′∈{i}∪J∑j∈J∑k∈KPjxi′jk i∈I | (10) |
| xijl=0 i∈I,j∈J,l∈L | (11) |
| ∑i∈Ixijl≤1 j∈J,l∈L | (12) |
| ∑j∈I∪Jxijl−∑j∈I∪Jxjil=0 i∈I∪J,l∈L | (13) |
| ∑j∈J,i∈I∪Jxijl⋅Pj≤Vl l∈L | (14) |
| ∑i,j∈I∪J∑l∈Lxijl≥1 | (15) |
| ∑j∈J∑l∈Lxijl≥Xi i∈I | (16) |
| ∑j∈Jxijl≤Xi i∈I,l∈L | (17) |
| ∑i∈Iyij=1 j∈J | (18) |
| Xi=0,1 i∈Ixkil=0,1,xijl=0,1 i,j∈I∪J,l∈L,k∈Kyij=0,1 i∈I,j∈J | (19) |
The goal of Eq (4) is to minimize total cost. Formula (5) indicates that the cost of the selected front warehouse cannot exceed the total cost of the front warehouse. Formula (6) means that the quantity of goods provided by a supplier to a front warehouse cannot exceed its supply capacity. Formula (7) displays that the goods in the front warehouse cannot be retained and are all used for distribution. Formula (8) indicates that the requirements of the demand point must be satisfied. Formula (9) indicates that there is at least one front warehouse. Equation (10) requires that the total front warehouse supply is equal to the total demand of the customer points. According to Eq (11), there is no lateral transportation of goods between front warehouses. Equation (12) represents that a vehicle is assigned to one of the front warehouses. Equation (13) ensures that the vehicle transportation path remains continuous. The capacity limit of vehicles is represented by Eq (14). Equation (15) indicates that a demand point can be served by multiple delivery vehicles. Equations (16) and (17) show that vehicles are only assigned to open front warehouses. Equation (18) represents that only one front warehouse serves a demand point. The constraints of decision variables are represented by Eq (19).
There are numerous methods for resolving location issues, including analytical methods, optimal planning methods, comprehensive factor evaluation methods and so on. These methods, however, have limitations. The analytical method is limited to one distribution center location model. Although there is no limit on the number of distribution centers, the optimal planning method is not appropriate for complex models. The result of the comprehensive factor evaluation method is subjective. As a result, the proposed model is solved using a heuristic algorithm in this study. The genetic algorithm, immune algorithm and neural network are examples of intelligent optimization algorithms that are refined through repeated experimental simulations under various conditions or variants. Among them, immune algorithm research began in the 1980s, and research results show that it outperforms the classical genetic algorithm in solving location problems [26]. In this study, the immune algorithm is used to solve the proposed model.
The immune algorithm is an intelligent optimization algorithm that is generated by simulating the body's powerful immune system [27]. The biological immune system has powerful learning ability, recognition and memory ability to identify harmful information from the outside world, analyze the information and activate defense mechanisms to minimize system damage and ensure robustness and safety. The immune optimization algorithm uses the immune system's diversity generation and retention mechanism to maintain population diversity, overcoming the problem of "premature maturity" that is difficult to solve in the process of finding the optimal solution and successfully obtaining the global optimal solution.
The flow chart of the immune algorithm is shown in Figure 2.

Step 1: Problem analysis. The goal of the research is to select several suitable locations from multiple alternatives in order to establish front warehouses with the shortest total distribution time.
Step 2: Antigen identification. The magnitude of the affinity between the antibody and the antigen is used to identify it.
Step 3: Generation of initial antibody population.
Step 4: Determine the expected probability of reproduction for each individual and evaluate each one in the population.
Step 5: Rank all individuals based on their expected reproduction probability, then choose the top N to form the parent population, and select the top m to store in the memory.
Step 6: Check to see if the loop termination condition is met. To complete the iterative loop, the maximum number of iterations is used as the termination condition.
Step 7: Generation of new population. Generation is made up of two parts, one obtained through antibody selection, crossover and mutation operations, and the other is obtained from the memory bank. After the new generation is generated, the cyclic operation continues.
The specific calculations used in the implementation of the immunization algorithm are as follows.
(1) Generation of the initial antibody population
If the memory bank is empty, the first antibody population is chosen at random from the feasible solution space. If the memory bank is not empty, then the initial antibody population is chosen from it. The initial antibody population in this paper is generated at random using simple coding, and different antibodies indicate different location schemes. The number of front warehouses determines the antibody length in this study, and the antibodies represent the set of selected front warehouses. For example, if there are 5 alternatives, 2 of them should be chosen to establish front warehouses, and antibodies [2,3] indicate that locations 2 and 3 are to open as front warehouses.
(2) Affinity calculation
The degree of recognition of an antigen by an antibody is expressed by the affinity between the antibody and the antigen. The expression of affinity function is as follows.
| Av=1Fv | (20) |
where Fv is the objective function of front warehouse location.
The affinity between antibodies and antibodies is used to measure their similarity, and the algorithm employs Forrest's R-site contiguity method. The principle of the R-site contiguity method is based on the partial matching rule, and the key is determining the R-value. If two individuals are coded with consecutive R-positions or more than R-positions, the antibodies are similar, and vice versa. In this paper, the following formula is used to calculate the antibody affinity.
| Sv,s=kv,sL | (21) |
kv,s denotes the same number of digits between antibodies v and s. L means the length of the antibody, and the value of L is determined by the number of the front warehouse selected. For example, two antibodies are [237854] and [438961], and the comparison shows that three same values exist for the two antibodies. Then the affinity is 0.5.
(3) Calculation of antibody concentration
Antibody concentration denotes the proportion of similar antibodies to the total number of antibodies in the population and characterizes antibody strength. When an external antigen or a new antibody attacks the immune system, the body's immune response becomes intense, and the number of antibodies changes. Most antibodies' affinity will increase as more antibodies are produced. When it exceeds a certain threshold, their concentration suffers. The formula for calculating antibody concentration is as follows.
| Cv=1N∑j∈NSv,s | (22) |
where N denotes the total number of antibodies, and Sv,s is a binary variable. Sv,s = 1 when Sv,s > T, and otherwise, Sv,s = 0. T is a predetermined threshold value.
(4) Expected probability of reproduction
The expected reproduction probability P for each individual is determined by the antibody concentration and the affinity between the antibody and the antigen. The expression for calculating the expected reproduction probability is as follows.
| P=αAv∑Av+(1−α)Cv∑Cv | (23) |
The above equation shows that an individual's fitness is proportional to the expected reproductive probability, whereas individual concentration is inversely proportional to the desired reproduction probability. This suppresses the production of individuals with high concentration while promoting the production of individuals with high fitness, ensuring the population's diversity. α is a constant value.
(5) Immunization operation
Selection operation. The selection operation is carried out using a roulette selection mechanism. The probability of an individual being selected is determined by the ratio of an individual's expected reproductive probability to the overall.
Crossover operation. A crossover operation is one in which genes or gene segments from two chromosomes are exchanged in a specific manner to create a new individual. This paper chooses the crossover operation by multi-point crossover to make the good genes of the parents be inherited in order to produce new good individuals.
Mutation operation. The antibodies are drawn at random from the antibody population generated by the crossover operation, and one of the antibodies is mutated to create a new individual. The most commonly used mutation operations in practice are basic position mutation, flip mutation, adaptive crossover mutation, and so on. In this paper, the flip mutation operation is used to ensure population diversity. The new antibody population produced by the mutation operation is combined with the previously memorized one from memory.
Because the traditional immune optimization algorithm conservatively retains the excellent individuals within the memory bank, the population quality improves as the number of iterations increases, but it is unable to retain more excellent individuals, resulting in a slower convergence rate, which affects computational accuracy. This paper proposes an improved immune algorithm to retain dynamically excellent individuals by establishing the dynamic retention mechanism. The number of excellent individual m in the memory bank is set to change dynamically, and the number of excellent individuals is preserved to increase as the population's overall quality improves. The m population quality function is presented as
| m=(∑pi=1di−p)p×q×k | (24) |
where p is the number of demand points, q is the number of distribution centers, k is the size of the memory bank, and di is the descending position of the distance between nodes in the set of distances between demand points and temporary distribution stations.
Traditional immunization relies on a certain probability to retain the best individual, which increases the number of iterations and computational effort while also affecting computational accuracy. As a result, the population in this paper is chosen using the Metropolis criterion. The i-th individual in a population is compared to the (i+1)-th, and the rule of accepting the (i+1)-th individual is chosen as in Eq (18); otherwise, the i-th individual is accepted.
| {gi+1(x)≤gi(x)R≤exp(−gi+1(x)−gi+1(x)W) | (25) |
where g(x) denotes the fitness value, w is the temperature constant and R represents a random number uniformly distributed on [0, 1].
Alternative front warehouses make use of open areas near residential areas, such as city squares, stadiums, and open spaces. There are 15 open areas in Handan with available floor space of about 2000 m2 that were chosen through field research and big data from e-map. Table 1 shows the data for each candidate front warehouse, including capacity, coordinates and available area. The amount of fresh produce that could be accommodated in the alternative temporary front warehouses was calculated assuming that the height of the temporary front warehouses ranged from 4 to 6 meters, and the storage capacity was 1000 kg per 7 cubic meters. The distribution mode is multi-vehicle distribution, in which vehicles begin at the distribution point proceed directly to the demand point, and return to the distribution point once the task is completed.
| No. | Capacity/kg | Coordinates | Available area/m2 | Infrastructure and operating costs |
| 1 | 2714285 | 114.509175, 36.662958 | 6800 | 95520 |
| 2 | 5089285 | 114.500767, 36.654475 | 10,180 | 185,450 |
| 3 | 4571428 | 114.528543, 36.644384 | 8305 | 109,520 |
| 4 | 4007142 | 114.568266, 36.661235 | 8000 | 98,560 |
| 5 | 1600000 | 114.520637, 36.631519 | 2800 | 52,860 |
| 6 | 1714285 | 114.550461, 36.63023 | 2400 | 49,250 |
| 7 | 2857142 | 114.528071, 36.616084 | 4200 | 68,590 |
| 8 | 5714285 | 114.495117, 36.60505 | 8200 | 108,690 |
| 9 | 7000000 | 114.48475, 36.58346 | 9800 | 178,520 |
| 10 | 8571428 | 114.513137, 36.576953 | 12,000 | 205,130 |
| 11 | 8214285 | 114.47194, 36.655803 | 8200 | 90,250 |
| 12 | 3428571 | 114.475102, 36.634031 | 4800 | 75,520 |
| 13 | 1714285 | 114.45936, 36.619397 | 2400 | 60,250 |
| 14 | 3000000 | 114.451845, 36.615599 | 6300 | 85,020 |
| 15 | 6571428 | 114.438034, 36.572769 | 11,500 | 199,650 |
 DownLoad:
CSV
DownLoad:
CSV
Location of the urban distribution center is set on the west side of the city with a capacity of 40,000 tons, which is currently the largest integrated cold storage in Handan city. Its geographical coordinates are (114.455441, 36.636189).
The layout of alternative front warehouses that meet the floor area of above 2000 m2 is shown in Figure 3.

The main urban area of the city Handan is subdivided into 86 demand points based on its geographical characteristics and population distribution, and the population number of each demand point is obtained from city statistics. Assuming a daily demand for fresh food of 2 kg per person, the daily demand is then calculated using the population number, and the specific data are shown in Table 2.
| No. | Coordinate of demand point | Qty of demand/kg | No. | Coordinate of demand point | Qty of demand/kg |
| 1 | 114.548251, 36.646802 | 28,534 | 44 | 114.532801, 36.596083 | 21,816 |
| 2 | 114.534741, 36.651898 | 8076 | 45 | 114.52048, 36.597068 | 37,516 |
| 3 | 114.526908, 36.65572 | 9422 | 46 | 114.510451, 36.600835 | 13,986 |
| 4 | 114.517996, 36.656762 | 10,436 | 47 | 114.502761, 36.601994 | 29,848 |
| 5 | 114.508223, 36.656936 | 12,010 | 48 | 114.494569, 36.602863 | 30,114 |
| 6 | 114.495718, 36.658036 | 16,078 | 49 | 114.487526, 36.603558 | 28,366 |
| 7 | 114.495647, 36.647902 | 32,584 | 50 | 114.486448, 36.596663 | 24,314 |
| 8 | 114.509013, 36.643095 | 33,982 | 51 | 114.494137, 36.596489 | 14,476 |
| 9 | 114.52662, 36.645644 | 14,694 | 52 | 114.502689, 36.595561 | 20,388 |
| 10 | 114.493634, 36.63962 | 32,598 | 53 | 114.510019, 36.594808 | 15,890 |
| 11 | 114.524752, 36.636029 | 28,848 | 54 | 114.516703, 36.58484 | 20,212 |
| 12 | 114.536537, 36.635045 | 18,492 | 55 | 114.509085, 36.587216 | 30,808 |
| 13 | 114.548251, 36.634813 | 15,112 | 56 | 114.501539, 36.587796 | 38,202 |
| 14 | 114.563918, 36.625661 | 1108 | 57 | 114.488029, 36.591737 | 24,830 |
| 15 | 114.550407, 36.625545 | 28,416 | 58 | 114.503049, 36.578464 | 34,030 |
| 16 | 114.53431, 36.626704 | 42,264 | 59 | 114.492988, 36.583912 | 27,780 |
| 17 | 114.522596, 36.627804 | 27,464 | 60 | 114.482927, 36.587042 | 36,682 |
| 18 | 114.513182, 36.628036 | 21,540 | 61 | 114.482424, 36.579739 | 21,438 |
| 19 | 114.505923, 36.629137 | 33,770 | 62 | 114.477645, 36.65653 | 5954 |
| 20 | 114.496437, 36.629542 | 31,000 | 63 | 114.4821, 36.642574 | 12,912 |
| 21 | 114.488316, 36.62989 | 26,458 | 64 | 114.469847, 36.649089 | 10,232 |
| 22 | 114.481417, 36.62178 | 5156 | 65 | 114.471213, 36.63991 | 6588 |
| 23 | 114.487813, 36.621896 | 22,032 | 66 | 114.46629, 36.640518 | 24,222 |
| 24 | 114.496078, 36.620795 | 8762 | 67 | 114.458061, 36.641676 | 13,556 |
| 25 | 114.504989, 36.620621 | 33,376 | 68 | 114.451953, 36.639794 | 9786 |
| 26 | 114.512894, 36.620216 | 10,062 | 69 | 114.43661, 36.62989 | 3488 |
| 27 | 114.518787, 36.61952 | 15,458 | 70 | 114.447965, 36.632728 | 29,360 |
| 28 | 114.536753, 36.618246 | 24,286 | 71 | 114.446024, 36.626182 | 47,838 |
| 29 | 114.55206, 36.616971 | 22,704 | 72 | 114.457235, 36.631164 | 15,974 |
| 30 | 114.569595, 36.617319 | 4358 | 73 | 114.463164, 36.63212 | 24,478 |
| 31 | 114.543365, 36.609034 | 21,734 | 74 | 114.460649, 36.623662 | 61,456 |
| 32 | 114.532226, 36.609787 | 26,502 | 75 | 114.471572, 36.631946 | 32,230 |
| 33 | 114.521733, 36.612047 | 27,584 | 76 | 114.46956, 36.624705 | 19,376 |
| 34 | 114.51085, 36.611757 | 21,840 | 77 | 114.475992, 36.623054 | 29,976 |
| 35 | 114.503767, 36.612858 | 32,378 | 78 | 114.465895, 36.616479 | 46,922 |
| 36 | 114.495647, 36.614944 | 38,706 | 79 | 114.441964, 36.618796 | 10,566 |
| 37 | 114.487454, 36.613785 | 28,884 | 80 | 114.478327, 36.60689 | 20,046 |
| 38 | 114.480124, 36.615813 | 10,004 | 81 | 114.471936, 36.611062 | 22,270 |
| 39 | 114.490904, 36.608165 | 32,140 | 82 | 114.466254, 36.595619 | 26,864 |
| 40 | 114.507217, 36.606455 | 50,670 | 83 | 114.432945, 36.613032 | 4106 |
| 41 | 114.520224, 36.604601 | 20,950 | 84 | 114.428202, 36.591722 | 15,940 |
| 42 | 114.531368, 36.603298 | 30,814 | 85 | 114.462625, 36.579667 | 10,226 |
| 43 | 114.541496, 36.602631 | 21,036 | 86 | 114.435963, 36.602153 | 14,572 |
DownLoad:
CSV
Handan's urban area is divided into 86 demand areas with varying sizes and areas based on population density. High population density areas are small in order to balance the demand of each demand point, and vice versa. This can avoid the problem of overcrowded vehicles and late deliveries caused by high demand in the area, as well as reduce the number of idle and empty vehicles in low-demand areas. The layout of specific demand point numbers is depicted in Figure 4.

According to the case description, there are 86 demand points and 15 locations where front warehouses can be opened. In this paper, traffic congestion is ignored, and distance between nodes is calculated using the Euclidean distance formula when vehicles travel at a constant speed. Each vehicle is of the same type, has an on-board capacity of 2000 kg and travels at a speed of 30 km/h. Table 3 shows the parameters of the immune optimization algorithm.
| Parameter | Value | Parameter | Value |
| Population size | 80 | Crossover probability | 0.9 |
| Memory capacity | 10 | Mutation probability | 0.4 |
| Iteration number | 500 | Diversity evaluation factor | 0.95 |
DownLoad:
CSV
The model formulated in Section 3 is solved using MATLAB R2020a software by the traditional genetic algorithm and the improved immune optimization algorithm proposed in this paper. The optimal result is obtained by running in MATLAB hundreds of times. Figures 5 and 6 depict a comparison of the convergence graph results of the improved immune algorithm and the genetic algorithm.


The comparison between Figures 5 and 6 shows that the genetic algorithm obtains an optimal fitness value of 19.03 after a larger number of evolutions. The improved immune optimization algorithm in this paper, by establishing a dynamic retention mechanism to retain the best individuals and using the Metropolis criterion to select the best individuals, accelerates the convergence speed of the algorithm and can first search for the local optimum quickly and then search for the global optimum with fewer iterations. The global optimal fitness value is 13.8278, which shows the feasibility and efficiency of the algorithm in this paper.
Figures 7 and 8 show the optimal front warehouse location scheme obtained by running the genetic algorithm and the improved immune optimization algorithm, in which the blue dots indicate the front warehouses, and the green dots indicate the demand points. The blue dot with red pentagon is the selected front warehouse, and if there is a line between them, it means that the required goods of the demand point are provided by the front warehouse. The sequence of location numbers of the best front warehouses selected by the genetic algorithm is [7 12 8 3 1 2 10 11 4]. The sequence of location numbers of the best front warehouses selected by the improved immune optimization algorithm is [12 8 7 3 2 4 10].


The convergence curves and layout of location schemes show that the genetic algorithm falls into the local optimum after a dozen iterations and produces site selection results for 9 front warehouses, whereas the improved immune optimization algorithm successfully jumps out of the local optimum and achieves the global optimum solution, producing location results for 7 front warehouses. Moreover, the location cost of the immune algorithm is 851,460 yuan, and that of the genetic algorithm is 1,037,230 yuan. Consequently, the solution results show that the immune algorithm outperforms the genetic algorithm in efficiently solving location problem proposed in this paper. Table 4 shows the front warehouse selected, demand point, and total cost generated by the two algorithms.
| No. of selected front warehouses | No. of demand points it serves | Total costs/NYC | |
| Results obtained by immune algorithm | 12 | 20 21 22 23 62 63 64 65 66 67 68 69 70 71 72 73 74 75 76 77 78 79 81 82 85 |
851,460 |
| 8 | 24 25 34 35 36 37 38 39 40 46 47 48 49 50 51 52 53 57 59 60 61 80 83 84 86 |
||
| 7 | 15 16 17 18 19 26 27 28 29 30 31 32 33 41 42 43 44 45 |
||
| 3 | 1 2 3 4 9 11 12 13 | ||
| 2 | 5 6 7 8 10 | ||
| 4 | 14 | ||
| 10 | 54 55 56 58 | ||
| Results obtained by genetic algorithm | 7 | 15 16 17 18 19 26 27 28 29 30 31 32 33 41 42 43 44 45 |
1,037,230 |
| 12 | 20 21 22 23 63 65 66 67 68 69 70 71 72 73 74 75 76 77 78 79 81 83 84 86 |
||
| 8 | 24 25 34 35 36 37 38 39 40 46 47 48 49 50 51 52 53 57 59 60 61 80 82 85 |
||
| 3 | 1 2 3 9 11 12 13 | ||
| 1 | 4 5 | ||
| 2 | 6 7 8 10 | ||
| 10 | 54 55 56 58 | ||
| 11 | 62 64 | ||
| 4 | 14 |
DownLoad:
CSV
According to the location results, front warehouses 7, 8 and 12 handle the majority of the distribution tasks. These three front warehouses are located in the center urban area, which is the most densely populated area, according to maps of 86 demand points and 15 alternative front warehouses (Figures 3 and 4). Because there is less available space in the central urban area to open a front warehouse, these front warehouses are overcrowded. According to field research, traffic in Handan city's urban area is in good condition, and small and medium-sized vehicle can pass freely with less congestion; however, with more demand to meet, same-day or next-day delivery of fresh food can be satisfied; thus, the solution solves the delivery problem of fresh food to communities.
To summarize, the model can be used to aid decision-making for fresh produce e-commerce front warehouses or distribution nodes in logistics networks, particularly when the decision objective is to minimize the cost of delivery system.
This paper investigated the location of new front warehouses opened by fresh produce e-commerce platforms to meet increased demand in the epidemic and post-epidemic era, considering infrastructure and operating costs, fresh logistics distribution and transportation cost and energy consumption cost. To solve the actual case, the improved immune algorithm and the genetic algorithm were used, and it was proved that the improved immune algorithm outperforms the genetic algorithm in terms of solution accuracy and results. The managerial implications are as follows.
The results of the case study show that since the front warehouse serves the last-mile delivery, it radiates more communities in the main urban areas with large population and is more efficient to utilize. In contrast, the number of front warehouses in remote communities with less population is small, but the coverage is wider, and the utilization rate and unit distribution cost of front warehouses in remote communities are higher. Therefore, e-commerce enterprises should take into account the population distribution of the community, total demand quantity, the radiation distance of the service and the comprehensive cost to locate front warehouses. If the front warehouse unit distribution cost is too high in communities with small populations, it should consider the combination of front warehouse mode and community group purchase and customer pick-up mode to reduce distribution costs and achieve profitability.
In summary, the model has broad applicability in the decision-making process for location selection in the pursuit of managing a sustainable operation distribution system.
The following are the main limitations of this paper. For starters, the delivery time factors of fresh produce e-commerce operations are not taken into account, and the time window requirement of customer demand is not specified. As a result, future research directions include taking into account the cost of operation as well as the environmental impact of carbon emissions in model formulation, as well as meeting the customer time window to provide better customer service.
The authors declare they have not used Artificial Intelligence (AI) tools in the creation of this article.
This paper was supported by a Research Project of Philosophy and Social Science in Handan (2021113). The authors also gratefully acknowledge the helpful comments and suggestions of the reviewers, which have improved the presentation.
The authors declare no conflicts of interest.
The research data used to support the findings of this study are included within the article, and the data used are shown in Tables 1–3.
| [1] | Moon TC, Befus AD, Kulka M (2014) Mast cell mediators: Their differential release and the secretory pathways involved. Front Immunol 5: 569. https://doi.org/10.3389/fimmu.2014.00569 |
| [2] |
Theoharides TC, Kempuraj D, Tagen M, et al. (2007) Differential release of mast cell mediators and the pathogenesis of inflammation. Immunol Rev 217: 65-78. https://doi.org/10.1111/j.1600-065X.2007.00519.x 
|
| [3] |
Abraham SN, St John AL (2010) Mast cell-orchestrated immunity to pathogens. Nat Rev Immunol 10: 440-452. https://doi.org/10.1038/nri2782
|
| [4] | He Y, Li Z, Alexander PG, et al. (2020) Pathogenesis of osteoarthritis: Risk factors, regulatory pathways in chondrocytes, and experimental models. Biology (Basel) 9: 1-32. https://doi.org/10.3390/biology9080194 |
| [5] | Chow YY, Chin KY (2020) The role of inflammation in the pathogenesis of osteoarthritis. Mediators Inflamm 2020: 8293921. https://doi.org/10.1155/2020/8293921 |
| [6] |
Sokolove J, Lepus CM (2013) Role of inflammation in the pathogenesis of osteoarthritis: Latest findings and interpretations. Ther Adv Musculoskelet Dis 5: 77-94. https://doi.org/10.1177/1759720X12467868
|
| [7] |
Dean G, Hoyland JA, Denton J, et al. (1993) Mast cells in the synovium and synovial fluid in osteoarthrhis. Rheumatology 32: 671-675. https://doi.org/10.1093/rheumatology/32.8.671
|
| [8] |
Wang Q, Lepus CM, Raghu H, et al. (2019) IgE-mediated mast cell activation promotes inflammation and cartilage destruction in osteoarthritis. Elife 8: e39905. https://doi.org/10.7554/eLife.39905
|
| [9] |
Dan J, Izumi M, Habuchi H, et al. (2021) A novel mice model of acute flares in osteoarthritis elicited by intra-articular injection of cultured mast cells. J Exp Orthop 8: 75. https://doi.org/10.1186/s40634-021-00391-6
|
| [10] |
Sellam J, Berenbaum F (2013) Is osteoarthritis a metabolic disease?. Joint Bone Spine 80: 568-573. https://doi.org/10.1016/j.jbspin.2013.09.007
|
| [11] |
de Lange-Brokaar BJE, Kloppenburg M, Andersen SN, et al. (2016) Characterization of synovial mast cells in knee osteoarthritis: Association with clinical parameters. Osteoarthr Cartilage 24: 664-671. https://doi.org/10.1016/j.joca.2015.11.011
|
| [12] |
Farinelli L, Aquili A, Mattioli-Belmonte M, et al. (2022) Synovial mast cells from knee and hip osteoarthritis: histological study and clinical correlations. J Exp Orthop 9: 13. https://doi.org/10.1186/s40634-022-00446-2
|
| [13] | Ceponis A, Konttinen YT, Takagi M, et al. (1998) Expression of stem cell factor (SCF) and SCF receptor (c-kit) in synovial membrane in arthritis: correlation with synovial mast cell hyperplasia and inflammation. J Rheumatol 25: 2304-2314. |
| [14] |
Dahlin JS, Hallgren J (2015) Mast cell progenitors: Origin, development and migration to tissues. Mol Immunol 63: 9-17. https://doi.org/10.1016/j.molimm.2014.01.018
|
| [15] |
Gözel N, Çakirer M, Karataş A, et al. (2018) Sorafenib reveals anti-arthritic potentials in collagen induced experimental arthritis model. Arch Rheumatol 33: 309. https://doi.org/10.5606/ArchRheumatol.2018.6652
|
| [16] |
Kulkarni P, Harsulkar A, Märtson AG, et al. (2022) Mast cells differentiated in synovial fluid and resident in osteophytes exalt the inflammatory pathology of osteoarthritis. Int J Mol Sci 2022: 541. https://doi.org/10.3390/ijms23010541
|
| [17] | Aquili A, Farinelli L, Bottegoni C, et al. (2017) The effect of anti-IgE therapy in knee osteoarthritis: a pilot observational study. J Biol Regul Homeost Agents 31: 1-5. |
| [18] |
Theoharides TC, Alysandratos KD, Angelidou A, et al. (2012) Mast cells and inflammation. Biochim Biophys Acta Mol Cell Res 1822: 21-33. https://doi.org/10.1016/j.bbadis.2010.12.014
|
| [19] | Bax HJ, Keeble AH, Gould HJ (2012) Cytokinergic IgE action in mast cell activation. Front Immunol 3: 229. https://doi.org/10.3389/fimmu.2012.00229 |
| [20] |
Park S, Choi NK (2020) Association between serum immunoglobulin E levels and knee osteoarthritis in Korean adults. Osteoarthr Cartilage 28: 462-467. https://doi.org/10.1016/j.joca.2020.02.830
|
| [21] |
Nishioka M, Ioi H, Matsumoto R, et al. (2008) TMJ osteoarthritis/osteoarthrosis and immune system factors in a Japanese sample. Angle Orthod 78: 793-798. https://doi.org/10.2319/091407-438
|
| [22] |
Riegger J, Brenner RE (2020) Pathomechanisms of posttraumatic osteoarthritis: chondrocyte behavior and fate in a precarious environment. Int J Mol Sci 21: 1560. https://doi.org/10.3390/ijms21051560
|
| [23] |
Foell D, Wittkowski H, Roth J (2007) Mechanisms of disease: A ‘DAMP’ view of inflammatory arthritis. Nat Clin Pract Rheumatol 3: 382-390. https://doi.org/10.1038/ncprheum0531
|
| [24] |
Sandig H, Bulfone-Paus S (2012) TLR signaling in mast cells: common and unique features. Front Immunol 3: 185. https://doi.org/10.3389/fimmu.2012.00185
|
| [25] |
Gondokaryono SP, Ushio H, Niyonsaba F, et al. (2007) The extra domain A of fibronectin stimulates murine mast cells via Toll-like receptor 4. J Leukocyte Biol 82: 657-665. https://doi.org/10.1189/jlb.1206730
|
| [26] |
Park H, Hong J, Yin Y, et al. (2020) TAP2, a peptide antagonist of Toll-like receptor 4, attenuates pain and cartilage degradation in a monoiodoacetate-induced arthritis rat model. Sci Rep 10: 1-13. https://doi.org/10.1038/s41598-020-74544-5
|
| [27] |
Flannery CR, Zollner R, Corcoran C, et al. (2009) Prevention of cartilage degeneration in a rat model of osteoarthritis by intraarticular treatment with recombinant lubricin. Arthritis Rheum 60: 840-847. https://doi.org/10.1002/art.24304
|
| [28] |
Alquraini A, Garguilo S, D'Souza G, et al. (2015) The interaction of lubricin/proteoglycan 4 (PRG4) with Toll-like receptors 2 and 4: an anti-inflammatory role of PRG4 in synovial fluid. Arthritis Res Ther 17: 1-12. https://doi.org/10.1186/s13075-015-0877-x
|
| [29] |
Sick E, Brehin S, André P, et al. (2010) Advanced glycation end products (AGEs) activate mast cells. Brit J Pharmacol 161: 442-455. https://doi.org/10.1111/j.1476-5381.2010.00905.x
|
| [30] |
Swanson KV, Deng M, Ting JPY (2019) The NLRP3 inflammasome: molecular activation and regulation to therapeutics. Nat Rev Immunol 2019 198 19: 477-489. https://doi.org/10.1038/s41577-019-0165-0
|
| [31] |
McAllister MJ, Chemaly M, Eakin AJ, et al. (2018) NLRP3 as a potentially novel biomarker for the management of osteoarthritis. Osteoarthr Cartilage 26: 612-619. https://doi.org/10.1016/j.joca.2018.02.901
|
| [32] | Guo X, Xu X, Li T, et al. (2021) NLRP3 inflammasome activation of mast cells by estrogen via the nuclear-initiated signaling pathway contributes to the development of endometriosis. Front Immunol 12: 3909. https://doi.org/10.3389/fimmu.2021.749979 |
| [33] |
Wang Q, Rozelle AL, Lepus CM, et al. (2011) Identification of a central role for complement in osteoarthritis. Nat Med 17: 1674. https://doi.org/10.1038/nm.2543
|
| [34] |
Gaudenzio N, Sibilano R, Marichal T, et al. (2016) Different activation signals induce distinct mast cell degranulation strategies. J Clin Invest 126: 3981. https://doi.org/10.1172/JCI85538
|
| [35] |
Elieh Ali Komi D, Shafaghat F, Kovanen PT, et al. (2020) Mast cells and complement system: Ancient interactions between components of innate immunity. Allergy 75: 2818-2828. https://doi.org/10.1111/all.14413
|
| [36] |
Schäfer B, Piliponsky AM, Oka T, et al. (2013) Mast cell anaphylatoxin receptor expression can enhance IgE-dependent skin inflammation in mice. J Allergy Clin Immunol 131: 541-548. https://doi.org/10.1016/j.jaci.2012.05.009
|
| [37] |
Lubbers R, van Essen MF, van Kooten C, et al. (2017) Production of complement components by cells of the immune system. Clin Exp Immunol 188: 183-194. https://doi.org/10.1111/cei.12952
|
| [38] |
Bollmann M, Colombo F, Marco P, et al. (2018) Inhibition of the complement system component C5 as possible treatment in OA. Osteoarthr Cartilage 26: S108. https://doi.org/10.1016/j.joca.2018.02.236
|
| [39] |
Yu C, Zang H, Yang C, et al. (2021) Study of chondroitin sulfate E oligosaccharide as a promising complement C5 inhibitor for osteoarthritis alleviation. Mat Sci Eng C-Bio S 127: 112234. https://doi.org/10.1016/j.msec.2021.112234
|
| [40] |
Sousa-Valente J, Calvo L, Vacca V, et al. (2018) Role of TrkA signalling and mast cells in the initiation of osteoarthritis pain in the monoiodoacetate model. Osteoarthr Cartilage 26: 84-94. https://doi.org/10.1016/j.joca.2017.08.006
|
| [41] |
Obara I, Telezhkin V, Alrashdi I, et al. (2020) Histamine, histamine receptors, and neuropathic pain relief. Brit J Pharmacol 177: 580. https://doi.org/10.1111/bph.14696
|
| [42] |
Miller RE, Block JA, Malfait AM (2017) Nerve growth factor blockade for the management of osteoarthritis pain: what can we learn from clinical trials and preclinical models?. Curr Opin Rheumatol 29: 110-118. https://doi.org/10.1097/BOR.0000000000000354
|
| [43] |
Nwosu LN, Mapp PI, Chapman V, et al. (2016) Extended report: Blocking the tropomyosin receptor kinase A (TrkA) receptor inhibits pain behaviour in two rat models of osteoarthritis. Ann Rheum Dis 75: 1246. https://doi.org/10.1136/annrheumdis-2014-207203
|
| [44] |
Okamura Y, Mishima S, Kashiwakura J, et al. (2017) The dual regulation of substance P-mediated inflammation via human synovial mast cells in rheumatoid arthritis. Allergol Int 66: S9-S20. https://doi.org/10.1016/j.alit.2017.03.002
|
| [45] |
Henry CH, Wolford LM (2001) Substance P and mast cells: Preliminary histologic analysis of the human temporomandibular joint. Oral Surg Oral Med O 92: 384-389. https://doi.org/10.1067/moe.2001.117811
|
| [46] |
Green DP, Limjunyawong N, Gour N, et al. (2019) A mast-cell-specific receptor mediates neurogenic inflammation and pain. Neuron 101: 412-420. https://doi.org/10.1016/j.neuron.2019.01.012
|
| [47] |
Ko KR, Lee H, Han SH, et al. (2022) Substance P, a promising therapeutic target in musculoskeletal disorders. Int J Mol Sci 23: 2583. https://doi.org/10.3390/ijms23052583
|
| [48] |
Ogasawara H, Noguchi M (2021) Therapeutic potential of MRGPRX2 inhibitors on mast cells. Cells 10: 2096. https://doi.org/10.3390/cells10112906
|
| [49] |
Thangam EB, Jemima EA, Singh H, et al. (2018) The role of histamine and histamine receptors in mast cell-mediated allergy and inflammation: The hunt for new therapeutic targets. Front Immunol 9: 1873. https://doi.org/10.3389/fimmu.2018.01873
|
| [50] |
Shirinsky I, Shirinsky V (2018) H1-antihistamines are associated with lower prevalence of radiographic knee osteoarthritis: a cross-sectional analysis of the Osteoarthritis Initiative data. Arthritis Res Ther 20: 1-6. https://doi.org/10.1186/s13075-018-1619-7
|
| [51] |
Bihlet AR, Miller CP, Byrjalsen I, et al. (2022) OP0230 antihistamine use and structural progression of knee OA: a post-hoc analysis of two phase III clinical trials. Ann Rheum Dis 81: 152. https://doi.org/10.1136/annrheumdis-2022-eular.4425
|
| [52] |
Sommer C (2010) Serotonin in pain and pain control. Handbook of Behavioral Neuroscience . Amsterdam: Elsevier 457-471. https://doi.org/10.1016/S1569-7339(10)70096-5
|
| [53] |
Harbuz MS, Perveen-Gill Z, Lalies MD, et al. (1996) The role of endogenous serotonin in adjuvant-induced arthritis in the rat. Rheumatology 35: 112-116. https://doi.org/10.1093/rheumatology/35.2.112
|
| [54] |
Kopp S, Alstergren P (2002) Blood serotonin and joint pain in seropositive versus seronegative rheumatoid arthritis. Mediators Inflamm 11: 211. https://doi.org/10.1080/09629350290000069
|
| [55] |
Wan M, Ding L, Wang D, et al. (2020) Serotonin: A potent immune cell modulator in autoimmune diseases. Front Immunol 11: 186. https://doi.org/10.3389/fimmu.2020.00186
|
| [56] |
Seidel MF, Fiebich BL, Ulrich-Merzenich G, et al. (2008) Serotonin mediates PGE2 overexpression through 5-HT2A and 5-HT3 receptor subtypes in serum-free tissue culture of macrophage-like synovial cells. Rheumatol Int 28: 1017-1022. https://doi.org/10.1007/s00296-008-0564-1
|
| [57] |
Stevens RL, Adachi R (2007) Protease-proteoglycan complexes of mouse and human mast cells and importance of their β-tryptase-heparin complexes in inflammation and innate immunity. Immunol Rev 217: 155-167. https://doi.org/10.1111/j.1600-065X.2007.00525.x
|
| [58] |
So AK, Varisco PA, Kemkes-Matthes B, et al. (2003) Arthritis is linked to local and systemic activation of coagulation and fibrinolysis pathways. J Thromb Haemost 1: 2510-2515. https://doi.org/10.1111/j.1538-7836.2003.00462.x
|
| [59] | Chou PY, Su CM, Huang CY, et al. (2014) The characteristics of thrombin in osteoarthritic pathogenesis and treatment. Biomed Res Int 2014: 1-9. https://doi.org/10.1155/2014/407518 |
| [60] | Migliore A, Procopio S (2015) Effectiveness and utility of hyaluronic acid in osteoarthritis. Clin Cases Miner Bone Metab 12: 31. https://doi.org/10.11138/ccmbm/2015.12.1.031 |
| [61] |
Bishnoi M, Jain A, Hurkat P, et al. (2016) Chondroitin sulphate: a focus on osteoarthritis. Glycoconj J 33: 693-705. https://doi.org/10.1007/s10719-016-9665-3
|
| [62] |
Takano H, Furuta K, Yamashita K, et al. (2012) Restriction of mast cell proliferation through hyaluronan synthesis by co-cultured fibroblasts. Biol Pharm Bull 35: 408-412. https://doi.org/10.1248/bpb.35.408
|
| [63] |
Theoharides TC, Patra P, Boucher W, et al. (2000) Chondroitin sulphate inhibits connective tissue mast cells. Brit J Pharmacol 131: 1039. https://doi.org/10.1038/sj.bjp.0703672
|
| [64] | Crivellato E, Beltrami CA, Mallardi F, et al. (2004) The mast cell: an active participant or an innocent bystander?. Histol Histopathol 19: 259-270. |
| [65] |
Buckley MG, Gallagher PJ, Walls AF (1998) Mast cell subpopulations in the synovial tissue of patients with osteoarthritis: selective increase in numbers of tryptase-positive, chymase-negative mast cells. J Pathol 186: 67-74. https://doi.org/10.1002/(SICI)1096-9896(199809)186:1<67::AID-PATH132>3.0.CO;2-D
|
| [66] |
Takata K, Uchida K, Mukai M, et al. (2020) Increase in tryptase and its role in the synovial membrane of overweight and obese patients with osteoarthritis of the knee. Diabetes Metab Syndr Obes 13: 1491-1497. https://doi.org/10.2147/DMSO.S253147
|
| [67] |
Marquardt U, Zettl F, Huber R, et al. (2002) The crystal structure of human α1-tryptase reveals a blocked substrate-binding region. J Mol Biol 321: 491-502. https://doi.org/10.1016/S0022-2836(02)00625-3
|
| [68] |
Buckley MG, Walters C, Wong WM, et al. (1997) Mast cell activation in arthritis: Detection of α- and β-tryptase, histamine and eosinophil cationic protein in synovial fluid. Clin Sci 93: 363-370. https://doi.org/10.1042/cs0930363
|
| [69] |
Nakano S, Mishiro T, Takahara S, et al. (2007) Distinct expression of mast cell tryptase and protease activated receptor-2 in synovia of rheumatoid arthritis and osteoarthritis. Clin Rheumatol 26: 1284-1292. https://doi.org/10.1007/s10067-006-0495-8
|
| [70] |
Xiang Y, Masuko-Hongo K, Sekine T, et al. (2006) Expression of proteinase-activated receptors (PAR)-2 in articular chondrocytes is modulated by IL-1β, TNF-α and TGF-β. Osteoarthr Cartilage 14: 1163-1173. https://doi.org/10.1016/j.joca.2006.04.015
|
| [71] |
Huang X, Ni B, Xi Y, et al. (2019) Protease-activated receptor 2 (PAR-2) antagonist AZ3451 as a novel therapeutic agent for osteoarthritis. Aging 11: 12532. https://doi.org/10.18632/aging.102586
|
| [72] |
Ferrell WR, Kelso EB, Lockhart JC, et al. (2010) Protease-activated receptor 2: a novel pathogenic pathway in a murine model of osteoarthritis. Ann Rheum Dis 69: 2051-2054. https://doi.org/10.1136/ard.2010.130336
|
| [73] |
Lucena F, McDougall JJ (2021) Protease activated receptors and arthritis. Int J Mol Sci 22: 9352. https://doi.org/10.3390/ijms22179352
|
| [74] |
Smith RL (1999) Degradative enzymes in osteoarthritis. Front Biosci 4: 704-712. https://doi.org/10.2741/A388
|
| [75] |
Meszaros E, Malemud CJ (2012) Prospects for treating osteoarthritis: enzyme–protein interactions regulating matrix metalloproteinase activity. Ther Adv Chronic Dis 3: 219. https://doi.org/10.1177/2040622312454157
|
| [76] | Crofford LJ, Sano H, Karalis K, et al. (1993) Corticotropin-releasing hormone in synovial fluids and tissues of patients with rheumatoid arthritis and osteoarthritis. J Immunol 151: 1587-1596. |
| [77] |
Zhao Z, Li E, Cao Q, et al. (2016) Endothelin-1 concentrations are correlated with the severity of knee osteoarthritis. J Invest Med 64: 872-874. https://doi.org/10.1136/jim-2015-000030
|
| [78] |
De Falco L, Fioravanti A, Galeazzi M, et al. (2013) Bradykinin and its role in osteoarthritis. Reumatismo 65: 97-104. https://doi.org/10.4081/reumatismo.2013.97
|
| [79] |
Roy-Beaudry M, Martel-Pelletier J, Pelletier JP, et al. (2003) Endothelin 1 promotes osteoarthritic cartilage degradation via matrix metalloprotease 1 and matrix metalloprotease 13 induction. Arthritis Rheum 48: 2855-2864. https://doi.org/10.1002/art.11247
|
| [80] |
Sin A, Tang W, Wen CY, et al. (2015) The emerging role of endothelin-1 in the pathogenesis of subchondral bone disturbance and osteoarthritis. Osteoarthr Cartilage 23: 516-524. https://doi.org/10.1016/j.joca.2014.11.002
|
| [81] |
Khatib AM, Siegfried G, Messai H, et al. (2002) Mechanism of inhibition of endothelin-1-stimulated proteoglycan and collagen synthesis in rat articular chondrocytes. Cytokine 17: 254-261. https://doi.org/10.1006/cyto.2001.1001
|
| [82] |
Au M, Liu Z, Rong L, et al. (2020) Endothelin-1 induces chondrocyte senescence and cartilage damage via endothelin receptor type B in a post-traumatic osteoarthritis mouse model. Osteoarthr Cartilage 28: 1559-1571. https://doi.org/10.1016/j.joca.2020.08.006
|
| [83] |
Tenti S, Pascarelli NA, Cheleschi S, et al. (2016) The emerging role of bradykinin in the pathogenesis of osteoarthritis and its possible clinical implications. Curr Rheumatol Rev 12: 177-184. https://doi.org/10.2174/1573397112666160331143305
|
| [84] |
Montjean R, Escaich S, Carelli C, et al. (2019) Chimeric peptide combining both growth hormone and somatostatin sequences (REG-O3) improves function and prevents cartilage degradation in rat model of osteoarthritis. Osteoarthr Cartilage 27: S428. https://doi.org/10.1016/j.joca.2019.02.449
|
| [85] | Silveri F, Morosini P, Brecciaroli D, et al. (1994) Intra-articular injection of somatostatin in knee osteoarthritis: clinical results and IGF-1 serum levels. Int J Clin Pharmacol Res 14: 79-85. |
| [86] |
Intekhab-Alam NY, White OB, Getting SJ, et al. (2013) Urocortin protects chondrocytes from NO-induced apoptosis: a future therapy for osteoarthritis?. Cell Death Discov 4: e717. https://doi.org/10.1038/cddis.2013.231
|
| [87] |
Lawrence KM, Jones RC, Jackson TR, et al. (2017) Chondroprotection by urocortin involves blockade of the mechanosensitive ion channel Piezo1. Sci Rep 7: 1-12. https://doi.org/10.1038/s41598-017-04367-4
|
| [88] |
Jiang W, Wang H, Li YS, et al. (2016) Role of vasoactive intestinal peptide in osteoarthritis. J Biomed Sci 23: 1-6. https://doi.org/10.1186/s12929-016-0280-1
|
| [89] | Caughey GH, Leidig F, Viro NF, et al. (1988) Substance P and vasoactive intestinal peptide degradation by mast cell tryptase and chymase. J Pharmacol Exp Ther 244: 133-137. |
| [90] |
Vincent TL (2019) IL-1 in osteoarthritis: Time for a critical review of the literature. F1000Research 8: 1-8. https://doi.org/10.12688/f1000research.18831.1
|
| [91] | Florián AM (2011) IL-1 and its role in osteoarthritis. Open J Med 1: 1-6. |
| [92] | Li H, Xie S, Qi Y, et al. (2018) TNF-αincreases the expression of inflammatory factors in synovial fibroblasts by inhibiting the PI3K/AKT pathway in a rat model of monosodium iodoacetate-induced osteoarthritis. Exp Ther Med 16: 4737-4744. https://doi.org/10.3892/etm.2018.6770 |
| [93] |
Hu G, Zhao X, Wang C, et al. (2017) MicroRNA-145 attenuates TNF-α-driven cartilage matrix degradation in osteoarthritis via direct suppression of MKK4. Cell Death Discov 8: e3140-e3140. https://doi.org/10.1038/cddis.2017.522
|
| [94] |
Chisari E, Yaghmour KM, Khan WS (2020) The effects of TNF-alpha inhibition on cartilage: a systematic review of preclinical studies. Osteoarthr Cartilage 28: 708-718. https://doi.org/10.1016/j.joca.2019.09.008
|
| [95] |
Suurmond J, Dorjée AL, Boon MR, et al. (2011) Mast cells are the main interleukin 17-positive cells in anticitrullinated protein antibody-positive and -negative rheumatoid arthritis and osteoarthritis synovium. Arthritis Res Ther 13: R150. https://doi.org/10.1186/ar3466
|
| [96] |
Mohamed SA, Neseem NO, Metwally SS, et al. (2018) IL-17 in primary knee osteoarthritis and its relation with severity of the disease. Int J Clin Rheumtol 13: 364-369. https://doi.org/10.4172/1758-4272.1000212
|
| [97] |
Na HS, Park JS, Cho KH, et al. (2020) Interleukin-1-interleukin-17 signaling axis induces cartilage destruction and promotes experimental osteoarthritis. Front Immunol 11: 730. https://doi.org/10.3389/fimmu.2020.00730
|
| [98] |
Liao Y, Ren Y, Luo X, et al. (2022) Interleukin-6 signaling mediates cartilage degradation and pain in posttraumatic osteoarthritis in a sex-specific manner. Sci Signal 15: eabn7082. https://doi.org/10.1126/scisignal.abn7082
|
| [99] |
Wiegertjes R, van de Loo FAJ, Davidson ENB (2020) A roadmap to target interleukin-6 in osteoarthritis. Rheumatology 59: 2681-2694. https://doi.org/10.1093/rheumatology/keaa248
|
| [100] |
Ahmad R, El Mabrouk M, Sylvester J, et al. (2009) Human osteoarthritic chondrocytes are impaired in matrix metalloproteinase-13 inhibition by IFN-γ due to reduced IFN-γ receptor levels. Osteoarthr Cartilage 17: 1049-1055. https://doi.org/10.1016/j.joca.2009.02.008
|
| [101] |
Henrotin YE, Zheng SX, Labasse AH, et al. (2000) Modulation of human chondrocyte metabolism by recombinant human interferon. Osteoarthr Cartilage 8: 474-482. https://doi.org/10.1053/joca.1999.0323
|
| [102] |
Kour S, Garimella MG, Shiroor DA, et al. (2016) IL-3 decreases cartilage degeneration by downregulating matrix metalloproteinases and reduces joint destruction in osteoarthritic mice. J Immunol 196: 5024-5035. https://doi.org/10.4049/jimmunol.1500907
|
| [103] |
van Helvoort EM, van der Heijden E, van Roon JAG, et al. (2022) The role of interleukin-4 and interleukin-10 in osteoarthritic joint disease: A systematic narrative review. Cartilage 13: 194760352210981. https://doi.org/10.1177/19476035221098167
|
| [104] |
Jovanovic D, Pelletier JP, Alaaeddine N, et al. (1998) Effect of IL-13 on cytokines, cytokine receptors and inhibitors on human osteoarthritis synovium and synovial fibroblasts. Osteoarthr Cartilage 6: 40-49. https://doi.org/10.1053/joca.1997.0091
|
| [105] |
Yang CY, Chanalaris A, Bonelli S, et al. (2020) Interleukin 13 (IL-13)-regulated expression of the chondroprotective metalloproteinase ADAM15 is reduced in aging cartilage. Osteoarthr Cartil Open 2: 100128. https://doi.org/10.1016/j.ocarto.2020.100128
|
| [106] | Cook AD, Pobjoy J, Steidl S, et al. (2012) Granulocyte-macrophage colony-stimulating factor is a key mediator in experimental osteoarthritis pain and disease development. Arthritis Res Ther 14: 1-9. https://doi.org/10.1186/ar4037 |
| [107] |
Lee KMC, Prasad V, Achuthan A, et al. (2020) Targeting GM-CSF for collagenase-induced osteoarthritis pain and disease in mice. Osteoarthr Cartilage 28: 486-491. https://doi.org/10.1016/j.joca.2020.01.012
|
| [108] |
Tewari D, Cook AD, Lee MC, et al. (2020) Granulocyte-macrophage colony stimulating factor as an indirect mediator of nociceptor activation and pain. J Neurosci 40: 2189-2199. https://doi.org/10.1523/JNEUROSCI.2268-19.2020
|
| [109] |
Honsawek S, Yuktanandana P, Tanavalee A, et al. (2012) Correlation between plasma and synovial fluid basic fibroblast growth factor with radiographic severity in primary knee osteoarthritis. Int Orthop 36: 981. https://doi.org/10.1007/s00264-011-1435-z
|
| [110] |
Takata K, Uchida K, Takano S, et al. (2021) Possible regulation of bFGF expression by mast cells in osteoarthritis patients with obesity: A cross-sectional study. Diabetes Metab Syndr Obes 14: 3291-3297. https://doi.org/10.2147/DMSO.S319537
|
| [111] |
El-Fetiany AE, Kassem EM, El-Barbary AM, et al. (2017) Evaluation of plasma basic fibroblast growth factor (bFGF) in primary knee osteoarthritis patients. Egypt Rheumatol 39: 33-37. https://doi.org/10.1016/j.ejr.2016.03.006
|
| [112] | Im HJ, Sharrocks AD, Lin X, et al. (2009) Basic fibroblast growth factor induces matrix metalloproteinase-13 via eRK MAP kinase-altered phosphorylation and sumoylation of Elk-1 in human adult articular chondrocytes. Open Access Rheumatol Res Rev 1: 151-161. https://doi.org/10.2147/OARRR.S7527 |
| [113] |
Li X, Su G, Wang J, et al. (2013) Exogenous bFGF promotes articular cartilage repair via up-regulation of multiple growth factors. Osteoarthr Cartilage 21: 1567-1575. https://doi.org/10.1016/j.joca.2013.06.006
|
| [114] |
Chuma H, Mizuta H, Kudo S, et al. (2004) One day exposure to FGF-2 was sufficient for the regenerative repair of full-thickness defects of articular cartilage in rabbits. Osteoarthr Cartilage 12: 834-842. https://doi.org/10.1016/j.joca.2004.07.003
|
| [115] |
Khan SN, Muhammad H, Scammahorn JJ, et al. (2018) Fibroblast growth factor 2 promotes regeneration of cartilage by attracting mesenchymal stem cells to the site of cartilage injury. Osteoarthr Cartilage 26: S37. https://doi.org/10.1016/j.joca.2018.02.090
|
| [116] |
Vincent TL (2011) Fibroblast growth factor 2: Good or bad guy in the joint?. Arthritis Res Ther 13: 1-2. https://doi.org/10.1186/ar3447
|
| [117] |
Murata M, Yudoh K, Masuko K (2008) The potential role of vascular endothelial growth factor (VEGF) in cartilage: How the angiogenic factor could be involved in the pathogenesis of osteoarthritis?. Osteoarthr Cartilage 16: 279-286. https://doi.org/10.1016/j.joca.2007.09.003
|
| [118] |
Hamilton JL, Nagao M, Levine BR, et al. (2016) Targeting VEGF and its receptors for the treatment of osteoarthritis and associated pain. J Bone Miner Res 31: 911-924. https://doi.org/10.1002/jbmr.2828
|
| [119] |
Wang B, Wu L, Chen J, et al. (2021) Metabolism pathways of arachidonic acids: mechanisms and potential therapeutic targets. Signal Transduct Target Ther 6: 1-30. https://doi.org/10.1038/s41392-020-00443-w
|
| [120] |
Theoharides TC, Kalogeromitros D (2006) The critical role of mast cells in allergy and inflammation. Ann NY Acad Sci 1088: 78-99. https://doi.org/10.1196/annals.1366.025
|
| [121] |
Miyabe Y, Miyabe C, Luster AD (2017) LTB4 and BLT1 in inflammatory arthritis. Semin Immunol 33: 52-57. https://doi.org/10.1016/j.smim.2017.09.009
|
| [122] |
Wittenberg RH, Willburger RE, Kleemeyer KS, et al. (1993) In vitro release of prostaglandins and leukotrienes from synovial tissue, cartilage, and bone in degenerative joint diseases. Arthritis Rheum 36: 1444-1450. https://doi.org/10.1002/art.1780361017
|
| [123] |
Hansen AK, Indrevik JT, Figenschau Y, et al. (2015) Human articular chondrocytes express functional leukotriene B4 receptors. J Anat 226: 268-277. https://doi.org/10.1111/joa.12275
|
| [124] | He W, Pelletier JP, Martel-Pelletier J, et al. (2002) Synthesis of interleukin 1beta, tumor necrosis factor-alpha, and interstitial collagenase (MMP-1) is eicosanoid dependent in human osteoarthritis synovial membrane explants: interactions with antiinflammatory cytokines. J Rheumatol 29: 546-553. |
| [125] |
Mishima S, Kashiwakura J, Toyoshima S, et al. (2021) Higher PGD2 production by synovial mast cells from rheumatoid arthritis patients compared with osteoarthritis patients via miR-199a-3p/prostaglandin synthetase 2 axis. Sci Rep 11: 1-14. https://doi.org/10.1038/s41598-021-84963-7
|
| [126] | Zayed N, Chabane N, Elmansouri FE, et al. (2010) Prostaglandin D2 enhances interleukin-1β-induced cyclooxygenase-2 expression in osteoarthritic cartilage. J Transl Med 25: 945. https://doi.org/10.1096/fasebj.25.1_supplement.945.15 |
| [127] |
Zayed N, Afif H, Chabane N, et al. (2008) Prostaglandin D2 inhibits interleukin-1β-induced matrix metalloproteinase-1 and -13 production by human osteoarthritic chondrocytes. Arthritis Rheum 58: 3530. https://doi.org/10.1002/art.23958
|
| [128] |
Dave M, Amin AR (2013) Yin-Yang regulation of prostaglandins and nitric oxide by PGD2 in human arthritis: Reversal by celecoxib. Immunol Lett 152: 47-54. https://doi.org/10.1016/j.imlet.2013.04.002
|
| [129] |
Fahmi H, Ouhaddi Y (2017) Deletion of the prostaglandin D2 receptor DP1 exacerbates aging-associated and instability-induced osteoarthritis. Osteoarthr Cartilage 25: S153-S154. https://doi.org/10.1016/j.joca.2017.02.255
|
| [130] |
Timur UT, Caron MMJ, Jeuken RM, et al. (2020) Chondroprotective actions of selective COX-2 inhibitors in vivo: A systematic review. Int J Mol Sci 21: 1-15. https://doi.org/10.3390/ijms21186962
|
| [131] |
McCabe PS, Maricar N, Parkes MJ, et al. (2016) The efficacy of intra-articular steroids in hip osteoarthritis: a systematic review. Osteoarthr Cartilage 24: 1509-1517. https://doi.org/10.1016/j.joca.2016.04.018
|
| [132] | Pelletier JP, Lascau-Coman V, Jovanovic D, et al. (1999) Selective inhibition of inducible nitric oxide synthase in experimental osteoarthritis is associated with reduction in tissue levels of catabolic factors. J Rheumatol 26: 2002-2014. |
| [133] |
Abramson SB (2008) Osteoarthritis and nitric oxide. Osteoarthr Cartilage 16: S15-S20. https://doi.org/10.1016/S1063-4584(08)60008-4
|
| [134] | Shang X, Wang Y, Cai D, et al. (2022) An inducible nitric oxide synthase dimerization inhibitor prevents the progression of osteoarthritis. Front Pharmacol 13: 2627. https://doi.org/10.3389/fphar.2022.861183 |
| [135] |
Han Y, Yang J, Zhao W, et al. (2021) Biomimetic injectable hydrogel microspheres with enhanced lubrication and controllable drug release for the treatment of osteoarthritis. Bioact Mater 6: 3596-3607. https://doi.org/10.1016/j.bioactmat.2021.03.022
|
| [136] |
Huang H, Lou Z, Zheng S, et al. (2022) Intra-articular drug delivery systems for osteoarthritis therapy: shifting from sustained release to enhancing penetration into cartilage. Drug Deliv 29: 767. https://doi.org/10.1080/10717544.2022.2048130
|
| 1. | Lijun Sun, Yufu Ning, Shuai Wang, Fengming Liu, 2024, Research on the Siting Selection Problem of Preposition Warehouse Based on Uncertainty Theory, 979-8-3503-6326-5, 737, 10.1109/ICMTIM62047.2024.10629585 | |
| 2. | Param Iyer, David Robb, Cold chain optimisation models: A systematic literature review, 2025, 03608352, 110972, 10.1016/j.cie.2025.110972 |
Figures(1)

Anastasiia D. Kurenkova, Peter S. Timashev. Mast cells: A dark horse in osteoarthritis treatment[J]. AIMS Allergy and Immunology, 2022, 6(4): 228-247. doi: 10.3934/Allergy.2022017

| No. | Capacity/kg | Coordinates | Available area/m2 | Infrastructure and operating costs |
| 1 | 2714285 | 114.509175, 36.662958 | 6800 | 95520 |
| 2 | 5089285 | 114.500767, 36.654475 | 10,180 | 185,450 |
| 3 | 4571428 | 114.528543, 36.644384 | 8305 | 109,520 |
| 4 | 4007142 | 114.568266, 36.661235 | 8000 | 98,560 |
| 5 | 1600000 | 114.520637, 36.631519 | 2800 | 52,860 |
| 6 | 1714285 | 114.550461, 36.63023 | 2400 | 49,250 |
| 7 | 2857142 | 114.528071, 36.616084 | 4200 | 68,590 |
| 8 | 5714285 | 114.495117, 36.60505 | 8200 | 108,690 |
| 9 | 7000000 | 114.48475, 36.58346 | 9800 | 178,520 |
| 10 | 8571428 | 114.513137, 36.576953 | 12,000 | 205,130 |
| 11 | 8214285 | 114.47194, 36.655803 | 8200 | 90,250 |
| 12 | 3428571 | 114.475102, 36.634031 | 4800 | 75,520 |
| 13 | 1714285 | 114.45936, 36.619397 | 2400 | 60,250 |
| 14 | 3000000 | 114.451845, 36.615599 | 6300 | 85,020 |
| 15 | 6571428 | 114.438034, 36.572769 | 11,500 | 199,650 |
DownLoad:
CSV
| No. | Coordinate of demand point | Qty of demand/kg | No. | Coordinate of demand point | Qty of demand/kg |
| 1 | 114.548251, 36.646802 | 28,534 | 44 | 114.532801, 36.596083 | 21,816 |
| 2 | 114.534741, 36.651898 | 8076 | 45 | 114.52048, 36.597068 | 37,516 |
| 3 | 114.526908, 36.65572 | 9422 | 46 | 114.510451, 36.600835 | 13,986 |
| 4 | 114.517996, 36.656762 | 10,436 | 47 | 114.502761, 36.601994 | 29,848 |
| 5 | 114.508223, 36.656936 | 12,010 | 48 | 114.494569, 36.602863 | 30,114 |
| 6 | 114.495718, 36.658036 | 16,078 | 49 | 114.487526, 36.603558 | 28,366 |
| 7 | 114.495647, 36.647902 | 32,584 | 50 | 114.486448, 36.596663 | 24,314 |
| 8 | 114.509013, 36.643095 | 33,982 | 51 | 114.494137, 36.596489 | 14,476 |
| 9 | 114.52662, 36.645644 | 14,694 | 52 | 114.502689, 36.595561 | 20,388 |
| 10 | 114.493634, 36.63962 | 32,598 | 53 | 114.510019, 36.594808 | 15,890 |
| 11 | 114.524752, 36.636029 | 28,848 | 54 | 114.516703, 36.58484 | 20,212 |
| 12 | 114.536537, 36.635045 | 18,492 | 55 | 114.509085, 36.587216 | 30,808 |
| 13 | 114.548251, 36.634813 | 15,112 | 56 | 114.501539, 36.587796 | 38,202 |
| 14 | 114.563918, 36.625661 | 1108 | 57 | 114.488029, 36.591737 | 24,830 |
| 15 | 114.550407, 36.625545 | 28,416 | 58 | 114.503049, 36.578464 | 34,030 |
| 16 | 114.53431, 36.626704 | 42,264 | 59 | 114.492988, 36.583912 | 27,780 |
| 17 | 114.522596, 36.627804 | 27,464 | 60 | 114.482927, 36.587042 | 36,682 |
| 18 | 114.513182, 36.628036 | 21,540 | 61 | 114.482424, 36.579739 | 21,438 |
| 19 | 114.505923, 36.629137 | 33,770 | 62 | 114.477645, 36.65653 | 5954 |
| 20 | 114.496437, 36.629542 | 31,000 | 63 | 114.4821, 36.642574 | 12,912 |
| 21 | 114.488316, 36.62989 | 26,458 | 64 | 114.469847, 36.649089 | 10,232 |
| 22 | 114.481417, 36.62178 | 5156 | 65 | 114.471213, 36.63991 | 6588 |
| 23 | 114.487813, 36.621896 | 22,032 | 66 | 114.46629, 36.640518 | 24,222 |
| 24 | 114.496078, 36.620795 | 8762 | 67 | 114.458061, 36.641676 | 13,556 |
| 25 | 114.504989, 36.620621 | 33,376 | 68 | 114.451953, 36.639794 | 9786 |
| 26 | 114.512894, 36.620216 | 10,062 | 69 | 114.43661, 36.62989 | 3488 |
| 27 | 114.518787, 36.61952 | 15,458 | 70 | 114.447965, 36.632728 | 29,360 |
| 28 | 114.536753, 36.618246 | 24,286 | 71 | 114.446024, 36.626182 | 47,838 |
| 29 | 114.55206, 36.616971 | 22,704 | 72 | 114.457235, 36.631164 | 15,974 |
| 30 | 114.569595, 36.617319 | 4358 | 73 | 114.463164, 36.63212 | 24,478 |
| 31 | 114.543365, 36.609034 | 21,734 | 74 | 114.460649, 36.623662 | 61,456 |
| 32 | 114.532226, 36.609787 | 26,502 | 75 | 114.471572, 36.631946 | 32,230 |
| 33 | 114.521733, 36.612047 | 27,584 | 76 | 114.46956, 36.624705 | 19,376 |
| 34 | 114.51085, 36.611757 | 21,840 | 77 | 114.475992, 36.623054 | 29,976 |
| 35 | 114.503767, 36.612858 | 32,378 | 78 | 114.465895, 36.616479 | 46,922 |
| 36 | 114.495647, 36.614944 | 38,706 | 79 | 114.441964, 36.618796 | 10,566 |
| 37 | 114.487454, 36.613785 | 28,884 | 80 | 114.478327, 36.60689 | 20,046 |
| 38 | 114.480124, 36.615813 | 10,004 | 81 | 114.471936, 36.611062 | 22,270 |
| 39 | 114.490904, 36.608165 | 32,140 | 82 | 114.466254, 36.595619 | 26,864 |
| 40 | 114.507217, 36.606455 | 50,670 | 83 | 114.432945, 36.613032 | 4106 |
| 41 | 114.520224, 36.604601 | 20,950 | 84 | 114.428202, 36.591722 | 15,940 |
| 42 | 114.531368, 36.603298 | 30,814 | 85 | 114.462625, 36.579667 | 10,226 |
| 43 | 114.541496, 36.602631 | 21,036 | 86 | 114.435963, 36.602153 | 14,572 |
DownLoad:
CSV
| Parameter | Value | Parameter | Value |
| Population size | 80 | Crossover probability | 0.9 |
| Memory capacity | 10 | Mutation probability | 0.4 |
| Iteration number | 500 | Diversity evaluation factor | 0.95 |
DownLoad:
CSV
| No. of selected front warehouses | No. of demand points it serves | Total costs/NYC | |
| Results obtained by immune algorithm | 12 | 20 21 22 23 62 63 64 65 66 67 68 69 70 71 72 73 74 75 76 77 78 79 81 82 85 |
851,460 |
| 8 | 24 25 34 35 36 37 38 39 40 46 47 48 49 50 51 52 53 57 59 60 61 80 83 84 86 |
||
| 7 | 15 16 17 18 19 26 27 28 29 30 31 32 33 41 42 43 44 45 |
||
| 3 | 1 2 3 4 9 11 12 13 | ||
| 2 | 5 6 7 8 10 | ||
| 4 | 14 | ||
| 10 | 54 55 56 58 | ||
| Results obtained by genetic algorithm | 7 | 15 16 17 18 19 26 27 28 29 30 31 32 33 41 42 43 44 45 |
1,037,230 |
| 12 | 20 21 22 23 63 65 66 67 68 69 70 71 72 73 74 75 76 77 78 79 81 83 84 86 |
||
| 8 | 24 25 34 35 36 37 38 39 40 46 47 48 49 50 51 52 53 57 59 60 61 80 82 85 |
||
| 3 | 1 2 3 9 11 12 13 | ||
| 1 | 4 5 | ||
| 2 | 6 7 8 10 | ||
| 10 | 54 55 56 58 | ||
| 11 | 62 64 | ||
| 4 | 14 |
DownLoad:
CSV
| No. | Capacity/kg | Coordinates | Available area/m2 | Infrastructure and operating costs |
| 1 | 2714285 | 114.509175, 36.662958 | 6800 | 95520 |
| 2 | 5089285 | 114.500767, 36.654475 | 10,180 | 185,450 |
| 3 | 4571428 | 114.528543, 36.644384 | 8305 | 109,520 |
| 4 | 4007142 | 114.568266, 36.661235 | 8000 | 98,560 |
| 5 | 1600000 | 114.520637, 36.631519 | 2800 | 52,860 |
| 6 | 1714285 | 114.550461, 36.63023 | 2400 | 49,250 |
| 7 | 2857142 | 114.528071, 36.616084 | 4200 | 68,590 |
| 8 | 5714285 | 114.495117, 36.60505 | 8200 | 108,690 |
| 9 | 7000000 | 114.48475, 36.58346 | 9800 | 178,520 |
| 10 | 8571428 | 114.513137, 36.576953 | 12,000 | 205,130 |
| 11 | 8214285 | 114.47194, 36.655803 | 8200 | 90,250 |
| 12 | 3428571 | 114.475102, 36.634031 | 4800 | 75,520 |
| 13 | 1714285 | 114.45936, 36.619397 | 2400 | 60,250 |
| 14 | 3000000 | 114.451845, 36.615599 | 6300 | 85,020 |
| 15 | 6571428 | 114.438034, 36.572769 | 11,500 | 199,650 |
| No. | Coordinate of demand point | Qty of demand/kg | No. | Coordinate of demand point | Qty of demand/kg |
| 1 | 114.548251, 36.646802 | 28,534 | 44 | 114.532801, 36.596083 | 21,816 |
| 2 | 114.534741, 36.651898 | 8076 | 45 | 114.52048, 36.597068 | 37,516 |
| 3 | 114.526908, 36.65572 | 9422 | 46 | 114.510451, 36.600835 | 13,986 |
| 4 | 114.517996, 36.656762 | 10,436 | 47 | 114.502761, 36.601994 | 29,848 |
| 5 | 114.508223, 36.656936 | 12,010 | 48 | 114.494569, 36.602863 | 30,114 |
| 6 | 114.495718, 36.658036 | 16,078 | 49 | 114.487526, 36.603558 | 28,366 |
| 7 | 114.495647, 36.647902 | 32,584 | 50 | 114.486448, 36.596663 | 24,314 |
| 8 | 114.509013, 36.643095 | 33,982 | 51 | 114.494137, 36.596489 | 14,476 |
| 9 | 114.52662, 36.645644 | 14,694 | 52 | 114.502689, 36.595561 | 20,388 |
| 10 | 114.493634, 36.63962 | 32,598 | 53 | 114.510019, 36.594808 | 15,890 |
| 11 | 114.524752, 36.636029 | 28,848 | 54 | 114.516703, 36.58484 | 20,212 |
| 12 | 114.536537, 36.635045 | 18,492 | 55 | 114.509085, 36.587216 | 30,808 |
| 13 | 114.548251, 36.634813 | 15,112 | 56 | 114.501539, 36.587796 | 38,202 |
| 14 | 114.563918, 36.625661 | 1108 | 57 | 114.488029, 36.591737 | 24,830 |
| 15 | 114.550407, 36.625545 | 28,416 | 58 | 114.503049, 36.578464 | 34,030 |
| 16 | 114.53431, 36.626704 | 42,264 | 59 | 114.492988, 36.583912 | 27,780 |
| 17 | 114.522596, 36.627804 | 27,464 | 60 | 114.482927, 36.587042 | 36,682 |
| 18 | 114.513182, 36.628036 | 21,540 | 61 | 114.482424, 36.579739 | 21,438 |
| 19 | 114.505923, 36.629137 | 33,770 | 62 | 114.477645, 36.65653 | 5954 |
| 20 | 114.496437, 36.629542 | 31,000 | 63 | 114.4821, 36.642574 | 12,912 |
| 21 | 114.488316, 36.62989 | 26,458 | 64 | 114.469847, 36.649089 | 10,232 |
| 22 | 114.481417, 36.62178 | 5156 | 65 | 114.471213, 36.63991 | 6588 |
| 23 | 114.487813, 36.621896 | 22,032 | 66 | 114.46629, 36.640518 | 24,222 |
| 24 | 114.496078, 36.620795 | 8762 | 67 | 114.458061, 36.641676 | 13,556 |
| 25 | 114.504989, 36.620621 | 33,376 | 68 | 114.451953, 36.639794 | 9786 |
| 26 | 114.512894, 36.620216 | 10,062 | 69 | 114.43661, 36.62989 | 3488 |
| 27 | 114.518787, 36.61952 | 15,458 | 70 | 114.447965, 36.632728 | 29,360 |
| 28 | 114.536753, 36.618246 | 24,286 | 71 | 114.446024, 36.626182 | 47,838 |
| 29 | 114.55206, 36.616971 | 22,704 | 72 | 114.457235, 36.631164 | 15,974 |
| 30 | 114.569595, 36.617319 | 4358 | 73 | 114.463164, 36.63212 | 24,478 |
| 31 | 114.543365, 36.609034 | 21,734 | 74 | 114.460649, 36.623662 | 61,456 |
| 32 | 114.532226, 36.609787 | 26,502 | 75 | 114.471572, 36.631946 | 32,230 |
| 33 | 114.521733, 36.612047 | 27,584 | 76 | 114.46956, 36.624705 | 19,376 |
| 34 | 114.51085, 36.611757 | 21,840 | 77 | 114.475992, 36.623054 | 29,976 |
| 35 | 114.503767, 36.612858 | 32,378 | 78 | 114.465895, 36.616479 | 46,922 |
| 36 | 114.495647, 36.614944 | 38,706 | 79 | 114.441964, 36.618796 | 10,566 |
| 37 | 114.487454, 36.613785 | 28,884 | 80 | 114.478327, 36.60689 | 20,046 |
| 38 | 114.480124, 36.615813 | 10,004 | 81 | 114.471936, 36.611062 | 22,270 |
| 39 | 114.490904, 36.608165 | 32,140 | 82 | 114.466254, 36.595619 | 26,864 |
| 40 | 114.507217, 36.606455 | 50,670 | 83 | 114.432945, 36.613032 | 4106 |
| 41 | 114.520224, 36.604601 | 20,950 | 84 | 114.428202, 36.591722 | 15,940 |
| 42 | 114.531368, 36.603298 | 30,814 | 85 | 114.462625, 36.579667 | 10,226 |
| 43 | 114.541496, 36.602631 | 21,036 | 86 | 114.435963, 36.602153 | 14,572 |
| Parameter | Value | Parameter | Value |
| Population size | 80 | Crossover probability | 0.9 |
| Memory capacity | 10 | Mutation probability | 0.4 |
| Iteration number | 500 | Diversity evaluation factor | 0.95 |
| No. of selected front warehouses | No. of demand points it serves | Total costs/NYC | |
| Results obtained by immune algorithm | 12 | 20 21 22 23 62 63 64 65 66 67 68 69 70 71 72 73 74 75 76 77 78 79 81 82 85 |
851,460 |
| 8 | 24 25 34 35 36 37 38 39 40 46 47 48 49 50 51 52 53 57 59 60 61 80 83 84 86 |
||
| 7 | 15 16 17 18 19 26 27 28 29 30 31 32 33 41 42 43 44 45 |
||
| 3 | 1 2 3 4 9 11 12 13 | ||
| 2 | 5 6 7 8 10 | ||
| 4 | 14 | ||
| 10 | 54 55 56 58 | ||
| Results obtained by genetic algorithm | 7 | 15 16 17 18 19 26 27 28 29 30 31 32 33 41 42 43 44 45 |
1,037,230 |
| 12 | 20 21 22 23 63 65 66 67 68 69 70 71 72 73 74 75 76 77 78 79 81 83 84 86 |
||
| 8 | 24 25 34 35 36 37 38 39 40 46 47 48 49 50 51 52 53 57 59 60 61 80 82 85 |
||
| 3 | 1 2 3 9 11 12 13 | ||
| 1 | 4 5 | ||
| 2 | 6 7 8 10 | ||
| 10 | 54 55 56 58 | ||
| 11 | 62 64 | ||
| 4 | 14 |
