Type 2 diabetes (T2D) is a prevalent global health problem largely caused by lifestyle factors, including poor diet and physical inactivity. With the increasing incidence of T2D, effective prevention strategies are urgently needed. This review examines the role of different dietary patterns and exercise regimens in the prevention and management of T2D, focusing on their effects on glycemic control, insulin sensitivity, and cardiovascular health.
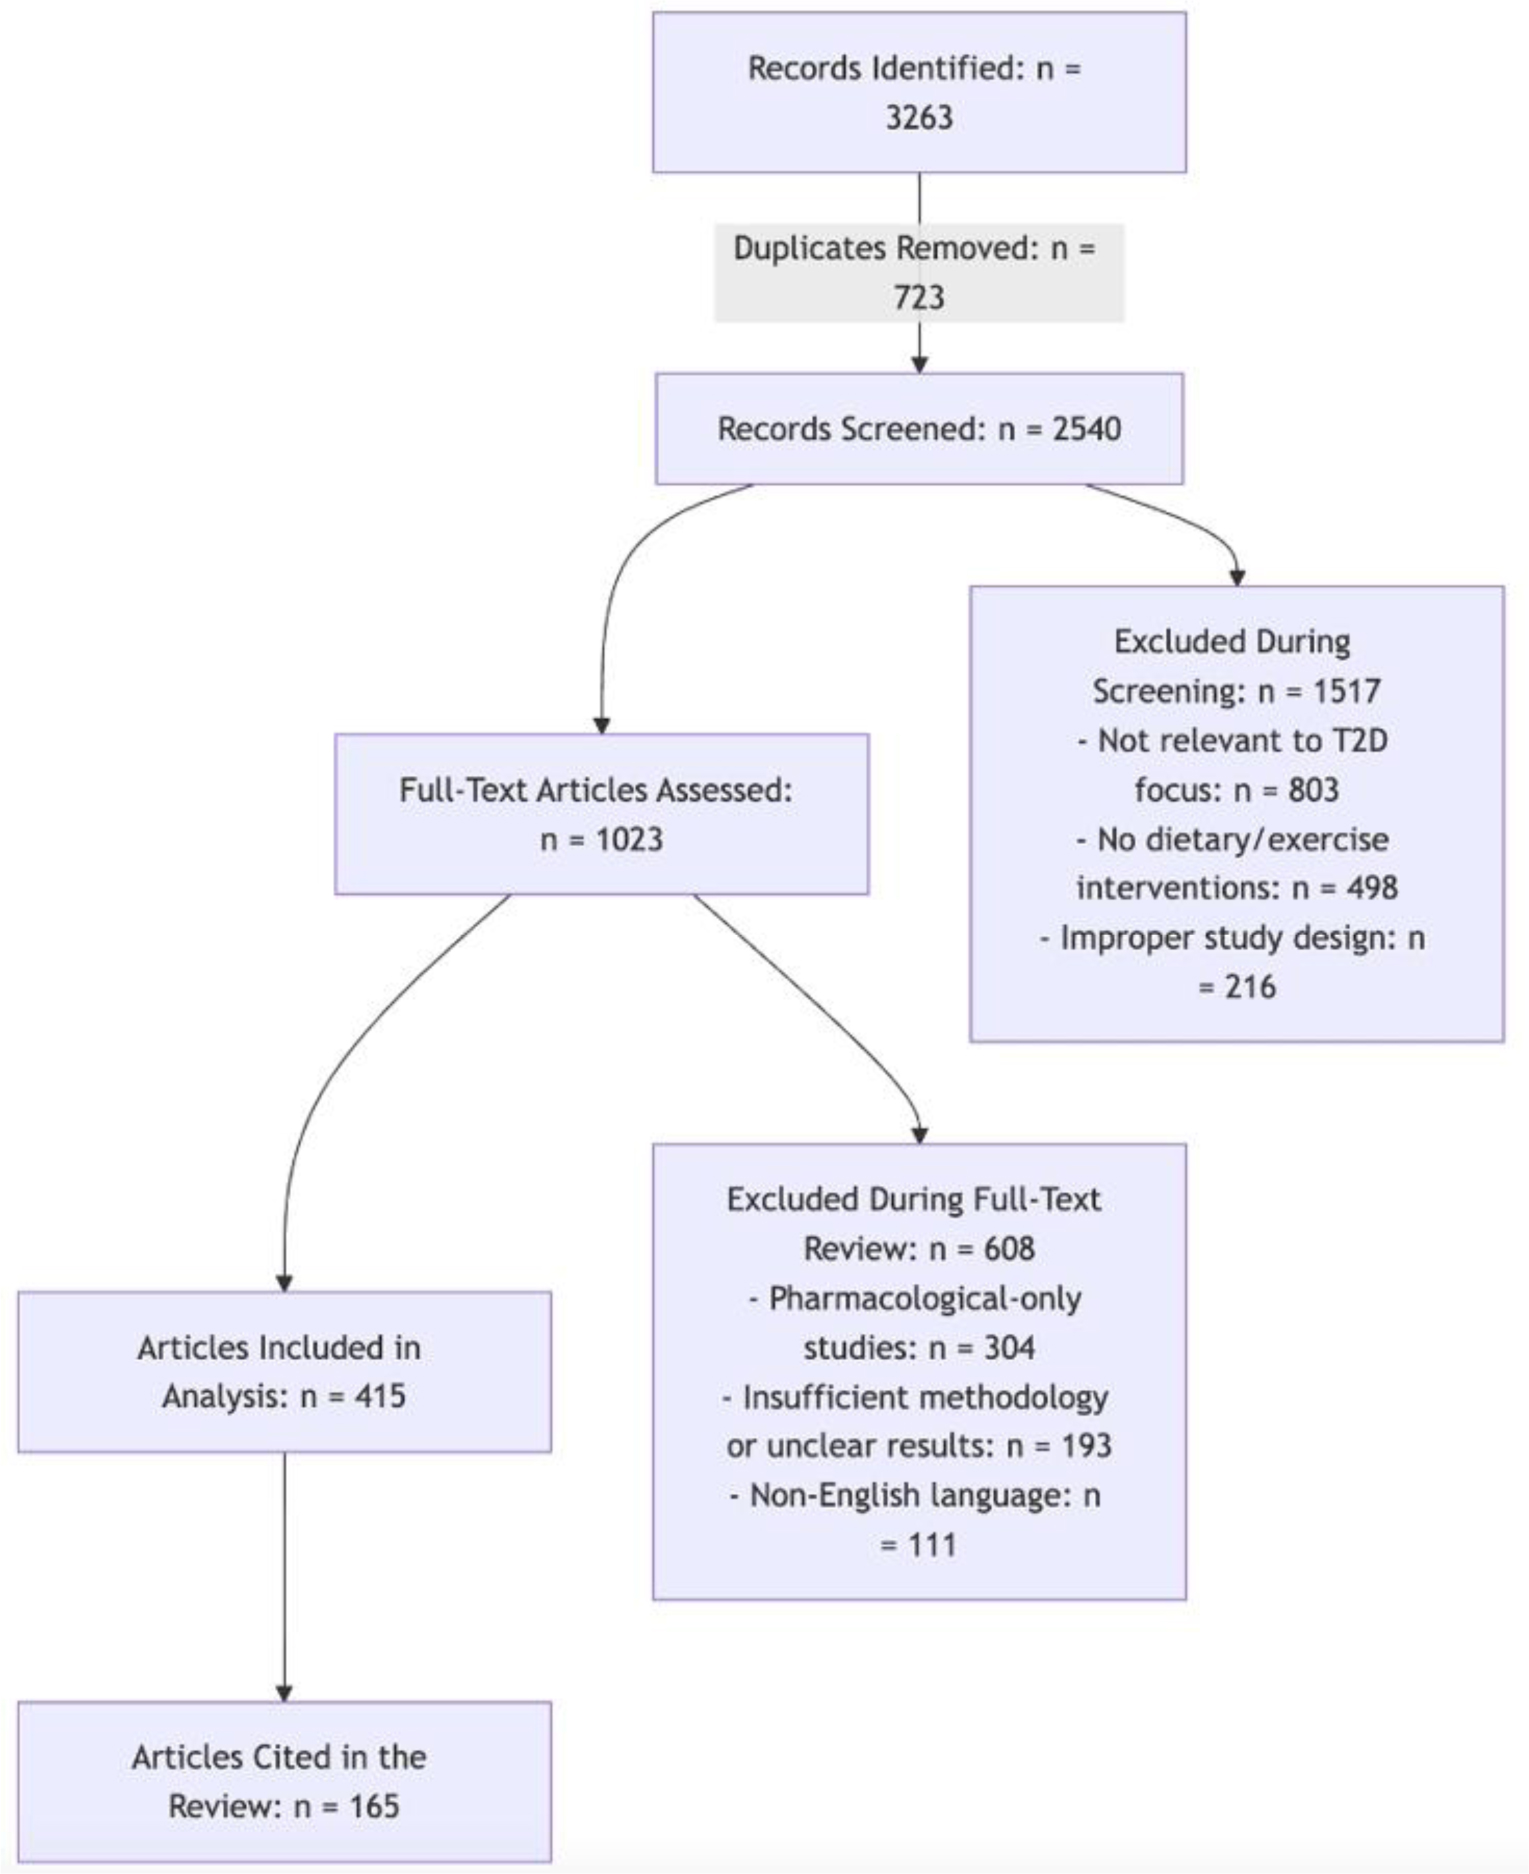
A narrative review was conducted synthesizing evidence from clinical trials, cohort studies, and meta-analyses. The review focused on the effects of low-carbohydrate diets (LCDs), Mediterranean diets (MDs), plant-based diets, high-protein diets (HPDs), and various exercise regimens, including aerobic, resistance, and high-intensity interval training (HIIT).
Dietary interventions, particularly MD and plant-based diets, are associated with improved glycemic control and reduced risk of developing T2D. LCDs show short-term benefits for weight management and HbA1c reduction, although adherence remains a challenge. HPDs show mixed results, with some benefits for lipid profiles but inconsistent effects on glycemic control. Exercise programs, especially combined aerobic and resistance training, significantly improve glycemic control, insulin sensitivity, and cardiovascular risk factors. HIIT emerges as an effective option for improving metabolic health in individuals at risk for or living with T2D.
A combination of dietary modification and physical activity, particularly Mediterranean and plant-based diets coupled with combined aerobic and resistance exercise, appears to be the most effective strategy for the prevention and management of T2D. Future research should focus on personalized approaches that integrate both diet and exercise to tailor interventions to individual patient needs.
Citation: Nicola Tecce, Mattia Proganò, Davide Menafra, Annamaria Docimo, Stefano Zarrilli, Roberta Scairati, Anna Lisa Pelosi, Rosario Pivonello, Annamaria Colao. Integrated strategies for type 2 diabetes prevention: The role of diet and exercise[J]. AIMS Public Health, 2025, 12(2): 418-450. doi: 10.3934/publichealth.2025024
Type 2 diabetes (T2D) is a prevalent global health problem largely caused by lifestyle factors, including poor diet and physical inactivity. With the increasing incidence of T2D, effective prevention strategies are urgently needed. This review examines the role of different dietary patterns and exercise regimens in the prevention and management of T2D, focusing on their effects on glycemic control, insulin sensitivity, and cardiovascular health.
A narrative review was conducted synthesizing evidence from clinical trials, cohort studies, and meta-analyses. The review focused on the effects of low-carbohydrate diets (LCDs), Mediterranean diets (MDs), plant-based diets, high-protein diets (HPDs), and various exercise regimens, including aerobic, resistance, and high-intensity interval training (HIIT).
Dietary interventions, particularly MD and plant-based diets, are associated with improved glycemic control and reduced risk of developing T2D. LCDs show short-term benefits for weight management and HbA1c reduction, although adherence remains a challenge. HPDs show mixed results, with some benefits for lipid profiles but inconsistent effects on glycemic control. Exercise programs, especially combined aerobic and resistance training, significantly improve glycemic control, insulin sensitivity, and cardiovascular risk factors. HIIT emerges as an effective option for improving metabolic health in individuals at risk for or living with T2D.
A combination of dietary modification and physical activity, particularly Mediterranean and plant-based diets coupled with combined aerobic and resistance exercise, appears to be the most effective strategy for the prevention and management of T2D. Future research should focus on personalized approaches that integrate both diet and exercise to tailor interventions to individual patient needs.

| [1] | Diabetes Prevention Program Research Group.Long-term effects of lifestyle intervention or metformin on diabetes development and microvascular complications over 15-year follow-up: the Diabetes Prevention Program Outcomes Study. Lancet Diabetes Endocrinol (2015) 3: 866-875. https://doi.org/10.1016/S2213-8587(15)00291-0 |
| [2] |
Cho NH, Shaw JE, Karuranga S, et al. (2018) IDF Diabetes Atlas: Global estimates of diabetes prevalence for 2017 and projections for 2045. Diabetes Res Clin Pract 138: 271-281. https://doi.org/10.1016/j.diabres.2018.02.023 
|
| [3] | Magliano DJ, Boyko EJ (2021) IDF Diabetes Atlas 10th edition scientific committee, IDF DIABETES ATLAS [Internet] 10th ed. Brussels: International Diabetes Federation. |
| [4] |
Willett WC, Dietz WH, Colditz GA (1999) Guidelines for healthy weight. N Engl J Med 341: 427-434. https://doi.org/10.1056/NEJM199908053410607
|
| [5] | Prospective Studies Collaboration.Body-mass index and cause-specific mortality in 900 000 adults: collaborative analyses of 57 prospective studies. Lancet (2009) 373: 1083-1096. https://doi.org/10.1016/S0140-6736(09)60318-4 |
| [6] |
Hu FB, Manson JE, Stampfer MJ, et al. (2001) Diet, lifestyle, and the risk of type 2 diabetes mellitus in women. N Engl J Med 345: 790-797. https://doi.org/10.1056/NEJMoa010492
|
| [7] |
Tabák AG, Jokela M, Akbaraly TN, et al. (2009) Trajectories of glycaemia, insulin sensitivity, and insulin secretion before diagnosis of type 2 diabetes: an analysis from the Whitehall II study. Lancet 373: 2215-2221. https://doi.org/10.1016/S0140-6736(09)60619-X
|
| [8] |
Al-Sulaiti H, Diboun I, Agha MV, et al. (2019) Metabolic signature of obesity-associated insulin resistance and type 2 diabetes. J Transl Med 17: 348. https://doi.org/10.1186/s12967-019-2096-8
|
| [9] |
Neeland IJ, Turer AT, Ayers CR, et al. (2012) Dysfunctional adiposity and the risk of prediabetes and type 2 diabetes in obese adults. JAMA 308: 1150-1159. https://doi.org/10.1001/2012.jama.11132
|
| [10] |
Blüher M (2014) Are metabolically healthy obese individuals really healthy?. Eur J Endocrinol 171: R209-219. https://doi.org/10.1530/EJE-14-0540
|
| [11] |
Phillips CM (2013) Metabolically healthy obesity: definitions, determinants and clinical implications. Rev Endocr Metab Disord 14: 219-227. https://doi.org/10.1007/s11154-013-9252-x
|
| [12] |
Ding C, Chan Z, Magkos F (2016) Lean, but not healthy: the ‘metabolically obese, normal-weight’ phenotype. Curr Opin Clin Nutr Metab Care 19: 408-417. https://doi.org/10.1097/MCO.0000000000000317
|
| [13] |
Lindström J, Louheranta A, Mannelin M, et al. (2003) The Finnish Diabetes Prevention Study (DPS): Lifestyle intervention and 3-year results on diet and physical activity. Diabetes Care 26: 3230-3236. https://doi.org/10.2337/diacare.26.12.3230
|
| [14] |
Myette-Côté É, Durrer C, Neudorf H, et al. (2018) The effect of a short-term low-carbohydrate, high-fat diet with or without postmeal walks on glycemic control and inflammation in type 2 diabetes: a randomized trial. Am J Physiol Regul Integr Comp Physiol 315: R1210-R1219. https://doi.org/10.1152/ajpregu.00240.2018
|
| [15] |
Ajala O, English P, Pinkney J (2013) Systematic review and meta-analysis of different dietary approaches to the management of type 2 diabetes. Am J Clin Nutr 97: 505-516. https://doi.org/10.3945/ajcn.112.042457
|
| [16] |
Arena R, Sagner M, Byrne NM, et al. (2017) Novel approaches for the promotion of physical activity and exercise for prevention and management of type 2 diabetes. Eur J Clin Nutr 71: 858-864. https://doi.org/10.1038/ejcn.2017.53
|
| [17] |
Bull FC, Al-Ansari SS, Biddle S, et al. (2020) World Health Organization 2020 guidelines on physical activity and sedentary behaviour. Br J Sports Med 54: 1451-1462. https://doi.org/10.1136/bjsports-2020-102955
|
| [18] |
Sigal RJ, Kenny GP, Boulé NG, et al. (2007) Effects of aerobic training, resistance training, or both on glycemic control in type 2 diabetes: a randomized trial. Ann Intern Med 147: 357-369. https://doi.org/10.7326/0003-4819-147-6-200709180-00005
|
| [19] |
Winding KM, Munch GW, Iepsen UW, et al. (2018) The effect on glycaemic control of low-volume high-intensity interval training versus endurance training in individuals with type 2 diabetes. Diabetes Obes Metab 20: 1131-1139. https://doi.org/10.1111/dom.13198
|
| [20] |
Earnest CP, Johannsen NM, Swift DL, et al. (2014) Aerobic and strength training in concomitant metabolic syndrome and type 2 diabetes. Med Sci Sports Exerc 46: 1293-1301. https://doi.org/10.1249/MSS.0000000000000242
|
| [21] |
Papadopoulou SK, Nikolaidis PT (2023) Low-Carbohydrate Diet and Human Health. Nutrients 15: 2004. https://doi.org/10.3390/nu15082004
|
| [22] |
Barzegar M, Afghan M, Tarmahi V, et al. (2021) Ketogenic diet: overview, types, and possible anti-seizure mechanisms. Nutr Neurosci 24: 307-316. https://doi.org/10.1080/1028415X.2019.1627769
|
| [23] | World Health OrganizationCarbohydrate intake for adults and children: WHO guideline (2023). [cited 2025 March 21]. Available from: https://www.who.int/publications/i/item/9789240073593 |
| [24] |
Abbasi J (2018) Interest in the Ketogenic Diet Grows for Weight Loss and Type 2 Diabetes. JAMA 319: 215-217. https://doi.org/10.1001/jama.2017.20639
|
| [25] |
Brouns F (2018) Overweight and diabetes prevention: is a low-carbohydrate-high-fat diet recommendable?. Eur J Nutr 57: 1301-1312. https://doi.org/10.1007/s00394-018-1636-y
|
| [26] |
van Wyk HJ, Davis RE, Davies JS (2016) A critical review of low-carbohydrate diets in people with Type 2 diabetes. Diabet Med 33: 148-157. https://doi.org/10.1111/dme.12964
|
| [27] |
Hall KD (2017) A review of the carbohydrate-insulin model of obesity. Eur J Clin Nutr 71: 323-326. https://doi.org/10.1038/ejcn.2016.260
|
| [28] |
Moreno B, Bellido D, Sajoux I, et al. (2014) Comparison of a very low-calorie-ketogenic diet with a standard low-calorie diet in the treatment of obesity. Endocrine 47: 793-805. https://doi.org/10.1007/s12020-014-0192-3
|
| [29] |
Feinman RD, Fine EJ (2007) Nonequilibrium thermodynamics and energy efficiency in weight loss diets. Theor Biol Med Model 4: 27. https://doi.org/10.1186/1742-4682-4-27
|
| [30] |
Dorans KS, Bazzano LA, Qi L, et al. (2022) Effects of a Low-Carbohydrate Dietary Intervention on Hemoglobin A1c: A Randomized Clinical Trial. JAMA Netw Open 5: e2238645. https://doi.org/10.1001/jamanetworkopen.2022.38645
|
| [31] |
Samkani A, Skytte MJ, Kandel D, et al. (2018) A carbohydrate-reduced high-protein diet acutely decreases postprandial and diurnal glucose excursions in type 2 diabetes patients. Br J Nutr 119: 910-917. https://doi.org/10.1017/S0007114518000521
|
| [32] |
Skytte MJ, Samkani A, Petersen AD, et al. (2019) A carbohydrate-reduced high-protein diet improves HbA1c and liver fat content in weight stable participants with type 2 diabetes: a randomised controlled trial. Diabetologia 62: 2066-2078. https://doi.org/10.1007/s00125-019-4956-4
|
| [33] |
Snorgaard O, Poulsen GM, Andersen HK, et al. (2017) Systematic review and meta-analysis of dietary carbohydrate restriction in patients with type 2 diabetes. BMJ Open Diabetes Res Care 5: e000354. https://doi.org/10.1136/bmjdrc-2016-000354
|
| [34] |
Davis C, Bryan J, Hodgson J, et al. (2015) Definition of the Mediterranean Diet; a Literature Review. Nutrients 7: 9139-9153. https://doi.org/10.3390/nu7115459
|
| [35] |
Dominguez LJ, Di Bella G, Veronese N, et al. (2021) Impact of Mediterranean Diet on Chronic Non-Communicable Diseases and Longevity. Nutrients 13: 2028. https://doi.org/10.3390/nu13062028
|
| [36] |
Trichopoulou A (2021) Mediterranean diet as intangible heritage of humanity: 10 years on. Nutr Metab Cardiovasc Dis 31: 1943-1948. https://doi.org/10.1016/j.numecd.2021.04.011
|
| [37] |
Jannasch F, Kröger J, Schulze MB, et al. (2017) Dietary Patterns and Type 2 Diabetes: A Systematic Literature Review and Meta-Analysis of Prospective Studies. J Nutr 147: 1174-1182. https://doi.org/10.3945/jn.116.242552
|
| [38] |
Milenkovic T, Bozhinovska N, Macut D, et al. (2021) Mediterranean Diet and Type 2 Diabetes Mellitus: A Perpetual Inspiration for the Scientific World. A Review. Nutrients 13: 1307. https://doi.org/10.3390/nu13041307
|
| [39] |
Pavlidou E, Papadopoulou SK, Fasoulas A, et al. (2023) Diabesity and Dietary Interventions: Evaluating the Impact of Mediterranean Diet and Other Types of Diets on Obesity and Type 2 Diabetes Management. Nutrients 16: 34. https://doi.org/10.3390/nu16010034
|
| [40] | Estruch R, Ros E, Salas-Salvadó J, et al. (2018) Primary Prevention of Cardiovascular Disease with a Mediterranean Diet Supplemented with Extra-Virgin Olive Oil or Nuts. N Engl J Med 378: e34. https://doi.org/10.1056/NEJMoa1800389 |
| [41] |
Churuangsuk C, Hall J, Reynolds A, et al. (2022) Diets for weight management in adults with type 2 diabetes: an umbrella review of published meta-analyses and systematic review of trials of diets for diabetes remission. Diabetologia 65: 14-36. https://doi.org/10.1007/s00125-021-05577-2
|
| [42] |
Panagiotakos DB, Tzima N, Pitsavos C, et al. (2007) The association between adherence to the Mediterranean diet and fasting indices of glucose homoeostasis: the ATTICA Study. J Am Coll Nutr 26: 32-38. https://doi.org/10.1080/07315724.2007.10719583
|
| [43] |
Koloverou E, Panagiotakos DB, Pitsavos C, et al. (2016) Adherence to Mediterranean diet and 10-year incidence (2002-2012) of diabetes: correlations with inflammatory and oxidative stress biomarkers in the ATTICA cohort study. Diabetes Metab Res Re 32: 73-81. https://doi.org/10.1002/dmrr.2672
|
| [44] |
Gnagnarella P, Dragà D, Misotti AM, et al. (2018) Validation of a short questionnaire to record adherence to the Mediterranean diet: An Italian experience. Nutr Metab Cardiovasc Dis 28: 1140-1147. https://doi.org/10.1016/j.numecd.2018.06.006
|
| [45] |
Melina V, Craig W, Levin S, et al. (2016) Position of the Academy of Nutrition and Dietetics: Vegetarian Diets. J Acad Nutr Diet 116: 1970-1980. https://doi.org/10.1016/j.jand.2016.09.025
|
| [46] |
Craig WJ, Mangels AR, Fresán U, et al. (2021) The Safe and Effective Use of Plant-Based Diets with Guidelines for Health Professionals. Nutrients 13: 4144. https://doi.org/10.3390/nu13114144
|
| [47] | McMacken M, Shah S (2017) A plant-based diet for the prevention and treatment of type 2 diabetes. J Geriatr Cardiol 14: 342-354. https://doi.org/10.11909/j.issn.1671-5411.2017.05.009 |
| [48] |
Baothman OA, Zamzami MA, Taher I, et al. (2016) The role of Gut Microbiota in the development of obesity and Diabetes. Lipids Health Dis 15: 108. https://doi.org/10.1186/s12944-016-0278-4
|
| [49] |
Kim Y, Keogh JB, Clifton PM (2016) Polyphenols and Glycemic Control. Nutrients 8: 17. https://doi.org/10.3390/nu8010017
|
| [50] |
Kim Y, Keogh J, Clifton P (2015) A review of potential metabolic etiologies of the observed association between red meat consumption and development of type 2 diabetes mellitus. Metabolism 64: 768-779. https://doi.org/10.1016/j.metabol.2015.03.008
|
| [51] |
Nolan CJ, Larter CZ (2009) Lipotoxicity: why do saturated fatty acids cause and monounsaturates protect against it?. J Gastroenterol Hepatol 24: 703-706. https://doi.org/10.1111/j.1440-1746.2009.05823.x
|
| [52] |
Qian F, Liu G, Hu FB, et al. (2019) Association Between Plant-Based Dietary Patterns and Risk of Type 2 Diabetes: A Systematic Review and Meta-analysis. JAMA Intern Med 179: 1335-1344. https://doi.org/10.1001/jamainternmed.2019.2195
|
| [53] |
Li J, Glenn AJ, Yang Q, et al. (2022) Dietary Protein Sources, Mediating Biomarkers, and Incidence of Type 2 Diabetes: Findings From the Women's Health Initiative and the UK Biobank. Diabetes Care 45: 1742-1753. https://doi.org/10.2337/dc22-0368
|
| [54] |
Papier K, Appleby PN, Fensom GK, et al. (2019) Vegetarian diets and risk of hospitalisation or death with diabetes in British adults: results from the EPIC-Oxford study. Nutr Diabetes 9: 7. https://doi.org/10.1038/s41387-019-0074-0
|
| [55] | Key TJ, Papier K, Tong TYN (2021) Plant-based diets and long-term health: findings from the EPIC-Oxford study. Proc Nutr Soc 81: 190-198. https://doi.org/10.1017/S0029665121003748 |
| [56] |
Ley SH, Ardisson Korat AV, Sun Q, et al. (2016) Contribution of the Nurses' Health Studies to Uncovering Risk Factors for Type 2 Diabetes: Diet, Lifestyle, Biomarkers, and Genetics. Am J Public Health 106: 1624-1630. https://doi.org/10.2105/AJPH.2016.303314
|
| [57] |
Malik VS, Fung TT, van Dam RM, et al. (2012) Dietary patterns during adolescence and risk of type 2 diabetes in middle-aged women. Diabetes Care 35: 12-18. https://doi.org/10.2337/dc11-0386
|
| [58] |
Pounis GD, Tyrovolas S, Antonopoulou M, et al. (2010) Long-term animal-protein consumption is associated with an increased prevalence of diabetes among the elderly: the Mediterranean Islands (MEDIS) study. Diabetes Metab 36: 484-490. https://doi.org/10.1016/j.diabet.2010.06.007
|
| [59] |
Weickert MO, Roden M, Isken F, et al. (2011) Effects of supplemented isoenergetic diets differing in cereal fiber and protein content on insulin sensitivity in overweight humans. Am J Clin Nutr 94: 459-471. https://doi.org/10.3945/ajcn.110.004374
|
| [60] |
Moon J, Koh G (2020) Clinical Evidence and Mechanisms of High-Protein Diet-Induced Weight Loss. J Obes Metab Syndr 29: 166-173. https://doi.org/10.7570/jomes20028
|
| [61] |
Hansen TT, Astrup A, Sjödin A (2021) Are Dietary Proteins the Key to Successful Body Weight Management? A Systematic Review and Meta-Analysis of Studies Assessing Body Weight Outcomes after Interventions with Increased Dietary Protein. Nutrients 13: 3193. https://doi.org/10.3390/nu13093193
|
| [62] |
Magkos F (2020) Protein-Rich Diets for Weight Loss Maintenance. Curr Obes Rep 9: 213-218. https://doi.org/10.1007/s13679-020-00391-0
|
| [63] |
Stentz FB, Mikhael A, Kineish O, et al. (2021) High protein diet leads to prediabetes remission and positive changes in incretins and cardiovascular risk factors. Nutr Metab Cardiovasc Dis 31: 1227-1237. https://doi.org/10.1016/j.numecd.2020.11.027
|
| [64] |
Clina JG, Sayer RD, Pan Z, et al. (2023) High- and normal-protein diets improve body composition and glucose control in adults with type 2 diabetes: a randomized trial. Obesity (Silver Spring) 31: 2021-2030. https://doi.org/10.1002/oby.23815
|
| [65] |
Yu Z, Nan F, Wang LY, et al. (2020) Effects of high-protein diet on glycemic control, insulin resistance and blood pressure in type 2 diabetes: A systematic review and meta-analysis of randomized controlled trials. Clin Nutr 39: 1724-1734. https://doi.org/10.1016/j.clnu.2019.08.008
|
| [66] |
Jing T, Zhang S, Bai M, et al. (2023) Effect of Dietary Approaches on Glycemic Control in Patients with Type 2 Diabetes: A Systematic Review with Network Meta-Analysis of Randomized Trials. Nutrients 15: 3156. https://doi.org/10.3390/nu15143156
|
| [67] |
Gérard C, Vidal H (2019) Impact of Gut Microbiota on Host Glycemic Control. Front Endocrinol (Lausanne) 10: 29. https://doi.org/10.3389/fendo.2019.00029
|
| [68] |
Xu YH, Gao CL, Guo HL, et al. (2018) Sodium butyrate supplementation ameliorates diabetic inflammation in db/db mice. J Endocrinol 238: 231-244. https://doi.org/10.1530/JOE-18-0137
|
| [69] |
Psichas A, Sleeth ML, Murphy KG, et al. (2015) The short chain fatty acid propionate stimulates GLP-1 and PYY secretion via free fatty acid receptor 2 in rodents. Int J Obes (Lond) 39: 424-9. https://doi.org/10.1038/ijo.2014.153
|
| [70] |
van Deuren T, Blaak EE, Canfora EE (2022) Butyrate to combat obesity and obesity-associated metabolic disorders: Current status and future implications for therapeutic use. Obes Rev 23: e13498. https://doi.org/10.1111/obr.13498
|
| [71] | Harsch IA, Konturek PC (2018) The Role of Gut Microbiota in Obesity and Type 2 and Type 1 Diabetes Mellitus: New Insights into “Old” Diseases. Med Sci (Basel) 6: 32. https://doi.org/10.3390/medsci6020032 |
| [72] |
Aydin Ö, Nieuwdorp M, Gerdes V (2018) The Gut Microbiome as a Target for the Treatment of Type 2 Diabetes. Curr Diab Rep 18: 55. https://doi.org/10.1007/s11892-018-1020-6
|
| [73] |
Schwiertz A, Taras D, Schäfer K, et al. (2010) Microbiota and SCFA in lean and overweight healthy subjects. Obesity (Silver Spring) 18: 190-195. https://doi.org/10.1038/oby.2009.167
|
| [74] |
Gurung M, Li Z, You H, et al. (2020) Role of gut microbiota in type 2 diabetes pathophysiology. EBioMedicine 51: 102590. https://doi.org/10.1016/j.ebiom.2019.11.051
|
| [75] |
Horowitz JF, Klein S (2000) Lipid metabolism during endurance exercise. Am J Clin Nutr 72: 558S-5563S. https://doi.org/10.1093/ajcn/72.2.558S
|
| [76] |
Howley ET (2001) Type of activity: resistance, aerobic and leisure versus occupational physical activity. Med Sci Sports Exerc 33: S364-369. https://doi.org/10.1097/00005768-200106001-00005
|
| [77] |
Muscella A, Stefàno E, Lunetti P, et al. (2020) The Regulation of Fat Metabolism During Aerobic Exercise. Biomolecules 10: 1699. https://doi.org/10.3390/biom10121699
|
| [78] |
Houten SM, Wanders RJ (2010) A general introduction to the biochemistry of mitochondrial fatty acid β-oxidation. J Inherit Metab Dis 33: 469-477. https://doi.org/10.1007/s10545-010-9061-2
|
| [79] |
Jeukendrup AE (2002) Regulation of fat metabolism in skeletal muscle. Ann N Y Acad Sci 967: 217-235. https://doi.org/10.1111/j.1749-6632.2002.tb04278.x
|
| [80] |
Ruegsegger GN, Booth FW (2018) Health Benefits of Exercise. Cold Spring Harb Perspect Med 8: a029694. https://doi.org/10.1101/cshperspect.a029694
|
| [81] |
Colberg SR, Albright AL, Blissmer BJ, et al. (2010) Exercise and type 2 diabetes: American College of Sports Medicine and the American Diabetes Association: joint position statement. Exercise and type 2 diabetes. Med Sci Sports Exerc 42: 2282-2303. https://doi.org/10.1249/MSS.0b013e3181eeb61c
|
| [82] |
Lochte L, Nielsen KG, Petersen PE, et al. (2016) Childhood asthma and physical activity: a systematic review with meta-analysis and Graphic Appraisal Tool for Epidemiology assessment. BMC Pediatr 16: 50. https://doi.org/10.1186/s12887-016-0571-4
|
| [83] |
Ross R, Dagnone D, Jones PJ, et al. (2000) Reduction in obesity and related comorbid conditions after diet-induced weight loss or exercise-induced weight loss in men. A randomized, controlled trial. Ann Intern Med 133: 92-103. https://doi.org/10.7326/0003-4819-133-2-200007180-00008
|
| [84] |
Marson EC, Delevatti RS, Prado AK, et al. (20166) Effects of aerobic, resistance, and combined exercise training on insulin resistance markers in overweight or obese children and adolescents: A systematic review and meta-analysis. Prev Med 93: 211-218. https://doi.org/10.1016/j.ypmed.2016.10.020
|
| [85] |
Malin SK, Kirwan JP (2012) Fasting hyperglycaemia blunts the reversal of impaired glucose tolerance after exercise training in obese older adults. Diabetes Obes Metab 14: 835-841. https://doi.org/10.1111/j.1463-1326.2012.01608.x
|
| [86] |
Wang Y, Li H, Yang D, et al. (2023) Effects of aerobic exercises in prediabetes patients: a systematic review and meta-analysis. Front Endocrinol (Lausanne) 14: 1227489. https://doi.org/10.3389/fendo.2023.1227489
|
| [87] |
Phielix E, Meex R, Moonen-Kornips E, et al. (2010) Exercise training increases mitochondrial content and ex vivo mitochondrial function similarly in patients with type 2 diabetes and in control individuals. Diabetologia 53: 1714-1721. https://doi.org/10.1007/s00125-010-1764-2
|
| [88] |
Winnick JJ, Sherman WM, Habash DL, et al. (2008) Short-term aerobic exercise training in obese humans with type 2 diabetes mellitus improves whole-body insulin sensitivity through gains in peripheral, not hepatic insulin sensitivity. J Clin Endocrinol Metab 93: 771-778. https://doi.org/10.1210/jc.2007-1524
|
| [89] |
Kirwan JP, Solomon TP, Wojta DM, et al. (2009) Effects of 7 days of exercise training on insulin sensitivity and responsiveness in type 2 diabetes mellitus. Am J Physiol Endocrinol Metab 297: E151-156. https://doi.org/10.1152/ajpendo.00210.2009
|
| [90] |
Pérez-Martin A, Raynaud E, Mercier J (2001) Insulin resistance and associated metabolic abnormalities in muscle: effects of exercise. Obes Rev 2: 47-59. https://doi.org/10.1046/j.1467-789x.2001.00024.x
|
| [91] |
Umpierre D, Ribeiro PA, Kramer CK, et al. (2011) Physical activity advice only or structured exercise training and association with HbA1c levels in type 2 diabetes: a systematic review and meta-analysis. JAMA 305: 1790-1799. https://doi.org/10.1001/jama.2011.576
|
| [92] |
Sampath Kumar A, Maiya AG, Shastry BA, et al. (2019) Exercise and insulin resistance in type 2 diabetes mellitus: A systematic review and meta-analysis. Ann Phys Rehabil Med 62: 98-103. https://doi.org/10.1016/j.rehab.2018.11.001
|
| [93] |
Boulé NG, Kenny GP, Haddad E, et al. (2003) Meta-analysis of the effect of structured exercise training on cardiorespiratory fitness in Type 2 diabetes mellitus. Diabetologia 46: 1071-1081. https://doi.org/10.1007/s00125-003-1160-2
|
| [94] |
Kadoglou NP, Iliadis F, Angelopoulou N, et al. (2007) The anti-inflammatory effects of exercise training in patients with type 2 diabetes mellitus. Eur J Cardiovasc Prev Rehabil 14: 837-843. https://doi.org/10.1097/HJR.0b013e3282efaf50
|
| [95] |
Leong DP, Teo KK, Rangarajan S, et al. (2015) Prognostic value of grip strength: findings from the Prospective Urban Rural Epidemiology (PURE) study. Lancet 386: 266-273. https://doi.org/10.1016/S0140-6736(14)62000-6
|
| [96] |
Celis-Morales CA, Petermann F, Hui L, et al. (2017) Associations Between Diabetes and Both Cardiovascular Disease and All-Cause Mortality Are Modified by Grip Strength: Evidence From UK Biobank, a Prospective Population-Based Cohort Study. Diabetes Care 40: 1710-1718. https://doi.org/10.2337/dc17-0921
|
| [97] |
Lu Y, Li G, Ferrari P, et al. (2022) Associations of handgrip strength with morbidity and all-cause mortality of cardiometabolic multimorbidity. BMC Med 20: 191. https://doi.org/10.1186/s12916-022-02389-y
|
| [98] |
Felig P, Owen OE, Wahren J, et al. (1969) Amino acid metabolism during prolonged starvation. J Clin Invest 48: 584-594. https://doi.org/10.1172/JCI106017
|
| [99] |
Cruz-Jentoft AJ, Bahat G, Bauer J, et al. (2019) Sarcopenia: revised European consensus on definition and diagnosis. Age Ageing 48: 601. https://doi.org/10.1093/ageing/afz046
|
| [100] |
Park SW, Goodpaster BH, Strotmeyer ES, et al. (2006) Decreased muscle strength and quality in older adults with type 2 diabetes: the health, aging, and body composition study. Diabetes 55: 1813-1818. https://doi.org/10.2337/db05-1183
|
| [101] |
DeFronzo RA, Gunnarsson R, Björkman O, et al. (1985) Effects of insulin on peripheral and splanchnic glucose metabolism in noninsulin-dependent (type II) diabetes mellitus. J Clin Invest 76: 149-155. https://doi.org/10.1172/JCI111938
|
| [102] |
Ciaraldi TP, Mudaliar S, Barzin A, et al. (20005) Skeletal muscle GLUT1 transporter protein expression and basal leg glucose uptake are reduced in type 2 diabetes. J Clin Endocrinol Metab 90: 352-358. https://doi.org/10.1210/jc.2004-0516
|
| [103] |
Peterson MD, Rhea MR, Sen A, et al. (2010) Resistance exercise for muscular strength in older adults: a meta-analysis. Ageing Res Rev 9: 226-237. https://doi.org/10.1016/j.arr.2010.03.004
|
| [104] |
Schoenfeld BJ, Ogborn D, Krieger JW (2016) Effects of Resistance Training Frequency on Measures of Muscle Hypertrophy: A Systematic Review and Meta-Analysis. Sports Med 46: 1689-1697. https://doi.org/10.1007/s40279-016-0543-8
|
| [105] |
McGinley SK, Armstrong MJ, Boulé NG, et al. (2015) Effects of exercise training using resistance bands on glycaemic control and strength in type 2 diabetes mellitus: a meta-analysis of randomised controlled trials. Acta Diabetol 52: 221-230. https://doi.org/10.1007/s00592-014-0594-y
|
| [106] |
Liu Y, Ye W, Chen Q, et al. (2019) Resistance Exercise Intensity is Correlated with Attenuation of HbA1c and Insulin in Patients with Type 2 Diabetes: A Systematic Review and Meta-Analysis. Int J Environ Res Public Health 16: 140. https://doi.org/10.3390/ijerph16010140
|
| [107] |
Yuan X, Dai X, Liu L, et al. (2020) Comparing the effects of 6 months aerobic exercise and resistance training on metabolic control and β-cell function in Chinese patients with prediabetes: A multicenter randomized controlled trial. J Diabetes 12: 25-37. https://doi.org/10.1111/1753-0407.12955
|
| [108] |
Zhang H, Guo Y, Hua G, et al. (2024) Exercise training modalities in prediabetes: a systematic review and network meta-analysis. Front Endocrinol (Lausanne) 15: 1308959. https://doi.org/10.3389/fendo.2024.1308959
|
| [109] |
Gordon BA, Benson AC, Bird SR, et al. (2009) Resistance training improves metabolic health in type 2 diabetes: a systematic review. Diabetes Res Clin Pract 83: 157-175. https://doi.org/10.1016/j.diabres.2008.11.024
|
| [110] |
Dunstan DW, Daly RM, Owen N, et al. (2002) High-intensity resistance training improves glycemic control in older patients with type 2 diabetes. Diabetes Car 25: 1729-1736. https://doi.org/10.2337/diacare.25.10.1729
|
| [111] |
Che S, Meng M, Jiang Y, et al. (2022) Perceptions of exercise and exercise instruction in patients with type 2 diabetes mellitus and sarcopenia: a qualitative study. BMC Geriatr 22: 892. https://doi.org/10.1186/s12877-022-03519-0
|
| [112] |
Hsieh SS, Chueh TY, Huang CJ, et al. (2021) Systematic review of the acute and chronic effects of high-intensity interval training on executive function across the lifespan. J Sports Sci 39: 10-22. https://doi.org/10.1080/02640414.2020.1803630
|
| [113] |
Rynecki ND, Siracuse BL, Ippolito JA, et al. (2019) Injuries sustained during high intensity interval training: are modern fitness trends contributing to increased injury rates?. J Sports Med Phys Fitness 59: 1206-1212. https://doi.org/10.23736/S0022-4707.19.09407-6
|
| [114] |
Guthold R, Stevens GA, Riley LM, et al. (2018) Worldwide trends in insufficient physical activity from 2001 to 2016: a pooled analysis of 358 population-based surveys with 1·9 million participants. Lancet Glob Health 6: e1077-e1086. https://doi.org/10.1016/S2214-109X(18)30357-7
|
| [115] | Lee CL, Hsu WC, Cheng CF (2017) Physiological Adaptations to Sprint Interval Training with Matched Exercise Volume. Med Sci Sports Exerc 49: 86-95. https://doi.org/10.1249/MSS.0000000000001083 |
| [116] |
Lee CL, Kuo YH, Cheng CF (2018) Acute High-Intensity Interval Cycling Improves Postprandial Lipid Metabolism. Med Sci Sports Exerc 50: 1687-1696. https://doi.org/10.1249/MSS.0000000000001613
|
| [117] |
Gillen JB, Little JP, Punthakee Z, et al. (20112) Acute high-intensity interval exercise reduces the postprandial glucose response and prevalence of hyperglycaemia in patients with type 2 diabetes. Diabetes Obes Metab 14: 575-577. https://doi.org/10.1111/j.1463-1326.2012.01564.x
|
| [118] |
Little JP, Jung ME, Wright AE, et al. (2014) Effects of high-intensity interval exercise versus continuous moderate-intensity exercise on postprandial glycemic control assessed by continuous glucose monitoring in obese adults. Appl Physiol Nutr Metab 39: 835-841. https://doi.org/10.1139/apnm-2013-0512
|
| [119] |
Terada T, Wilson BJ, Myette-Côté E, et al. (2016) Targeting specific interstitial glycemic parameters with high-intensity interval exercise and fasted-state exercise in type 2 diabetes. Metabolism 65: 599-608. https://doi.org/10.1016/j.metabol.2016.01.003
|
| [120] |
Jelleyman C, Yates T, O'Donovan G, et al. (2015) The effects of high-intensity interval training on glucose regulation and insulin resistance: a meta-analysis. Obes Rev 16: 942-961. https://doi.org/10.1111/obr.12317
|
| [121] |
RezkAllah SS, Takla MK (2019) Effects of Different Dosages of Interval Training on Glycemic Control in People With Prediabetes: A Randomized Controlled Trial. Diabetes Spectr 32: 125-131. https://doi.org/10.2337/ds18-0024
|
| [122] |
Little JP, Safdar A, Wilkin GP, et al. (2010) A practical model of low-volume high-intensity interval training induces mitochondrial biogenesis in human skeletal muscle: potential mechanisms. J Physiol 588: 1011-1022. https://doi.org/10.1113/jphysiol.2009.181743
|
| [123] | American Diabetes Association Primary Care Advisory Group.Introduction: Standards of Care in Diabetes-2024 Abridged for Primary Care Professionals. Clin Diabetes (2024) 42: 181. https://doi.org/10.2337/cd24-aint |
| [124] |
Cai H, Li G, Zhang P, et al. (2017) Effect of exercise on the quality of life in type 2 diabetes mellitus: a systematic review. Qual Life Res 26: 515-530. https://doi.org/10.1007/s11136-016-1481-5
|
| [125] |
Sigal RJ, Armstrong MJ, Colby P, et al. (2013) Physical activity and diabetes. Can J Diabetes 37: S40-S44. https://doi.org/10.1016/j.jcjd.2013.01.018
|
| [126] |
Cuff DJ, Meneilly GS, Martin A, et al. (2003) Effective exercise modality to reduce insulin resistance in women with type 2 diabetes. Diabetes Care 26: 2977-2982. https://doi.org/10.2337/diacare.26.11.2977
|
| [127] |
Balducci S, Leonetti F, Di Mario U, et al. (2004) Is a long-term aerobic plus resistance training program feasible for and effective on metabolic profiles in type 2 diabetic patients?. Diabetes Care 27: 841-842. https://doi.org/10.2337/diacare.27.3.841
|
| [128] |
Balducci S, Alessi E, Cardelli P, et al. (2007) Effects of different modes of exercise training on glucose control and risk factors for complications in type 2 diabetic patients: a meta-analysis: response to Snowling and Hopkins. Diabetes Care 30: e25. https://doi.org/10.2337/dc06-2495
|
| [129] |
Schwingshackl L, Missbach B, Dias S, et al. (2014) Impact of different training modalities on glycaemic control and blood lipids in patients with type 2 diabetes: a systematic review and network meta-analysis. Diabetologia 57: 1789-1797. https://doi.org/10.1007/s00125-014-3303-z
|
| [130] |
Popkin BM, Adair LS, Ng SW (2012) Global nutrition transition and the pandemic of obesity in developing countries. Nutr Rev 70: 3-21. https://doi.org/10.1111/j.1753-4887.2011.00456.x
|
| [131] |
Palacios OM, Kramer M, Maki KC (2019) Diet and prevention of type 2 diabetes mellitus: beyond weight loss and exercise. Expert Rev Endocrinol Metab 14: 1-12. https://doi.org/10.1080/17446651.2019.1554430
|
| [132] |
Rowley WR, Bezold C, Arikan Y, et al. (2017) Diabetes 2030: Insights from Yesterday, Today, and Future Trends. Popul Health Manag 20: 6-12. https://doi.org/10.1089/pop.2015.0181
|
| [133] |
Gillies CL, Abrams KR, Lambert PC, et al. (2007) Pharmacological and lifestyle interventions to prevent or delay type 2 diabetes in people with impaired glucose tolerance: systematic review and meta-analysis. BMJ 334: 299. https://doi.org/10.1136/bmj.39063.689375.55
|
| [134] |
Lindström J, Ilanne-Parikka P, Peltonen M, et al. (2006) Sustained reduction in the incidence of type 2 diabetes by lifestyle intervention: follow-up of the Finnish Diabetes Prevention Study. Lancet 368: 1673-1679. https://doi.org/10.1016/S0140-6736(06)69701-8
|
| [135] |
Knowler WC, Barrett-Connor E, Fowler SE, et al. (2002) Reduction in the incidence of type 2 diabetes with lifestyle intervention or metformin. N Engl J Med 346: 393-403. https://doi.org/10.1056/NEJMoa012512
|
| [136] |
Wing RR, Blair EH, Bononi P, et al. (1994) Caloric restriction per se is a significant factor in improvements in glycemic control and insulin sensitivity during weight loss in obese NIDDM patients. Diabetes Care 17: 30-36. https://doi.org/10.2337/diacare.17.1.30
|
| [137] |
Kirk E, Reeds DN, Finck BN, et al. (2009) Dietary fat and carbohydrates differentially alter insulin sensitivity during caloric restriction. Gastroenterology 136: 1552-1560. https://doi.org/10.1053/j.gastro.2009.01.048
|
| [138] |
Astbury NM (2024) Interventions to improve glycaemic control in people living with, and at risk of developing type 2 diabetes. Diabetes Obes Metab 26: 39-49. https://doi.org/10.1111/dom.15855
|
| [139] |
Sobiecki JG, Imamura F, Davis CR, et al. (2023) A nutritional biomarker score of the Mediterranean diet and incident type 2 diabetes: Integrated analysis of data from the MedLey randomised controlled trial and the EPIC-InterAct case-cohort study. PLoS Med 20: e1004221. https://doi.org/10.1371/journal.pmed.1004221
|
| [140] |
Sharma BR, Jaiswal S, Ravindra PV (2022) Modulation of gut microbiota by bioactive compounds for prevention and management of type 2 diabetes. Biomed Pharmacother 152: 113148. https://doi.org/10.1016/j.biopha.2022.113148
|
| [141] |
Richardson VR, Smith KA, Carter AM (2013) Adipose tissue inflammation: feeding the development of type 2 diabetes mellitus. Immunobiology 218: 1497-1504. https://doi.org/10.1016/j.imbio.2013.05.002
|
| [142] |
El-Deyarbi M, Ahmed LA, King J, et al. (2024) Effect of structured diet with exercise education on anthropometry and lifestyle modification in patients with type 2 diabetes: A 12-month randomized clinical trial. Diabetes Res Clin Pract 213: 111754. https://doi.org/10.1016/j.diabres.2024.111754
|
| [143] |
Glavas C, Scott D, Sood S, et al. (2024) Exploring the Feasibility of Digital Voice Assistants for Delivery of a Home-Based Exercise Intervention in Older Adults With Obesity and Type 2 Diabetes Mellitus: Randomized Controlled Trial. JMIR Aging 7: e53064. https://doi.org/10.2196/53064
|
| [144] |
Derrick SA, Nguyen ST, Marthens JR, et al. (2023) A Mediterranean-Style Diet Improves the Parameters for the Management and Prevention of Type 2 Diabetes Mellitus. Medicina (Kaunas) 59: 1882. https://doi.org/10.3390/medicina59101882
|
| [145] |
Veleba J, Matoulek M, Hill M, et al. (2016) “A Vegetarian vs. Conventional Hypocaloric Diet: The Effect on Physical Fitness in Response to Aerobic Exercise in Patients with Type 2 Diabetes.” A Parallel Randomized Study. Nutrients 8: 671. https://doi.org/10.3390/nu8110671
|
| [146] |
Colberg SR, Sigal RJ, Yardley JE, et al. (2016) Physical Activity/Exercise and Diabetes: A Position Statement of the American Diabetes Association. Diabetes Care 39: 2065-2079. https://doi.org/10.2337/dc16-1728
|
| [147] |
Pan XR, Li GW, Hu YH, et al. (1997) Effects of diet and exercise in preventing NIDDM in people with impaired glucose tolerance. The Da Qing IGT and Diabetes Study. Diabetes Care 20: 537-544. https://doi.org/10.2337/diacare.20.4.537
|
| [148] |
Li G, Zhang P, Wang J, et al. (2008) The long-term effect of lifestyle interventions to prevent diabetes in the China Da Qing Diabetes Prevention Study: a 20-year follow-up study. Lancet 371: 1783-1789. https://doi.org/10.1016/S0140-6736(08)60766-7
|
| [149] |
Liu L, Ma X, Xu H, et al. (2021) Comparing the effects of 12 months aerobic exercise and resistance training on glucose metabolism among prediabetes phenotype: A explorative randomized controlled trial. Prim Care Diabetes 15: 340-346. https://doi.org/10.1016/j.pcd.2020.11.003
|
| [150] |
Rowan CP, Riddell MC, Gledhill N, et al. (2017) Aerobic Exercise Training Modalities and Prediabetes Risk Reduction. Med Sci Sports Exerc 49: 403-412. https://doi.org/10.1249/MSS.0000000000001135
|
| [151] |
AbouAssi H, Slentz CA, Mikus CR, et al. (2015) The effects of aerobic, resistance, and combination training on insulin sensitivity and secretion in overweight adults from STRRIDE AT/RT: a randomized trial. J Appl Physiol 118: 1474-1482. https://doi.org/10.1152/japplphysiol.00509.2014
|
| [152] |
Green DJ, Hopman MT, Padilla J, et al. (2017) Vascular Adaptation to Exercise in Humans: Role of Hemodynamic Stimuli. Physiol Rev 97: 495-528. https://doi.org/10.1152/physrev.00014.2016
|
| [153] |
Dreyer HC, Fujita S, Cadenas JG, et al. (2006) Resistance exercise increases AMPK activity and reduces 4E-BP1 phosphorylation and protein synthesis in human skeletal muscle. J Physiol 576: 613-624. https://doi.org/10.1113/jphysiol.2006.113175
|
| [154] |
Case N, Thomas J, Sen B, et al. (2011) Mechanical regulation of glycogen synthase kinase 3β (GSK3β) in mesenchymal stem cells is dependent on Akt protein serine 473 phosphorylation via mTORC2 protein. J Biol Chem 286: 39450-39456. https://doi.org/10.1074/jbc.M111.265330
|
| [155] |
Mu J, Brozinick JT, Valladares O, et al. (2001) A role for AMP-activated protein kinase in contraction- and hypoxia-regulated glucose transport in skeletal muscle. Mol Cell 7: 1085-1094. https://doi.org/10.1016/s1097-2765(01)00251-9
|
| [156] |
Geirsdottir OG, Arnarson A, Briem K, et al. (2012) Effect of 12-week resistance exercise program on body composition, muscle strength, physical function, and glucose metabolism in healthy, insulin-resistant, and diabetic elderly Icelanders. J Gerontol A Biol Sci Med Sci 67: 1259-1265. https://doi.org/10.1093/gerona/gls096
|
| [157] |
Malin SK, Gerber R, Chipkin SR, et al. (2012) Independent and combined effects of exercise training and metformin on insulin sensitivity in individuals with prediabetes. Diabetes Care 35: 131-136. https://doi.org/10.2337/dc11-0925
|
| [158] |
Dai X, Zhai L, Chen Q, et al. (2019) Two-year-supervised resistance training prevented diabetes incidence in people with prediabetes: A randomised control trial. Diabetes Metab Res Rev 35: e3143. https://doi.org/10.1002/dmrr.3143
|
| [159] |
Pate RR, Pratt M, Blair SN, et al. (1995) Physical activity and public health. A recommendation from the Centers for Disease Control and Prevention and the American College of Sports Medicine. JAMA 273: 402-407. https://doi.org/10.1001/jama.273.5.402
|
| [160] |
Garber CE, Blissmer B, Deschenes MR, et al. (2011) American College of Sports Medicine position stand. Quantity and quality of exercise for developing and maintaining cardiorespiratory, musculoskeletal, and neuromotor fitness in apparently healthy adults: guidance for prescribing exercise. Med Sci Sports Exerc 43: 1334-1359. https://doi.org/10.1249/MSS.0b013e318213fefb
|
| [161] |
Imierska M, Kurianiuk A, Błachnio-Zabielska A (2020) The Influence of Physical Activity on the Bioactive Lipids Metabolism in Obesity-Induced Muscle Insulin Resistance. Biomolecules 10: 1665. https://doi.org/10.3390/biom10121665
|
| [162] |
Zanuso S, Sacchetti M, Sundberg CJ, et al. (2017) Exercise in type 2 diabetes: genetic, metabolic and neuromuscular adaptations. A review of the evidence. Br J Sports Med 51: 1533-1538. https://doi.org/10.1136/bjsports-2016-096724
|
| [163] |
Zouhal H, Zare-Kookandeh N, Haghighi MM, et al. (2021) Physical activity and adipokine levels in individuals with type 2 diabetes: A literature review and practical applications. Rev Endocr Metab Disord 22: 987-1011. https://doi.org/10.1007/s11154-021-09657-x
|
| [164] |
Li C, Bishop TRP, Imamura F, et al. (2024) Meat consumption and incident type 2 diabetes: an individual-participant federated meta-analysis of 1·97 million adults with 100 000 incident cases from 31 cohorts in 20 countries. Lancet Diabetes Endocrinol 12: 619-630. https://doi.org/10.1016/S2213-8587(24)00179-7
|
| [165] |
Albosta M, Bakke J (2021) Intermittent fasting: is there a role in the treatment of diabetes? A review of the literature and guide for primary care physicians. Clin Diabetes Endocrinol 7: 3. https://doi.org/10.1186/s40842-020-00116-1
|


Figures(3)

Nicola Tecce, Mattia Proganò, Davide Menafra, Annamaria Docimo, Stefano Zarrilli, Roberta Scairati, Anna Lisa Pelosi, Rosario Pivonello, Annamaria Colao. Integrated strategies for type 2 diabetes prevention: The role of diet and exercise[J]. AIMS Public Health, 2025, 12(2): 418-450. doi: 10.3934/publichealth.2025024


 DownLoad: