Figure 1.
Conceptual framework.


Citation: Larry E. Erickson, Merrisa Jennings. Energy, Transportation, Air Quality, Climate Change, Health Nexus: Sustainable Energy is Good for Our Health[J]. AIMS Public Health, 2017, 4(1): 47-61. doi: 10.3934/publichealth.2017.1.47
| [1] | Amir Khorram-Manesh, Lesley Gray . Global health and human well-being – A systematic review. AIMS Public Health, 2025, 12(2): 310-328. doi: 10.3934/publichealth.2025019 |
| [2] | Cathy Bailey, Philip Hodgson . On the Defence: UK cultural narratives of mistrust between energy users and providers. AIMS Public Health, 2018, 5(1): 31-48. doi: 10.3934/publichealth.2018.1.31 |
| [3] | Bethany M. Kwan, Aimee B. Valeras, Shandra Brown Levey, Donald E. Nease, Mary E. Talen . An Evidence Roadmap for Implementation of Integrated Behavioral Health under the Affordable Care Act. AIMS Public Health, 2015, 2(4): 691-717. doi: 10.3934/publichealth.2015.4.691 |
| [4] | Sumanta Das, Malini Roy Choudhury, Bhagyasree Chatterjee, Pinanki Das, Sandeep Bagri, Debashis Paul, Mahadev Bera, Suman Dutta . Unraveling the urban climate crisis: Exploring the nexus of urbanization, climate change, and their impacts on the environment and human well-being – A global perspective. AIMS Public Health, 2024, 11(3): 963-1001. doi: 10.3934/publichealth.2024050 |
| [5] | Wanda Martin, Bernie Pauly, Marjorie MacDonald . Situational Analysis for Complex Systems: Methodological Development in Public Health Research. AIMS Public Health, 2016, 3(1): 94-109. doi: 10.3934/publichealth.2016.1.94 |
| [6] | Dreaves Hilary A . How Health Impact Assessments (HIAs) Help Us to Select the Public Health Policies Most Likely to Maximise Health Gain, on the Basis of Best Public Health Science. AIMS Public Health, 2016, 3(2): 235-241. doi: 10.3934/publichealth.2016.2.235 |
| [7] | Gabriele Messina, Giuseppe Spataro, Laura Catarsi, Maria Francesca De Marco, Anna Grasso, Gabriele Cevenini . A mobile device reducing airborne particulate can improve air quality. AIMS Public Health, 2020, 7(3): 469-477. doi: 10.3934/publichealth.2020038 |
| [8] | Rolf Nieder, Dinesh K. Benbi . Integrated review of the nexus between toxic elements in the environment and human health. AIMS Public Health, 2022, 9(4): 758-789. doi: 10.3934/publichealth.2022052 |
| [9] | Zijian Li, Aaron A. Jennings . Implied Maximum Dose Analysis of Standard Values of 25 Pesticides Based on Major Human Exposure Pathways. AIMS Public Health, 2017, 4(4): 383-398. doi: 10.3934/publichealth.2017.4.383 |
| [10] | Sushant K Singh . COVID-19: A master stroke of Nature. AIMS Public Health, 2020, 7(2): 393-402. doi: 10.3934/publichealth.2020033 |
The consumption of organic food has developed into a new trend as a way to a more sustainable paradigm. Accordingly, the purchase of organic food has increased worldwide. Although the sale of organic food is still centered in developed countries such as the United States, Canada, and several major European countries (Germany, France, United Kingdom, and Italy), the concept of organic farming is accepted in developing countries because one-third of the world's land is managed organically be there [1]. This becomes an opportunity in the development of organic consumerism in developing countries.
In Indonesia, which is a developing country, organic food consumers are still concentrated in big cities, with middle-class households with higher education [2]. Although the government has been supporting the development of organic food in Indonesia [3], official organic food consumption data are not yet available on a national scale. According to the data released by the Indonesian Organic Alliance in 2017, 94% of the respondents consumed organic food for health reasons, while the rest did so to protect the environment and keep up with trends. The most frequently consumed organic foods are vegetables, followed by rice and fruits [4]. Furthermore, the data in 2019 reported that only 7.92% of 274 respondents were regular consumers of organic food.
To identify and target the consumers of organic food in Indonesia, it is important to understand the factors behind consumers' motivations to purchase organic food [5]. Few publications are focusing on the discussion on organic agriculture in Indonesia, particularly on the consumer aspect [2]. The results of research on consumer attitudes and behavior on the purchase and consumption of organic food from the perspective of developed countries may differ from those of developing countries [6]. Based on the understanding of these factors, marketers and policy makers can develop private and public strategies aimed at increasing the consumption of organic food in Indonesia.
The theory of planned behavior (TPB) has been widely used as a framework for understanding the buying and consumption of organic food [1,6,7,8,9,10]. TPB said that intention to perform a given behavior is the best predictor of actual behavioral performance, wherein intention is determined by three sociopsychological constructs: attitudes, subjective norms, and perceived behavioral control [11,12]. However, other variables like background factors that influence the dimensions in the basic theory of TPB can be considered in line with TPB which is open to develop [13].
Literature has focused on the study of consumer behavior by attempting to investigate the consumer perceptions of organic food and the factors that influence the behavior to choose to consume organic food [10]. Consumers are judged to place a high value on the benefits of sensory characteristics and seek out the specific traits that engage all the senses and stimulate deeper associations with the products they consume [14,15]. Nonetheless, researchers [16] note a lack of effort to investigate the role of sensory attractiveness (appearance, taste, aroma, and texture) in investigating organic food consumption.
Previous research has also shown that the decision to buy organic food is influenced by the perceptions of good taste, health, environmental benefits, and animal welfare [17]. Consumer attention to nutrition and healthy eating patterns has revealed that the attributes associated with healthy food become as important as the attributes related to the flavor or sensory appeal. Consumer's increasing demand for organic food may also be attributed to their increased social awareness, triggering their willingness to pay more for the products that are safer for the environment or more ethical than conventional products [18].
Furthermore, studies on evolving consumer emotions have depicted that consumers can help predict better [19]. When consumers engage in pro-social and pro-environmental behavior, like purchasing organic products, they are identified to gain psychological benefits in the form of emotional experiences [20]. This situation demonstrates another benefit that consumers receive despite having to pay higher prices than conventional products for altruistic reasons. In the long run, this motivation leads to increased consumption of organic food [21]. However, the studies linking the psychological benefits obtained in the context of organic food consumerism with an individual's attitude or intention to re-consume organic food are still rare.
Research that explains the role of perceived health benefits (egoistic motives) and perceived psychological benefits on pro-environmental and pro-environmental behavior (warm glow) as well as the influence of perceptions of sensory appeal using the complete TPB model is still lacking [22,23,24,25]. To fill the gap in the literature, this study proposes a full TPB model by adding egoistic motives, warm glow, and sensory appeal perception that might influence attitudes and intentions. Furthermore, this study pioneered how the warm glow motif affects the buying behavior of consumers of organic food in Indonesia.
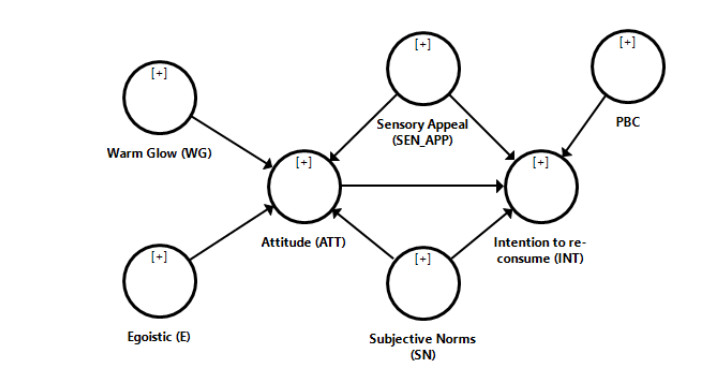
The conceptual model of this study is based on the theory of planned behavior [11], as it has been widely used as a framework for understanding the purchase and consumption of organic food [1,6,7,8,9,10,23,24,25]. TPB shows that human behavior is the result of careful planning [11]. In this study, consumer's intention to re-consume organic food is used to describe future organic food consumption behavior as actual behavior. This is because the TPB theorizes that the intention to perform a particular behavior is the best direct predictor of actual behavioral performance [11]. Stronger intentions to engage in certain behaviors usually result in that behavior [11,26]. Although, there are a gap between intention and behavior which is empirical studies in the field of pro-environmental and ethical buying behavior have found that strong intentions may not result in purchasing behavior [7,12,27]. The gap has drawn criticism against TPB and a strategy is needed to strengthen the intention to manifest it in real behavior [28,29]. Such gaps may occur when consumers may intend to buy a product but then face barriers related to psychological (e.g. trust, satisfaction, learning and motivation), economic (e.g. affordability) and physical (e.g. distance and availability) factors in making purchasing decisions [7].
Intention reflects motivation and cognitive planning to engage in behavior, which is determined by the three tractors in the basic concept of TPB, including attitude, subjective norms, and perceived behavioral control (PBC) [9]. Attitude towards behavior refers to the extent to which a person has a positive or negative evaluation or assessment of the consequences of behavior [11]. Because the relationship between attitudes and behavioral intentions in the TPB framework is considered the strongest among others, attitude becomes an important factor in prediction [7]. This is supported by the previous research, which has reported that attitudes significantly affect the intentions of organic consumers, both in developed countries [9,17,30,31] and in developing countries [1,12,20,23,32]. In addition, attitudes reflect individual preferences to perform or not to perform a behavior [6].
Subjective norms describe the views of other people (in the consumer environment) on consumer choices to consume organic food. Furthermore, subjective norms shape the perceived social pressure to engage in behavior [9]. In general, subjective norms form consumer behavior based on agreed-upon elements in community customs or traditional views [7]. Ajzen [11] states that the global measure of subjective norms is the extent to which other people important to an individual approve or disapprove of his or her behavior. Subjective norms reflect the level of an individual's desire to adjust to his social group, including teachers, colleagues, parents, admired people, and other social groups [6], which then encourages individuals to do or not do certain behaviors.
Several studies on organic food consumption have found a strong and significant relationship between subjective norms and organic food consumption intentions [7,9,33]. In addition, Ajzen [34] has acknowledged that attitudes and subjective norms may be interdependent. Researchers [30] have proposed a TPB model that shows the influence of subjective norms on the attitudes of organic food consumers in Finland.
PBC, according to researchers [11], is based on individual beliefs about its influence on situations as well as internal factors that facilitate behavior. PBC is related to the individual's belief in the self ability to carry out the behavior. TPB regards behavior as a concept that must include both voluntary and involuntary components. Furthermore, based on TPB, individuals who have a positive attitude towards organic food, believe that there is normative support for its consumption and find it easy for consumers to consume [35]. Thus, the following hypothesis is advanced:
H1: Attitude, subjective norms, and PBC has a positive and significant effect on the intention to re-consume organic food in the future.
Although TPB has been reported successful in predicting behavior, the theory keeps evolving, and various researchers have expressed confidence that for certain behaviors and contexts, the addition of other variables can improve the model's predictive ability [35]. Scholars [13] have suggested that the TPB model is inherent to modification and the addition of additional predictors. Therefore, there is a growing body of evidence in the recent literature supporting the inclusion of predictor variables in TPB. Researchers [36] added that individual characteristics such as values can increase the predictive power of TPB. In the context of developing countries, health, beliefs about organic food, and quality were discovered to be the most influential factors on the intention to consume organic food [37]. This study also attempts to incorporate new constructs related to food values/attributes, namely sensory attractiveness, warm glow, and egoistic motivation in TPB, by taking the support from the existing literature.
The sensory aspect of food has been reported to be the most important factor in food selection [18]. Sensory attributes relate to the appearance, smell, and taste of food. Other studies have also found that sensory characteristics are significant determinants of purchasing organic food [38,39]. The sensory appeal is identified as one of the categories of product quality that add value to organic food production besides its ethical values [40,41]. According to researchers [14], consumers place a high value on the hedonistic benefits of food as well as sensory characteristics and seek out particular traits that involve all the senses to stimulate deeper associations with the product. Sensory attributes of organic food may stimulate emotional influence/consumer experience, resulting in organic food evaluations that are primarily based on these values [18]. Therefore, the following hypothesis is proposed:
H2: Consumer perceptions of the sensory appeal attribute of organic food have a positive and significant effect on consumer attitudes an consumers' intention to re-consume organic food in the future.
The literature related to consumption shows that selfish (pro-self) values are an important driving factor in behavioral decision-making. This is consistent with the general belief that individuals are selfish or prioritize their interests, which are then reflected in individual consumption behavior [21]. Concern for one's health demonstrates the concept of pro-self, which can be interpreted as selfish [42]. Consumers want what they eat to be at least harmless (safe for consumption), especially when it comes to food [43]. Consumers gradually became more concerned about the health, quality, and nutritional value of food [44] and slowly put aside the issue of price. It further motivates people to change dietary habits [1].
Organic food is considered healthier because it is produced with fewer harmful chemical fertilizers and synthetic pesticides [45]. Increased awareness of health aspects directs consumers to engage in organic consumption behavior that is considered to improve or maintain their health. Individuals with a high level of health awareness are more likely to adhere to dietary recommendations and are more concerned with the desired nutrition. Furthermore, food safety concerns are a factor to consider when purchasing organic food. Individuals expect organic food to be consumed as a non-harmful product to the body [46,47].
A growing body of literature on organic food consumption indicates that health and food safety concerns are among the important drivers of positive attitudes. Researchers mentioned that consumers who are more concerned with their health problems have better attitudes towards purchasing organic products [5]. Several previous studies have also supported health care as a major factor motivating consumer attitudes [48,49,50]. In this study, the egoistic value is described by consumers' concern for personal health and food safety because they best represent personal interests in consumption motives.
Organic food consumption is concerned not only with personal aspects such as health but also with the environment, where organic food is considered to have a less negative impact than conventionally grown food, as well as supports local economic welfare [51]. The action is pro-environmental and pro-social, with an altruistic value. Altruistic values have been conceptualized as part of a personal value structure or overall guiding principle that motivates individuals to contribute to the well-being of others or society as a whole [52,53]. Altruism involves actions to improve the welfare of others which then incur personal costs but tend to ignore personal gains [21,54].
The consumer's desire to consume products that indirectly contribute to environmental sustainability also supports the welfare of farmers by selecting organic food ingredients, requiring consumers to incur additional costs. Recent studies suggest that seeking pleasure and pursuing happiness may be important motives for pro-social and pro-environmental behavior [21]. According to a study of organic food, consumers experience psychological benefits when engaging in altruistic behavior [20]. Even though the price of organic food is high, the psychological benefit is considered as an additional reward [55].
Findings related to psychological benefits that become motives for pro-social/pro-environmental behavior support the emerging debate regarding whether there are truly altruistic individuals without considering their interests. Further, researchers [56] refer to the rewards obtained in the form of emotional experiences for pro-social/pro-environment actions as a warm glow of giving [57], in which individuals may be motivated by both egoistic and altruistic motives, impurely altruist. Consumers with socially and environmentally responsible behavior experience an intrinsic warm feeling. It can lead to positive attitudes toward behavior as a result of contributing to the common good [17]. Therefore, the following hypothesis is proposed:
H3: Warm glow and egoistic motive from pro-environmental and pro-social behavior has a positive and significant effect on consumer attitudes toward organic food.
Based on the discussion, a research theoretical framework has been developed, as presented in Figure 1.
An online survey was conducted on Indonesian consumers from September 2020 to October 2020. The research questionnaires were administered and distributed through an online survey platform. An online survey collects information from people who respond to a form or instrument that is distributed through internet channels. Online surveys have several advantages and disadvantages. They are easy to conduct using free platforms, e.g Google forms. They can be quickly created and distributed with global reach. Furthermore, online surveys are completed only by persons who are literate and who have access to the internet, and by those who are sufficiently biased to be interested in the subject [58]. Although online surveys may exclude a target population that does not have internet access, the benefits of Indonesia's wide geographical reach and the usual reduction in social desire are the reasons for adopting the online approach [59]. With the limitation, the small reach of researchers doing snowball techniques made the number of samples may not be able to generalize the population of organic consumers in Indonesia.
This online survey was conducted using Google forms platforms which were distributed in a snowball technique through Individual emails, Mailing Lists, and Social media platforms with both individually and in groups (WhatsApp, Facebook, Instagram, and Telegram). Pretest was carried out on 50 online consumers to ensure the fluency and understanding of the questionnaire. Through pretesting, ambiguous and imprecise questions were modified. To avoid filling out surveys repeatedly, each IP address was limited to one survey participation. To meet the survey requirements, respondents had to be at least 17 years old and had purchased organic food, including rice, vegetables, fruit, and animal protein, such as chicken eggs or meat [7]. Responses from the respondents were obtained and then screened, which yielded 337 respondents who met the criteria for further analysis.
The survey measurements were compiled from the previous studies and then modified for this study. The questionnaires in this study were written in Indonesian to facilitate the equating of meaning for each measurement item. The questionnaire was divided into two parts. The first section covers demographic characteristics, including age, gender, education level, marital status, and occupation. The second part of the questionnaire includes a series of questions used to measure the intention to re-consume (INT), attitude (ATT), subjective norms (SN), perceived behavior control (PBC), perceived sensory appeal (SEN_APP), warm glow (WG), and egoistic motivation (E).
Based on Ajzen's recommendation [35], a scale containing multiple items was developed to measure each measurement item. Respondents in this study were asked to provide a scale responding agree or disagree with the statements presented to measure each variable using a five-point Likert scale (from very low = 1 to very high = 5). Questionnaire items and sources of literature adoption are presented in Table 1.
Partial Least Squares-Structural Equation Modeling (PLS-SEM) was used to test the direct effect of the proposed model. PLS is an SEM technique based on an iterative approach that maximizes the described variance of endogenous constructs. In contrast to CB-SEM, which seeks to validate theory by determining how well a model can estimate the covariance matrix for sample data, PLS-SEM functions similarly to multiple regression analysis. PLS is frequently used to address several issues that SEM encounters, including, namely (1) abnormal data; (2) small sample size; and (3) formally measured constructs [60].
PLS-SEM is able to modeling a latent constructions under abnormal conditions with small to medium sample sizes. Furthermore, PLS-SEM can work with reflective and/or formative indicators [7]. PLS-SEM does not strictly require study data to follow a normal distribution. According to researcher [61], PLS is an appropriate model for compiling research that focuses on prediction and theory development. In this research, TPB was developed by introducing several new variables into the model. Finally, PLS-SEM was considered to be able to identify the most effective variables in understanding the consumption behavior of organic food. Therefore, PLS-SEM was adopted in this study.
The steps that must be taken in the SEM-PLS analysis include designing model specifications, evaluating the outer model, and evaluating the inner model. The inner and outer models are defined during the model specification stage. The inner model, also known as the structural model, depicts the relationships between the latent constructs under consideration. The items presented in Table 1 serve as reflective indicators of their respective constructs. Furthermore, the outer model, also known as the measurement model, was used to assess the relationship between the manifest indicator variable and the corresponding latent construct. Therefore, the PLS model was interpreted in two stages. First, validity and reliability in the measurement model were assessed. Second, the structural model was measured by evaluating the explanatory power and the significance level of the path coefficients.
| Variable | Item | Measurement Item | Source |
| Intention to re-consume (INT) | INT1 | I intend to repurchase organic foods. | [17,35] |
| INT2 | I intend to eat more organically processed foods in the future. | ||
| INT3 | I would like to repurchase organic food because it is the best option. | ||
| INT4 | I would like to reintroduce organic food, particularly environmentally friendly products. | ||
| INT5 | I would like to re-consume organic food, preferably healthy and nutritious food. | ||
| INT6 | For the welfare of farmers, I would like to re-consume organic food. | ||
| Attitude (ATT) | ATT1 | Buying organic food is a good idea. | [17,35,62] |
| ATT2 | Buying organic food is a wise decision. | ||
| ATT3 | Buying organic food is important. | ||
| ATT4 | Consuming organic food is advantageous. | ||
| ATT5 | Consuming organic food is valuable. | ||
| ATT6 | Consuming organic food is interesting. | ||
| ATT7 | I like organic food because it is processed without the use of chemicals. | ||
| ATT8 | I like organic food because it is more nutritious. | ||
| ATT9 | I like organic food because it is healthier to consume. | ||
| ATT10 | I like organic food because it is environmentally friendly. | ||
| ATT11 | I like organic food because it allows me to contribute to the well-being of farmers. | ||
| Subjective norms (SN) | SN1 | Most of the people important to me think that I should eat organic food. | [62,63,64] |
| SN2 | My family believes that I should consume organic food. | ||
| SN3 | People whose opinions I value believe that I should consume organic food. | ||
| SN4 | My friend's positive feedback encourages me to consume organic food. | ||
| SN5 | My loved ones expect me to consume organic food. | ||
| SN6 | Because of external pressure (social, environmental, network, etc.), I choose organic food. | ||
| Perceived Behavior Control (PBC) | PBC1 | It is entirely up to me whether or not I buy organic food. | [17,62,63,64] |
| PBC2 | Consumers believe they can buy organic food. | ||
| PBC3 | Consumers believe they have the resources, time, and willingness to buy organic food. | ||
| PBC4 | Customers believe that they have control over whether or not they consume organic food. | ||
| PBC5 | Consumers believe that there will be numerous opportunities for them to consume organic food. | ||
| PBC6 | Consumers find it simple to consume organic food. | ||
| PBC7 | Consumers believe they can consume organic food if they desire to do so. | ||
| Sensory Appeal Perceived (SEN_APP) | SEN_APP1 | In my opinion, organic food is more attractive. | [18,40,62,65] |
| SEN_APP2 | In my opinion, organic food appears to be tasty. | ||
| SEN_APP3 | In my opinion, organic food looks fresher. (especial for rice, in question is natural / no over-processing after harvest) | ||
| SEN_APP4 | In my opinion, organic food has a pleasant texture. | ||
| Warm Glow (WG) | WG1 | Buying organic food gives me a pleasant feeling. | [17,21,51,66,67] |
| WG2 | Consuming organic food makes me happy because it makes me feel that I have done something good. | ||
| WG3 | I am happy when I can make choices to consume organic food, for myself and my family. | ||
| WG4 | Every time I consume organic food, I feel good about myself because I have protected the environment. | ||
| WG5 | I am satisfied because I have contributed to the efficiency of natural resources by consuming organic food. | ||
| WG6 | Consuming organic food makes me feel good because it contributes to the preservation of the quality of the Earth (soil, water, etc.). | ||
| WG7 | Purchasing organic food makes me happy because I am contributing to the well-being of farmers. | ||
| WG8 | I am pleased that I have contributed to the growth of the local economy by purchasing organic food. | ||
| Egoistic motive (E) | E1 | I eat organic food to better maintain my health. | [1,23,45,68] |
| E2 | Organic food is the food that my family consumes for the sake of our family's health. | ||
| E3 | I eat organic food to provide my body with more nutrition. | ||
| E4 | I choose organic foods to obtain products that are safer to consume. |
 DownLoad:
CSV
DownLoad:
CSV
The demographic characteristics of the 337 respondents are reported in Table 2. According to the age classification by the Ministry of Health of the Republic of Indonesia, the majority of the participants are under the age of 35, implying that the respondents in this study are young organic food consumers. The samples are not gendered balanced, i.e. the majority of consumers are women. Consumers with a bachelor's degree dominate the samples. Organic food consumers in this study are working people, with more than 60% of the total respondents are single.
| Demographic Variable | N | % | |
| Age (years old) | 17–25 | 179 | 53.12 |
| 26–35 | 97 | 28.78 | |
| 36–45 | 25 | 7.42 | |
| 56–55 | 31 | 9.20 | |
| > 56 | 5 | 1.48 | |
| Gender | Male | 95 | 28.19 |
| Female | 242 | 71.81 | |
| Education qualification | Higher secondary | 52 | 15.43 |
| Graduate | 212 | 62.91 | |
| Postgraduate | 71 | 21.07 | |
| Any other | 2 | 0.59 | |
| Marital status | Single | 210 | 62.31 |
| Married | 127 | 37.69 | |
| Employment status | Employed | 171 | 50.74 |
| Unemployed | 12 | 3.56 | |
| Retired | 2 | 0.59 | |
| Homemaker | 37 | 10.98 | |
| Student | 115 | 34.12 | |
DownLoad:
CSV
The measurement model used in this study is a reflective model, where the existence of indicators reflects the latent variables. Evaluation of the measurement model, also known as the outer model, is carried out by checking the value of indicator reliability, internal consistency reliability, convergent validity, and discriminant validity [60]. The reliability of the indicator is determined based on the value of the outer loading. The value of the outer loading or factor loading of an indicator must be > 0.70 [69]. The outer loading value between 0.40 and 0.70 needs to be considered by looking at the AVE value and indicators with an outer loading value < 0.40 must be removed. If the outer loading value meets the criteria, the indicator reliability is said to be feasible, and it can be used to evaluate other measurement models in the future.
Factor loading is a discriminant parameter that indicates how well an item can distinguish itself from others. Based on the evaluation results on the outer loading value (Appendix 1 (1)), all items have exceeded the limit of 0.7 (except SN6 on subjective norms and PBC1 on perceived behavioral control) and are considered significant on the latent variable. It can be concluded that the internal consistency reliability has met the criteria. SN6 and PBC1 (with insufficient charge) are excluded from further analysis. Furthermore, an evaluation of the reliability of internal consistency is carried out which is known based on the composite reliability value. In contrast to Cronbach's alpha, the value of composite reliability does not assume that all indicators are reliable. Composite reliability values are interpreted in the same way as Cronbrach Alpha [69].
Table 3 presents that the composite reliability value is > 0.70. Therefore, it means that the internal consistency reliability has met the criteria. The average variance extracted (AVE) value is used to confirm the defined convergent validity of the next measurement model. The AVE value of all constructs in this study, as presented in Table 3, has exceeded the recommended value of 0.5. This is consistent with the criteria, implying that the latent variable accounted for more than half of the indicator variance [69]. Furthermore, an evaluation of the discriminant validity is carried out. One of the discriminant validity of the reflective model can be evaluated based on the value of cross loading and the value of Heterotrait-Monotrait Ratio (HTMT). Based on the results summarized in Appendix 1 (2), it is known that, following the evaluation, the cross-loading value of each indicator is greater than the outer loading value to other constructs, indicating that the discriminant validity, based on the cross-loading value, meets the criteria.
| CR | AVE | 1 | 2 | 3 | 4 | 5 | 6 | 7 | |
| 1.Attitude | 0.953 | 0.649 | |||||||
| 2.Egoistic motive | 0.943 | 0.806 | 0.808 | ||||||
| 3.Intention to re-consume | 0.955 | 0.781 | 0.589 | 0.536 | |||||
| 4.PBC | 0.918 | 0.650 | 0.531 | 0.485 | 0.605 | ||||
| 5.Sesory appeal | 0.905 | 0.705 | 0.524 | 0.365 | 0.541 | 0.485 | |||
| 6.Subjecctive norms | 0.931 | 0.731 | 0.473 | 0.345 | 0.394 | 0.401 | 0.476 | ||
| 7.Warm Glow | 0.959 | 0.747 | 0.768 | 0.689 | 0.547 | 0.494 | 0.452 | 0.394 |
DownLoad:
CSV
HTMT is the best and latest way to determine discriminant validity [62]. The threshold criteria for the HTM value is < 0.90. All variables are known to have HTMT values < 0.90, as presented in Table 3. Thus, it is possible to conclude that the discriminant validity based on the cross-loading and HTMT values is good and meets the criteria. Based on all evaluations of the measurement model that have been carried outperformed, it is known that the indicators in this research model are valid and reliable, allowing for further evaluation of the structural model.
A structural model for organic food consumption is evaluated in the second stage of analysis. To investigate the hypothesis of this study, the structural model is assessed by examining the coefficient of determination (R2) and the appropriate t-values through bootstrap with a 5000 repeat sample. In addition to these indicators, it is necessary to report the effect size (f2 value) and predictive relevance (Q2) [60].
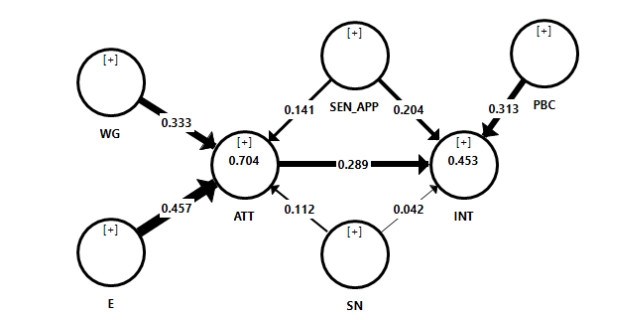
The R-square coefficient represents the combined effect of exogenous variables on endogenous latent variables. R-Square values ranged between 0 and 1 with higher values indicating predictive accuracy. In this model, the R2 value of the endogenous variable of attitude is 0.704 and the endogenous variable of intention to consume organic food again in this model is 0.453 (Figure 2). This depicts that together egoistic motive, warm glow, subjective norms, and perceived sensory appeal account for 70.4% of the variance in attitudes. Meanwhile, attitudes, subjective norms, PBC, and perceived sensory appeal together explain 45.3% of the variance in the intention to consume organic food again in the future.
The R-Square value of 0.20 is said to be high for disciplines such as consumer behavior [60]. However, in research related to satisfaction and loyalty, it is expected to be higher, namely greater than 0.75. According to the researchers [70], the value of 0.63 is said to be substantial, the value of 0.33 is moderate, and 0.19 is weak. Referring to these criteria, the R-Square value of the attitude variable in this study is substantial while the intention variable is moderate.
Table 4 demonstrates the results of the structural equation path coefficients and summarizes the results of hypothesis testing as shown in Figure 2. It can be seen the direct relationship of each variable. Sensory appeal (β = 0.141, p = 0.006), egoistic motive (β = 0.457, p = 0.000), warm glow (β = 0.333, p = 0.000) are positively and significantly related to consumer attitudes. Therefore these path, SN→ATT, SEN_APP→ATT, E→ATT, and WG→ATT, are supported. Furthermore, attitude (β = 0.289, p = 0.000), PBC (β = 0.313, p = 0.000), sensory appeal (β = 0.204, p = 0.002) are positively and significantly related to the intention to re-consumption of organic food in the future. However, subjective norms (β = 0.042, p = 0.414) have no significant effect on the intention to re-consume organic food in the future. Thus, ATT→INT, PBC→INT, and SEN_APP→INT are supported, while SN→INT is rejected.
| Hypothesis | Path | Std Beta | t-value | Result | f2 |
| H1 | ATT → INT | 0.289 | 3.518* | Supported | 0.097 |
| SN → ATT | 0.112 | 3.271* | Supported | 0.033 | |
| SN → INT | 0.042 | 0.816ns | Rejected | 0.002 | |
| PBC → INT | 0.313 | 4.738* | Supported | 0.125 | |
| H2 | SEN_APP → ATT | 0.141 | 2.763* | Supported | 0.050 |
| SEN_APP → INT | 0.204 | 3.045* | Supported | 0.052 | |
| H3 | E → ATT | 0.457 | 8.594* | Supported | 0.405 |
| WG → ATT | 0.333 | 7.542* | Supported | 0.197 | |
| Note: *p < 0.05. | |||||
DownLoad:
CSV
In addition to evaluating the R-Square value of all endogenous variables, the change in the R-Square value when certain exogenous variables are removed from the model can be used to determine whether the omitted exogenous variables have a substantive impact on the endogenous variables. This measure is referred to as the F-Square effect value. The criteria for assessing the F-Square is a value of 0.02 which describes a small effect, a value of 0.15 which describes a moderate effect, and a value of 0.35 describes a large influence of the exogenous latent variable on the R-Square value of the endogenous latent variable [60]. In this study, it is known that egoistic motive has a large effect on consumer attitudes and warm glow also has a moderate effect. Thus, the addition of the two exogenous variables constructs explains the attitude variance well.
In addition, the predictive relevance of the model (Q2) using the blindfolding procedure was assessed. If the Q2 value is greater than 0 the model has predictive relevance for a particular endogenous construct. The relative measures of predictive relevance, values of 0.02, 0.15, and 0.35 indicate that exogenous constructs have small, medium, or large predictive relevance for certain endogenous constructs [60]. In this study, the value of Q2 attitude is 0.44 while the intention is 0.35. Thus, showing that the model has great predictive relevance.
The main objective of this study is to identify the factors that explain attitudes and intentions to re-consuming organic food in the future in the case of Indonesia. This study focuses on consumers already consumed organic products and want to know how this organic consumption practice can become a habit. In this study, the strongest antecedent of behavior, intention, is used to predict future behavior. TPB is applied as the theoretical framework for this study, which is then expanded to include new constructions. The findings have revealed that attitudes and perceived behavioral control have a significant positive effect on the future intentions to re-consume organic food, while subjective norms fail to show a significant effect on purchase intention. Furthermore, the addition of the perceived sensory appeal construct shows a significant positive effect on the intention.
Perceived behavioral control has emerged as the most significant determinant of intention to re-consume organic food in the future. This finding is consistent with the outcomes of the previous studies [1,9,63]. This shows that consumers can control their behavior through internal control over the extrinsic factors associated with purchasing organic food. According to the researcher [9], the greatest impact of PBC on intentions might suggest that the low consumption of organic food could be overcome by increasing product availability. Lack of availability is one of the main barriers to organic food consumption [10,68]. Furthermore, attitudes are identified to be better antecedents of intentions. This supports previous findings, which state that attitudes play a significant role in behavioral intentions [1,9,32,71]. Therefore, it is important to pay close attention to the factors that shape consumer attitudes towards organic food.
In this study, subjective norms are non-significant predictors of intention to re-consume organic food. This is consistent with several previous studies [1,16,30,35] that found no direct relationship between subjective norms and intentions in developing countries. This may be because of organic food is a product that has only been consumed by a small number of people, so the practice of consuming organic food has not become a social norm in society. Subjective norms and attitudes, on the other hand, have yielded different results, indicating a significant positive relationship. As a result, the influence of other people's opinions shapes consumers' positive attitudes toward organic food ingredients. These findings support the proposed new model [30,72] of the relationship. Consumers' preference for organic food is influenced by how the people important to them believe about the consumption behavior. Consumers' positive (or negative) attitudes toward organic food purchases are "downgraded". Thus, people who favor organic food ingredients can influence the formation of other consumer attitudes. However, this influence does not directly shape the intention.
Furthermore, our findings suggest that sensory attributes may contribute to consumers' intention to re-consume organic food in the future. This exemplifies that consumer experiences with appearance, taste, texture and other attributes encourage consumers to re-consume the product. Similarly, sensory attractiveness has been proven to have a positive and significant effect on consumer attitudes, supporting the research findings [18] that sensory attractiveness is a variable that affects both consumer attitudes and purchasing behavior related to organic products. This shows a positive evaluation of the experience of consuming organic food to encourage intention. The theoretical and managerial implications discovered in this study are discussed further.
Finally, egoistic motive (concern for health) and impure altruistic motive (warm glow) have been proven to have a strong influence on the attitudes of consumers of organic food. These results suggest that the addition of these two constructs can adequately explain the attitude variance. The theoretical and managerial implications of these findings will be discussed in further detail depth later.
This study provides theoretical contribution by introducing the concept of impure altruism, namely the warm glow obtained from pro-environmental and pro-social behavior. In this study, pro-environmental behavior is defined as organic food consumption motivated by environmental concerns, while pro-social behavior is defined as organic food consumption motivated by the welfare of local farmers. Altruistic motives may be considered detrimental because they tend to disregard personal well-being [21], but Andreoni [56] introduces the concept of a warm glow of giving, which suggests that consumers derive psychological benefits from these altruistic actions. By taking these motives into account, it is possible to predict attitudes (better than purely altruistic motives), in addition to self-interest (egoistic motives).
Only a few studies apply warm glow in the case of pro-environmental behavior [67,73,74,75], especially in the case of organic food consumption [17,51] and this study contributes to the gap. Furthermore, these findings provide new insight for TPB. The results of this study indicate that the addition of egoistic and warm glow motives increases the explanatory power of attitudes. Furthermore, the addition of perceived sensory appeal complements the TPB model, particularly to predict the consumption behavior of organic food, which can be used as a managerial basis.
This research may not generally be a description of the behavior of organic consumers in Indonesia given the narrow sample obtained. But, this study can be an alternative reference for marketers and public policy makers who promote pro-environmental and pro-social products and behaviors, especially for young consumers considering the distribution of these respondents who are mostly young organic consumers. This current study has discovered that attitudes and PBC influence intentions in TPB. Online sales can be initiated in developing countries such as Indonesia. Furthermore, by disseminating information through food campaigns and attempting to create a positive image of organic food, marketers can make positive evaluations of organic food.
Subjective norm is reported to influence consumer attitudes. Consequently, marketers and public policymakers can use reference groups such as presidents/bureaucrats, celebrities, environmentalists, teachers, as well as testimonials from organic food consumers to highlight organic food consumption, which is expected to be a positive evaluation of others. A large number of people are typically interested in adopting the lifestyle of the reference group. In Indonesia, social media has become a platform favored by young consumers. In line with these findings, brands through social media such as artists on Instagram who campaign for the health and environmental benefits of organic food can be a good choice in a marketing strategy. Following up on the findings of sensory appeal that shape consumer attitudes and intentions, it can be concluded that sensory branding strategy can be used as a foundation for marketers to use in marketing organic food.
Marketers can further emphasize sensory attributes in promoting organic food, which is considered superior to conventional products. Likewise, consumer perceptions of the quality of organic rice that are tastier and more durable can be used as ingredients to promote organic rice. As well as the sensory advantage possessed by organic vegetables, which is fresher. Consumer satisfaction with organic attributes is expected to result in positive evaluations that encourage consumers to become regular consumers of organic food.
On the other hand, the significance of egoistic motive and warm glow becomes the basis for not only emphasizing appearance, taste, and other physical attributes but also introducing the values of organic food, as well as campaigning for organic as a healthy and safe food. Given that egoistic motives are the most powerful factor in explaining attitudes, advocating for the attributes of the belief in nutritional content and the benefits for health help consumers evaluate organic food positively. Other promotions can also be carried out by creating a warm glow when consumers see organic food advertisements. Marketing strategy emphasizes deeply the inner values, such as organic product advertisements that lead consumers to feel good because they contribute to social welfare. Consuming organic food, for example, implies the contribution to the preservation of the Earth, whereas purchasing organic food means that you have contributed to environmental sustainability. The campaign then raises the awareness of emotional rewards.
This study is limited to measuring the intention to re-consume organic food in the future and there is no measurement of actual consumption behavior. Although previous findings have supported that intention is positively correlated with behavior, many empirical studies have shown gaps in these results. To better explain this relationship and reduce this gap, experts have suggested moderator variables [76]. In further research, the action that can be taken to overcome this gap is to add a moderating variable of price perception. This is because high prices can prevent consumers with high purchase intentions from actually buying organic food [12]. The moderating effect of perceived price might provide insight into the strength of the relationship between intention and behavior.
In addition, further research related to intention to re-consume may involve behavioral variables of past organic food consumption. Past behavior can be an input for someone to behave. Past behavior reflects the control of various factors, both internal and external, which in the long run form a repetitive behavior. Previous studies have suggested that instead of deliberately considering the benefits of engaging in certain types of behavior, individuals can base their intentions on previously encountered experiences [29,77,78].
This study is limited to measuring organic food in the raw food category so that the results of this study cannot be generalized to processed products, such as milk, yogurt, and others. In this study, organic food was measured in general terms whereas previous studies have shown that consumption of organic food differs among various food products. Future research may be able to compare consumer intentions and behavior towards various ranges of organic food products.
The limited number of samples and respondents' own selection bias may also be a problem in this study as those who are more health conscious, pro-environmental and pro-social about organic food may be mostly in this study resulting in overrepresentation of these people in the sample. In addition, the respondents in this study were dominated by young consumers with higher education. This allows for a bias towards answers because consumers already have knowledge of organic food. Therefore, future research can be carried out by considering the consumer knowledge variable.
In the case of a developing country, Indonesia, this study has proven the application of the theory of planned behavior model, which is then expanded by adding a novel construct to measure the intention to re-consume organic food in the future. This study supports the general findings of the TPB and confirms that in the countries where organic consumption is uncommon, establishing subjective norms does not affect behavior. This study has contributed to the literature on organic food consumer behavior, particularly in developing countries, by including additional constructs, such as the perception of sensory attractiveness, egoistic motive, and warm glow. The addition of these constructs has improved the predictions of the theoretical framework because all of them significantly influence consumer attitudes and intentions. Some of the gaps in this research can be used as material for the development of further research. The results of this study can be used as a reference choice in the strategy of developing organic consumption in Indonesia.
| Items | Outer Loading | Cross Loading | ||||||||||||
| ATT | E | INT | PBC | SEN_APP | SN | WG | ATT | E | INT | PBC | SEN_APP | SN | WG | |
| SEN_APP.1 | 0.812 | 0.342 | 0.219 | 0.352 | 0.328 | 0.812 | 0.346 | 0.282 | ||||||
| SEN_APP.2 | 0.842 | 0.356 | 0.247 | 0.390 | 0.302 | 0.842 | 0.387 | 0.296 | ||||||
| SEN_APP.3 | 0.859 | 0.469 | 0.312 | 0.411 | 0.393 | 0.859 | 0.317 | 0.395 | ||||||
| SEN_APP.4 | 0.845 | 0.418 | 0.314 | 0.490 | 0.407 | 0.845 | 0.362 | 0.400 | ||||||
| WG.1 | 0.839 | 0.657 | 0.605 | 0.429 | 0.394 | 0.351 | 0.357 | 0.839 | ||||||
| WG.2 | 0.837 | 0.590 | 0.511 | 0.468 | 0.423 | 0.353 | 0.311 | 0.837 | ||||||
| WG.3 | 0.860 | 0.621 | 0.605 | 0.448 | 0.387 | 0.348 | 0.336 | 0.860 | ||||||
| WG.4 | 0.902 | 0.648 | 0.579 | 0.468 | 0.410 | 0.381 | 0.314 | 0.902 | ||||||
| WG.5 | 0.896 | 0.646 | 0.554 | 0.458 | 0.388 | 0.354 | 0.315 | 0.896 | ||||||
| WG.6 | 0.879 | 0.644 | 0.618 | 0.425 | 0.383 | 0.335 | 0.271 | 0.879 | ||||||
| WG.7 | 0.854 | 0.600 | 0.474 | 0.473 | 0.386 | 0.393 | 0.334 | 0.854 | ||||||
| WG.8 | 0.847 | 0.625 | 0.512 | 0.422 | 0.363 | 0.359 | 0.315 | 0.847 | ||||||
| SN.1 | 0.858 | 0.327 | 0.308 | 0.314 | 0.333 | 0.340 | 0.858 | 0.266 | ||||||
| SN.2 | 0.889 | 0.370 | 0.291 | 0.342 | 0.356 | 0.372 | 0.889 | 0.304 | ||||||
| SN.3 | 0.868 | 0.429 | 0.294 | 0.324 | 0.299 | 0.351 | 0.868 | 0.377 | ||||||
| SN.4 | 0.781 | 0.326 | 0.156 | 0.234 | 0.245 | 0.356 | 0.781 | 0.275 | ||||||
| SN.5 | 0.875 | 0.415 | 0.298 | 0.348 | 0.314 | 0.374 | 0.875 | 0.341 | ||||||
| PBC.2 | 0.807 | 0.347 | 0.386 | 0.454 | 0.807 | 0.323 | 0.302 | 0.353 | ||||||
| PBC.3 | 0.865 | 0.434 | 0.410 | 0.491 | 0.865 | 0.342 | 0.408 | 0.359 | ||||||
| PBC.4 | 0.746 | 0.337 | 0.296 | 0.415 | 0.746 | 0.321 | 0.192 | 0.359 | ||||||
| PBC.5 | 0.824 | 0.449 | 0.347 | 0.486 | 0.824 | 0.397 | 0.296 | 0.377 | ||||||
| PBC.6 | 0.766 | 0.369 | 0.331 | 0.376 | 0.766 | 0.349 | 0.328 | 0.376 | ||||||
| PBC.7 | 0.824 | 0.421 | 0.350 | 0.462 | 0.824 | 0.350 | 0.226 | 0.375 | ||||||
| E.1 | 0.899 | 0.682 | 0.899 | 0.420 | 0.357 | 0.281 | 0.296 | 0.583 | ||||||
| E.2 | 0.888 | 0.655 | 0.888 | 0.449 | 0.431 | 0.285 | 0.316 | 0.556 | ||||||
| E.3 | 0.907 | 0.702 | 0.907 | 0.463 | 0.402 | 0.299 | 0.301 | 0.584 | ||||||
| E.4 | 0.898 | 0.670 | 0.898 | 0.460 | 0.390 | 0.321 | 0.234 | 0.597 | ||||||
| INT.1 | 0.900 | 0.462 | 0.481 | 0.900 | 0.504 | 0.407 | 0.318 | 0.448 | ||||||
| INT.2 | 0.904 | 0.461 | 0.435 | 0.904 | 0.504 | 0.409 | 0.322 | 0.427 | ||||||
| INT.3 | 0.886 | 0.507 | 0.466 | 0.886 | 0.476 | 0.448 | 0.335 | 0.469 | ||||||
| INT.4 | 0.908 | 0.526 | 0.448 | 0.908 | 0.482 | 0.437 | 0.316 | 0.466 | ||||||
| INT.5 | 0.896 | 0.517 | 0.462 | 0.896 | 0.495 | 0.420 | 0.315 | 0.459 | ||||||
| INT.6 | 0.803 | 0.481 | 0.353 | 0.803 | 0.492 | 0.494 | 0.345 | 0.475 | ||||||
| ATT.1 | 0.847 | 0.847 | 0.610 | 0.439 | 0.413 | 0.367 | 0.312 | 0.613 | ||||||
| ATT.10 | 0.857 | 0.857 | 0.647 | 0.492 | 0.383 | 0.384 | 0.356 | 0.618 | ||||||
| ATT.11 | 0.778 | 0.778 | 0.515 | 0.514 | 0.417 | 0.441 | 0.408 | 0.633 | ||||||
| ATT.2 | 0.843 | 0.843 | 0.629 | 0.414 | 0.420 | 0.357 | 0.325 | 0.615 | ||||||
| ATT.3 | 0.750 | 0.750 | 0.565 | 0.413 | 0.384 | 0.423 | 0.424 | 0.564 | ||||||
| ATT.4 | 0.803 | 0.803 | 0.615 | 0.429 | 0.462 | 0.370 | 0.441 | 0.579 | ||||||
| ATT.5 | 0.858 | 0.858 | 0.660 | 0.475 | 0.373 | 0.355 | 0.276 | 0.585 | ||||||
| ATT.6 | 0.723 | 0.723 | 0.498 | 0.375 | 0.399 | 0.404 | 0.351 | 0.556 | ||||||
| ATT.7 | 0.758 | 0.758 | 0.605 | 0.422 | 0.337 | 0.345 | 0.306 | 0.540 | ||||||
| ATT.8 | 0.766 | 0.766 | 0.621 | 0.440 | 0.317 | 0.414 | 0.385 | 0.554 | ||||||
| ATT.9 | 0.865 | 0.865 | 0.705 | 0.516 | 0.429 | 0.371 | 0.324 | 0.594 | ||||||
| Description: ATT: Attitude; E: Egoistic; INT: Intention to re-consume; PBC: Perceived Behavioral Control; SEN_APP: Sensory Appeal Perceived; SN: Subjective norm; WG: Warm Glow. | ||||||||||||||
DownLoad:
CSV
| Mean | Standard Deviation | Matrix Correlations | ||||||||||
| WG.1 | WG.2 | WG.3 | WG.4 | WG.5 | WG.6 | WG.7 | WG.8 | E.1 | E.2 | |||
| WG.1 | 4.228 | 0.738 | 1.000 | |||||||||
| WG.2 | 4.267 | 0.702 | 0.771 | 1.000 | ||||||||
| WG.3 | 4.270 | 0.744 | 0.774 | 0.726 | 1.000 | |||||||
| WG.4 | 4.285 | 0.740 | 0.690 | 0.693 | 0.755 | 1.000 | ||||||
| WG.5 | 4.279 | 0.778 | 0.654 | 0.685 | 0.721 | 0.852 | 1.000 | |||||
| WG.6 | 4.356 | 0.713 | 0.652 | 0.658 | 0.703 | 0.814 | 0.833 | 1.000 | ||||
| WG.7 | 4.246 | 0.764 | 0.632 | 0.652 | 0.630 | 0.716 | 0.724 | 0.700 | 1.000 | |||
| WG.8 | 4.208 | 0.792 | 0.620 | 0.621 | 0.635 | 0.704 | 0.715 | 0.705 | 0.867 | 1.000 | ||
| E.1 | 4.513 | 0.702 | 0.564 | 0.450 | 0.570 | 0.535 | 0.499 | 0.571 | 0.401 | 0.432 | 1.000 | |
| E.2 | 4.288 | 0.806 | 0.513 | 0.441 | 0.524 | 0.494 | 0.468 | 0.508 | 0.425 | 0.464 | 0.735 | 1.000 |
| E.3 | 4.365 | 0.774 | 0.529 | 0.465 | 0.535 | 0.523 | 0.516 | 0.544 | 0.435 | 0.486 | 0.730 | 0.758 |
| E.4 | 4.501 | 0.698 | 0.567 | 0.478 | 0.545 | 0.527 | 0.508 | 0.595 | 0.442 | 0.456 | 0.764 | 0.703 |
| E.5 | 3.202 | 1.211 | 0.307 | 0.289 | 0.289 | 0.283 | 0.303 | 0.226 | 0.264 | 0.318 | 0.283 | 0.302 |
| E.6 | 3.685 | 1.117 | 0.454 | 0.421 | 0.431 | 0.421 | 0.395 | 0.398 | 0.418 | 0.466 | 0.433 | 0.413 |
| E.7 | 3.644 | 1.152 | 0.448 | 0.426 | 0.382 | 0.401 | 0.392 | 0.382 | 0.420 | 0.393 | 0.321 | 0.347 |
| ATT.1 | 4.395 | 0.659 | 0.608 | 0.510 | 0.515 | 0.554 | 0.543 | 0.560 | 0.467 | 0.474 | 0.569 | 0.529 |
| ATT.2 | 4.344 | 0.693 | 0.577 | 0.512 | 0.522 | 0.555 | 0.565 | 0.538 | 0.473 | 0.507 | 0.569 | 0.566 |
| ATT.3 | 4.145 | 0.847 | 0.479 | 0.469 | 0.517 | 0.506 | 0.492 | 0.465 | 0.458 | 0.512 | 0.498 | 0.560 |
| ATT.4 | 4.193 | 0.771 | 0.522 | 0.470 | 0.499 | 0.527 | 0.514 | 0.485 | 0.468 | 0.512 | 0.502 | 0.588 |
| ATT.5 | 4.469 | 0.640 | 0.534 | 0.494 | 0.476 | 0.526 | 0.519 | 0.571 | 0.450 | 0.470 | 0.587 | 0.578 |
| ATT.6 | 4.139 | 0.834 | 0.527 | 0.469 | 0.489 | 0.464 | 0.475 | 0.450 | 0.491 | 0.482 | 0.460 | 0.439 |
| ATT.7 | 4.475 | 0.739 | 0.498 | 0.465 | 0.469 | 0.474 | 0.477 | 0.479 | 0.445 | 0.425 | 0.582 | 0.503 |
| ATT.8 | 4.329 | 0.783 | 0.471 | 0.423 | 0.479 | 0.489 | 0.512 | 0.508 | 0.450 | 0.493 | 0.556 | 0.489 |
| ATT.9 | 4.528 | 0.631 | 0.551 | 0.439 | 0.518 | 0.523 | 0.529 | 0.578 | 0.469 | 0.487 | 0.648 | 0.553 |
| ATT.10 | 4.481 | 0.654 | 0.523 | 0.470 | 0.520 | 0.600 | 0.582 | 0.588 | 0.482 | 0.500 | 0.619 | 0.548 |
| ATT.11 | 4.362 | 0.739 | 0.534 | 0.518 | 0.497 | 0.517 | 0.506 | 0.471 | 0.663 | 0.678 | 0.437 | 0.448 |
| SN.1 | 3.706 | 0.953 | 0.281 | 0.237 | 0.292 | 0.220 | 0.247 | 0.171 | 0.193 | 0.199 | 0.301 | 0.303 |
| SN.2 | 3.712 | 0.976 | 0.297 | 0.273 | 0.279 | 0.245 | 0.262 | 0.211 | 0.270 | 0.269 | 0.268 | 0.294 |
| SN.3 | 3.742 | 0.972 | 0.384 | 0.319 | 0.363 | 0.333 | 0.327 | 0.282 | 0.325 | 0.274 | 0.268 | 0.265 |
| SN.4 | 3.724 | 0.992 | 0.253 | 0.230 | 0.218 | 0.232 | 0.215 | 0.189 | 0.313 | 0.258 | 0.157 | 0.159 |
| SN.5 | 3.733 | 0.990 | 0.299 | 0.261 | 0.271 | 0.298 | 0.282 | 0.286 | 0.323 | 0.336 | 0.261 | 0.312 |
| SN.6 | 3.932 | 0.974 | 0.381 | 0.244 | 0.345 | 0.295 | 0.303 | 0.279 | 0.334 | 0.307 | 0.307 | 0.275 |
| SN.7 | 2.861 | 1.315 | 0.131 | 0.108 | 0.087 | 0.074 | 0.108 | 0.043 | 0.132 | 0.159 | 0.058 | 0.074 |
| PBC.1 | 4.318 | 0.733 | 0.310 | 0.331 | 0.327 | 0.271 | 0.298 | 0.306 | 0.274 | 0.244 | 0.289 | 0.252 |
| PBC.2 | 4.181 | 0.680 | 0.314 | 0.309 | 0.267 | 0.304 | 0.286 | 0.314 | 0.325 | 0.321 | 0.302 | 0.349 |
| PBC.3 | 4.160 | 0.713 | 0.325 | 0.336 | 0.293 | 0.330 | 0.326 | 0.273 | 0.309 | 0.293 | 0.322 | 0.431 |
| PBC.4 | 4.228 | 0.726 | 0.329 | 0.335 | 0.309 | 0.277 | 0.303 | 0.302 | 0.321 | 0.310 | 0.271 | 0.258 |
| PBC.5 | 4.240 | 0.679 | 0.323 | 0.388 | 0.312 | 0.360 | 0.322 | 0.307 | 0.321 | 0.277 | 0.270 | 0.356 |
| PBC.6 | 4.039 | 0.841 | 0.287 | 0.349 | 0.363 | 0.349 | 0.337 | 0.323 | 0.295 | 0.300 | 0.243 | 0.364 |
| PBC.7 | 4.291 | 0.657 | 0.328 | 0.334 | 0.343 | 0.367 | 0.312 | 0.343 | 0.301 | 0.266 | 0.313 | 0.324 |
| SEN_APP.1 | 4.104 | 0.761 | 0.243 | 0.265 | 0.228 | 0.248 | 0.202 | 0.183 | 0.313 | 0.274 | 0.167 | 0.203 |
| SEN_APP.2 | 4.053 | 0.745 | 0.242 | 0.251 | 0.269 | 0.263 | 0.266 | 0.249 | 0.248 | 0.258 | 0.203 | 0.212 |
| SEN_APP.3 | 4.276 | 0.688 | 0.344 | 0.302 | 0.347 | 0.370 | 0.350 | 0.326 | 0.362 | 0.331 | 0.278 | 0.253 |
| SEN_APP.4 | 4.172 | 0.689 | 0.331 | 0.353 | 0.309 | 0.375 | 0.348 | 0.340 | 0.382 | 0.331 | 0.277 | 0.279 |
| INT.1 | 4.374 | 0.594 | 0.387 | 0.423 | 0.416 | 0.399 | 0.397 | 0.365 | 0.379 | 0.333 | 0.408 | 0.432 |
| INT.2 | 4.374 | 0.604 | 0.354 | 0.416 | 0.376 | 0.399 | 0.359 | 0.359 | 0.379 | 0.315 | 0.359 | 0.388 |
| INT.3 | 4.276 | 0.670 | 0.413 | 0.436 | 0.398 | 0.410 | 0.416 | 0.366 | 0.424 | 0.384 | 0.374 | 0.457 |
| INT.4 | 4.350 | 0.603 | 0.380 | 0.438 | 0.411 | 0.421 | 0.431 | 0.393 | 0.392 | 0.357 | 0.395 | 0.366 |
| INT.5 | 4.392 | 0.597 | 0.383 | 0.409 | 0.416 | 0.405 | 0.416 | 0.404 | 0.400 | 0.342 | 0.412 | 0.400 |
| INT.6 | 4.326 | 0.658 | 0.354 | 0.357 | 0.353 | 0.442 | 0.402 | 0.359 | 0.525 | 0.496 | 0.279 | 0.337 |
DownLoad:
CSV
| E.3 | E.4 | E.5 | E.6 | E.7 | ATT.1 | ATT.2 | ATT.3 | ATT.4 | ATT.5 | ATT.6 | ATT.7 | |
| E.3 | 1.000 | |||||||||||
| E.4 | 0.759 | 1.000 | ||||||||||
| E.5 | 0.320 | 0.221 | 1.000 | |||||||||
| E.6 | 0.452 | 0.392 | 0.703 | 1.000 | ||||||||
| E.7 | 0.362 | 0.303 | 0.660 | 0.741 | 1.000 | |||||||
| ATT.1 | 0.537 | 0.556 | 0.268 | 0.390 | 0.376 | 1.000 | ||||||
| ATT.2 | 0.578 | 0.544 | 0.320 | 0.415 | 0.425 | 0.858 | 1.000 | |||||
| ATT.3 | 0.525 | 0.449 | 0.414 | 0.475 | 0.384 | 0.625 | 0.657 | 1.000 | ||||
| ATT.4 | 0.612 | 0.504 | 0.359 | 0.432 | 0.425 | 0.650 | 0.697 | 0.656 | 1.000 | |||
| ATT.5 | 0.601 | 0.603 | 0.192 | 0.331 | 0.307 | 0.757 | 0.720 | 0.597 | 0.677 | 1.000 | ||
| ATT.6 | 0.445 | 0.446 | 0.372 | 0.429 | 0.438 | 0.591 | 0.579 | 0.534 | 0.618 | 0.567 | 1.000 | |
| ATT.7 | 0.532 | 0.557 | 0.148 | 0.289 | 0.279 | 0.572 | 0.544 | 0.421 | 0.521 | 0.602 | 0.461 | 1.000 |
| ATT.8 | 0.639 | 0.539 | 0.337 | 0.454 | 0.400 | 0.530 | 0.529 | 0.514 | 0.558 | 0.610 | 0.480 | 0.607 |
| ATT.9 | 0.650 | 0.679 | 0.191 | 0.329 | 0.271 | 0.676 | 0.650 | 0.551 | 0.602 | 0.740 | 0.531 | 0.723 |
| ATT.10 | 0.573 | 0.583 | 0.222 | 0.353 | 0.322 | 0.661 | 0.669 | 0.565 | 0.599 | 0.717 | 0.552 | 0.688 |
| ATT.11 | 0.511 | 0.454 | 0.247 | 0.422 | 0.354 | 0.578 | 0.568 | 0.542 | 0.549 | 0.589 | 0.549 | 0.566 |
| SN.1 | 0.278 | 0.226 | 0.386 | 0.298 | 0.302 | 0.227 | 0.247 | 0.299 | 0.344 | 0.197 | 0.268 | 0.244 |
| SN.2 | 0.284 | 0.199 | 0.363 | 0.292 | 0.273 | 0.269 | 0.278 | 0.366 | 0.389 | 0.216 | 0.279 | 0.247 |
| SN.3 | 0.283 | 0.239 | 0.372 | 0.371 | 0.416 | 0.326 | 0.343 | 0.388 | 0.407 | 0.285 | 0.312 | 0.315 |
| SN.4 | 0.154 | 0.088 | 0.333 | 0.307 | 0.363 | 0.212 | 0.224 | 0.366 | 0.349 | 0.176 | 0.344 | 0.211 |
| SN.5 | 0.270 | 0.228 | 0.347 | 0.370 | 0.349 | 0.284 | 0.281 | 0.390 | 0.390 | 0.287 | 0.308 | 0.279 |
| SN.6 | 0.281 | 0.260 | 0.261 | 0.305 | 0.365 | 0.319 | 0.303 | 0.350 | 0.349 | 0.332 | 0.399 | 0.305 |
| SN.7 | 0.065 | 0.021 | 0.396 | 0.330 | 0.314 | 0.101 | 0.114 | 0.242 | 0.167 | 0.032 | 0.229 | 0.044 |
| PBC.1 | 0.287 | 0.309 | 0.122 | 0.111 | 0.148 | 0.287 | 0.270 | 0.208 | 0.228 | 0.265 | 0.219 | 0.209 |
| PBC.2 | 0.365 | 0.371 | 0.161 | 0.196 | 0.219 | 0.244 | 0.233 | 0.238 | 0.329 | 0.282 | 0.280 | 0.260 |
| PBC.3 | 0.383 | 0.339 | 0.217 | 0.216 | 0.214 | 0.358 | 0.375 | 0.335 | 0.446 | 0.323 | 0.337 | 0.329 |
| PBC.4 | 0.253 | 0.283 | 0.241 | 0.220 | 0.207 | 0.277 | 0.262 | 0.255 | 0.266 | 0.255 | 0.295 | 0.224 |
| PBC.5 | 0.301 | 0.321 | 0.161 | 0.182 | 0.223 | 0.418 | 0.398 | 0.367 | 0.416 | 0.342 | 0.381 | 0.322 |
| PBC.6 | 0.325 | 0.260 | 0.287 | 0.259 | 0.256 | 0.288 | 0.359 | 0.354 | 0.409 | 0.248 | 0.293 | 0.214 |
| PBC.7 | 0.316 | 0.303 | 0.169 | 0.214 | 0.227 | 0.399 | 0.399 | 0.313 | 0.364 | 0.339 | 0.337 | 0.266 |
| SEN_APP.1 | 0.213 | 0.203 | 0.341 | 0.349 | 0.296 | 0.279 | 0.258 | 0.335 | 0.304 | 0.229 | 0.342 | 0.229 |
| SEN_APP.2 | 0.244 | 0.228 | 0.347 | 0.359 | 0.278 | 0.253 | 0.263 | 0.364 | 0.282 | 0.246 | 0.294 | 0.223 |
| SEN_APP.3 | 0.273 | 0.317 | 0.225 | 0.283 | 0.251 | 0.401 | 0.348 | 0.390 | 0.358 | 0.374 | 0.362 | 0.373 |
| SEN_APP.4 | 0.266 | 0.308 | 0.250 | 0.329 | 0.335 | 0.288 | 0.317 | 0.333 | 0.295 | 0.322 | 0.356 | 0.312 |
| INT.1 | 0.439 | 0.449 | 0.209 | 0.240 | 0.260 | 0.358 | 0.336 | 0.322 | 0.348 | 0.390 | 0.302 | 0.400 |
| INT.2 | 0.400 | 0.414 | 0.221 | 0.214 | 0.268 | 0.382 | 0.352 | 0.317 | 0.323 | 0.407 | 0.303 | 0.367 |
| INT.3 | 0.423 | 0.421 | 0.260 | 0.298 | 0.354 | 0.405 | 0.409 | 0.410 | 0.431 | 0.432 | 0.356 | 0.359 |
| INT.4 | 0.431 | 0.414 | 0.200 | 0.247 | 0.260 | 0.406 | 0.400 | 0.376 | 0.416 | 0.451 | 0.351 | 0.412 |
| INT.5 | 0.429 | 0.418 | 0.198 | 0.260 | 0.267 | 0.421 | 0.355 | 0.386 | 0.383 | 0.428 | 0.343 | 0.419 |
| INT.6 | 0.331 | 0.322 | 0.237 | 0.305 | 0.286 | 0.353 | 0.339 | 0.372 | 0.367 | 0.405 | 0.328 | 0.279 |
DownLoad:
CSV
| ATT.8 | ATT.9 | ATT.10 | ATT.11 | SN.1 | SN.2 | SN.3 | SN.4 | SN.5 | SN.6 | SN.7 | PBC.1 | |
| ATT.8 | 1.000 | |||||||||||
| ATT.9 | 0.694 | 1.000 | ||||||||||
| ATT.10 | 0.624 | 0.802 | 1.000 | |||||||||
| ATT.11 | 0.620 | 0.641 | 0.672 | 1.000 | ||||||||
| SN.1 | 0.289 | 0.243 | 0.274 | 0.273 | 1.000 | |||||||
| SN.2 | 0.326 | 0.271 | 0.291 | 0.350 | 0.764 | 1.000 | ||||||
| SN.3 | 0.357 | 0.334 | 0.354 | 0.382 | 0.687 | 0.697 | 1.000 | |||||
| SN.4 | 0.274 | 0.200 | 0.241 | 0.311 | 0.552 | 0.568 | 0.653 | 1.000 | ||||
| SN.5 | 0.382 | 0.316 | 0.345 | 0.412 | 0.672 | 0.750 | 0.653 | 0.636 | 1.000 | |||
| SN.6 | 0.361 | 0.349 | 0.368 | 0.360 | 0.423 | 0.401 | 0.480 | 0.595 | 0.483 | 1.000 | ||
| SN.7 | 0.154 | 0.067 | 0.116 | 0.196 | 0.467 | 0.461 | 0.422 | 0.524 | 0.489 | 0.421 | 1.000 | |
| PBC.1 | 0.185 | 0.337 | 0.257 | 0.210 | 0.121 | 0.115 | 0.115 | 0.043 | 0.043 | 0.064 | -0.040 | 1.000 |
| PBC.2 | 0.256 | 0.358 | 0.271 | 0.313 | 0.293 | 0.302 | 0.214 | 0.149 | 0.319 | 0.167 | 0.018 | 0.468 |
| PBC.3 | 0.272 | 0.353 | 0.338 | 0.380 | 0.371 | 0.420 | 0.329 | 0.251 | 0.359 | 0.272 | 0.109 | 0.436 |
| PBC.4 | 0.265 | 0.307 | 0.244 | 0.333 | 0.174 | 0.181 | 0.168 | 0.174 | 0.130 | 0.127 | 0.046 | 0.650 |
| PBC.5 | 0.225 | 0.383 | 0.368 | 0.365 | 0.270 | 0.256 | 0.260 | 0.231 | 0.250 | 0.218 | 0.057 | 0.335 |
| PBC.6 | 0.242 | 0.280 | 0.306 | 0.278 | 0.310 | 0.339 | 0.277 | 0.201 | 0.269 | 0.166 | 0.077 | 0.360 |
| PBC.7 | 0.275 | 0.381 | 0.317 | 0.339 | 0.189 | 0.223 | 0.196 | 0.173 | 0.183 | 0.198 | 0.033 | 0.424 |
| SEN_APP.1 | 0.281 | 0.207 | 0.228 | 0.355 | 0.308 | 0.316 | 0.269 | 0.309 | 0.289 | 0.226 | 0.213 | 0.138 |
| SEN_APP.2 | 0.326 | 0.281 | 0.307 | 0.315 | 0.336 | 0.364 | 0.343 | 0.305 | 0.309 | 0.230 | 0.217 | 0.148 |
| SEN_APP.3 | 0.394 | 0.376 | 0.385 | 0.399 | 0.255 | 0.273 | 0.284 | 0.290 | 0.261 | 0.299 | 0.121 | 0.238 |
| SEN_APP.4 | 0.374 | 0.358 | 0.350 | 0.402 | 0.258 | 0.307 | 0.288 | 0.295 | 0.389 | 0.261 | 0.138 | 0.227 |
| INT.1 | 0.348 | 0.471 | 0.408 | 0.395 | 0.288 | 0.308 | 0.260 | 0.195 | 0.296 | 0.301 | 0.082 | 0.382 |
| INT.2 | 0.336 | 0.440 | 0.424 | 0.415 | 0.284 | 0.313 | 0.265 | 0.182 | 0.316 | 0.281 | 0.088 | 0.375 |
| INT.3 | 0.392 | 0.428 | 0.422 | 0.440 | 0.290 | 0.307 | 0.292 | 0.213 | 0.317 | 0.338 | 0.128 | 0.341 |
| INT.4 | 0.397 | 0.504 | 0.476 | 0.455 | 0.267 | 0.292 | 0.301 | 0.191 | 0.286 | 0.283 | 0.103 | 0.346 |
| INT.5 | 0.428 | 0.498 | 0.467 | 0.432 | 0.270 | 0.285 | 0.281 | 0.208 | 0.292 | 0.296 | 0.077 | 0.360 |
| INT.6 | 0.425 | 0.392 | 0.407 | 0.581 | 0.266 | 0.303 | 0.312 | 0.247 | 0.334 | 0.252 | 0.114 | 0.259 |
DownLoad:
CSV
| PBC.2 | PBC.3 | PBC.4 | PBC.5 | PBC.6 | PBC.7 | SEN_APP.1 | SEN_APP.2 | SEN_APP.3 | SEN_APP.4 | INT.1 | INT.2 | |
| PBC.2 | 1.000 | |||||||||||
| PBC.3 | 0.723 | 1.000 | ||||||||||
| PBC.4 | 0.487 | 0.554 | 1.000 | |||||||||
| PBC.5 | 0.593 | 0.643 | 0.533 | 1.000 | ||||||||
| PBC.6 | 0.501 | 0.613 | 0.530 | 0.534 | 1.000 | |||||||
| PBC.7 | 0.573 | 0.616 | 0.545 | 0.641 | 0.602 | 1.000 | ||||||
| SEN_APP.1 | 0.233 | 0.275 | 0.236 | 0.307 | 0.267 | 0.266 | 1.000 | |||||
| SEN_APP.2 | 0.215 | 0.230 | 0.197 | 0.285 | 0.271 | 0.265 | 0.686 | 1.000 | ||||
| SEN_APP.3 | 0.293 | 0.309 | 0.320 | 0.360 | 0.289 | 0.328 | 0.586 | 0.603 | 1.000 | |||
| SEN_APP.4 | 0.326 | 0.324 | 0.307 | 0.368 | 0.337 | 0.309 | 0.532 | 0.589 | 0.658 | 1.000 | ||
| INT.1 | 0.420 | 0.461 | 0.366 | 0.424 | 0.351 | 0.406 | 0.295 | 0.324 | 0.336 | 0.401 | 1.000 | |
| INT.2 | 0.420 | 0.440 | 0.381 | 0.425 | 0.334 | 0.429 | 0.322 | 0.318 | 0.323 | 0.402 | 0.868 | 1.000 |
| INT.3 | 0.405 | 0.442 | 0.334 | 0.421 | 0.329 | 0.357 | 0.287 | 0.375 | 0.376 | 0.450 | 0.755 | 0.772 |
| INT.4 | 0.366 | 0.428 | 0.360 | 0.432 | 0.307 | 0.424 | 0.308 | 0.374 | 0.339 | 0.433 | 0.794 | 0.773 |
| INT.5 | 0.388 | 0.431 | 0.355 | 0.441 | 0.342 | 0.428 | 0.269 | 0.326 | 0.358 | 0.434 | 0.758 | 0.737 |
| INT.6 | 0.405 | 0.401 | 0.403 | 0.428 | 0.331 | 0.405 | 0.382 | 0.346 | 0.443 | 0.471 | 0.606 | 0.648 |
DownLoad:
CSV
| INT.3 | INT.4 | INT.5 | INT.6 | |
| INT.3 | 1.000 | |||
| INT.4 | 0.766 | 1.000 | ||
| INT.5 | 0.745 | 0.821 | 1.000 | |
| INT.6 | 0.657 | 0.653 | 0.678 | 1.000 |
DownLoad:
CSV
The authors declare no conflicts of interest.
| [1] | Paris Agreement on Climate Change. (2015) United Nations, New York. |
| [2] | Erickson LE, Robinson J, Brase G, et al. (Eds.) (2017) Solar Powered Charging Infrastructure for Electric Vehicles: A Sustainable Development, CRC Press, Taylor and Francis, Boca Raton, Florida. |
| [3] | Crimmins A, Balbus J, Gamble J, et al. (2016) The Impacts of Climate Change on Human Health in the United States: A scientific Assessment. U.S. Global Change Research Program, Washington, DC. |
| [4] | Priddle R (Ed.) (2016) Energy and Air Pollution, International Energy Agency, Paris, France. |
| [5] | Sachs JD (2015) The Age of Sustainable Development, Columbia University Press, New York. |
| [6] | Guarino B (2016). "Anthrax Sickens 13 in Western Siberia, and a Thawed-out Reindeer Corpse May be to Blame" Washington Post, July 28, 2016, Available from: www.washingtonpost.com. |
| [7] | Revich BA and Podolnya MA (2011) Thawing of permafrost may disturb historic cattle burial ground in East Siberia. Glob Health Action 4: 8482; DOI: 10.3402/gha.v4i).8482. |
| [8] | International Agency for Research on Cancer. (2012) Diesel Engine Exhaust Carcinogenic, Press Release No. 213, June 12, 2012, World Health Organization, Lyon, France. |
| [9] | American Cancer Society (2016) Diesel Exhaust and Cancer, American Cancer Society, Available from: www.cancer.org. |
| [10] | Goldin E, Erickson LE, Natarajan B, et al. (2014) Solar powered charging stations for electric vehicles. Environ Prog Sustainable Energy 33: 1298-1308. |
| [11] |
Robinson J, Brase G, Griswold W, et al. (2014) Business models for solar powered charging stations to develop infrastructure for electric vehicles. Sustainability 6: 7358-7387. doi: 10.3390/su6107358

|
| [12] |
Erickson LE, Burkey A, Morrissey KG, et al. (2015) Social, economic, technological, and environmental impacts of the development and implementation of solar powered charge stations. Environ Prog Sustainable Energy 34: 1808-1813. doi: 10.1002/ep.12163
|
| [13] | OECD (2014) The cost of air pollution: Health impacts of road transport, Organization for Economic Cooperation and Development Report, OECD Publishing, Doi: 10.1787/9789264210448-en, Available from: www.oecd.org. |
| [14] | WHO (2015) Economic Cost of the Health Impact of Air Pollution in Europe, World Health Organization Report, Available from: www.euro.who.int. |
| [15] | Satish U, Mendell MJ, Shekhar K, et al. (2012) Is CO2 an indoor pollutant? Direct effects of low-to-moderate CO2 concentrations on human decision-making performance. Environ Health Perspect 120: 1671-1677. |
| [16] |
Burke M, Hsiang SM, Miguel E (2015) Global non-linear effect of temperature on economic production. Nature 527: 235-239. doi: 10.1038/nature15725
|
| [17] | WHO (2012) WHO Global Health Expenditure Atlas, World Health Organization, Geneva, Switzerland. |
| [18] | Kan H, Chen B, Hong C (2009) Health impact of air pollution in China: Current knowledge and future research needs. Environ Health Perspect 117: A187. |
| [19] | Ackerman F and Stanton EA (2008) The Cost of Climate Change, Natural Resources Defense Council, New York. |
| [20] | RITA (2013) Transportation Statistics Annual Report (2012) Research and Innovative Technology Administration, U.S. Department of Transportation, Washington, DC. |
| [21] | Brown LR, Larsen J, Roney JM, et al. (2015) The Great Transition, W.W. Norton & Co., New York. |
| [22] | Incropera FP (2016) Climate Change: A Wicked Problem, Cambridge University Press, New York. |
| [23] | Romm J (2016) Climate Change: What Everyone Needs to Know, Oxford, New York. |
| [24] | Williams JH, DeBenedictis A, Ghanadan R, et al. (2012) The technology path to deep greenhouse gas emission cuts by 2050: The pivotal role of electricity. Science 335: 53-59. |
| [25] | Kassakian JG (2015) Overcoming Barriers to Deployment of Plug-in Electric Vehicles, National Academies Press, Washington, DC. |
| [26] |
Nykvist B and Nilsson M (2015). Rapidly falling costs of battery packs for electric vehicles. Nat Clim Change 5: 329-332. doi: 10.1038/nclimate2564
|
| [27] | Union of Concerned Scientists. Coal generates 44% of our electricity, and is the single biggest air polluter in the U.S. Retrieved August 10, 2016, from Union of Concerned Scientists: Science for a Healthy Planet and Safer World, Available from: http://www.ucsusa.org/clean_energy/coalvswind/c01.html#.V6tTQigrLIU. |
| [28] | Union of Concerned Scientists. A Changing Climate Worsens Allergy Symptoms. Retrieved August 13, 2016, from Union of Concerned Scientists: Science for a healthy planet and safer world: Available from: http://www.ucsusa.org/global_warming/science_and_impacts/impacts/climate-and-allergies.html#.V69eXCgrLIV. |
| [29] | Peters A (2015) Meet the electric bus that could push every other polluting bus off the road, Available from: www.fastcoexist.com. |
| [30] | Edelstein S (2016) Chicago transit authority to add dozens of electric buses after successful tests, Available from: www.greencarreports.com. |
| [31] | Proterra (2015) About Proterra, Available from: www.proterra.com. |
| [32] | Ayre J (2016) Gothenburg's electric bus route 55 blows past expectations, Available from: www.evobsessions.com. |
| [33] | McDonald J (2016) Chinese electric car maker enters U.S. market by selling buses, Available from: www.phys.org. |
| [34] | Shahan Z (2016) New "much improved" BYD electric bus gets first 15 orders in France, Available from: www.cleantechnica.com. |
| [35] | Eudy L, Prohaska R, Kelly K, et al. (2016) Foothill Transit Battery Electric Bus Demonstration Results, National Renewable Energy Laboratory Report NREL/TP-5400-65274, January 2016, Available from: www.nrel.gov. |
| [36] | Holmes-Gen B and Barrett W (2016). Clean Air Future: Health and climate Benefits of Zero Emission Vehicles, American Lung Association of California Report, October 2016. |
| [37] |
Nunes P, Figueiredo R, Brito MC (2016) The use of parking lots to solar-charge electric vehicles. Renewable Sustainable Energy Rev 66: 679-693. doi: 10.1016/j.rser.2016.08.015
|
| [38] | Vahedifard F, AghaKouchak A, Jafari NH (2016) Compound hazards yield Louisiana flood. Science 353: 1374. |
| [39] | Miotti M, Supran GJ, Kim EJ, et al. (2016) Personal vehicles evaluated against climate change mitigation targets. Environ Sci Technol, DOI: 10.1021/acs.est.6b00177. |
| [40] | Black R, Adger WN, Arnell NW, et al. (2011) The effect of environmental change on human migration. Glob Environ Chang 21S: S3-S11. |
| [41] | IPCC (2014) Climate Change 2014: Synthesis Report. Contribution of Working Groups I, II, and II to the 5th Assessment Report of the Intergovernmental Panel on Climate Change, R.K. Pauchuri and L.A. Meyer, Eds., IPCC, Geneva, Switzerland. |
| [42] |
WHO (2016). India takes steps to curb air pollution. Bull W H O 94: 487-488. doi: 10.2471/BLT.16.020716
|
| [43] |
Krzyzanowski M, Apte JS, Bonjour SP, et al. (2014) Air pollution in the mega-cities. Curr Environ Health Rep 1: 185-191. doi: 10.1007/s40572-014-0019-7
|
| [44] |
Saraswat A, Apte JS, Kandlikar M, et al. (2013) Saptiotemporal land use regression models of fine, ultrafine, and black carbon particulate matter in New Delhi, India. Environ Sci Technol 47: 12903-12911. doi: 10.1021/es401489h
|
| [45] |
Apte JS, Bombrun E, Marshall JD, et al. (2012) Global intraurban intake fractions for primary air pollutants from vehicles and other distributed sources. Environ Sci Technol 46: 3415-3423. doi: 10.1021/es204021h
|
| [46] | Brauer M, Freedman G, Frostad J, et al. (2015) Ambient air pollution exposure estimation for the global burden of disease 2013. Environ Sci Technol 50: 79-88. |
| [47] | Apte JS, Marshall JD, Cohen AJ, et al. (2015) Addressing global mortality from ambient PM2.5. Environ Sci Technol 49: 8057-8066. |
| [48] | City of London (2015) City of London Air Quality Strategy 2015–2020. City of London, London, UK, Available from: www.cityoflondon.gov.uk/air. |
| [49] | Mahendra A, Conti V, Pai M, et al. (2014) Integrating Health Benefits into Transportation Planning and Policy in India. Issue Brief. EMBARQ India, Mumbai. |
| [50] | NIPH (2014) Air Pollution in Norway: Public Health Report 2014. Norwegian Institute of Public Health. |
| [51] | Ayre J (2016) Electric Car Sales 28% of All Car Sales in Norway (First 7 months of 2016). Clean Technica, Available from: https://cleantechnica.com. |
| [52] | Meredith P (2016) Moving parts. PRISM 26, No. 4, 24–29, December, 2016. |
| [53] | Hunt A, Ferguson J, Hurley F, et al. (2016). Social Costs of Morbidity Impacts of Air Pollution, OECD Environment Working Papers No. 99, OECD Publishing, Paris. |
| [54] | Mani MS, Sandhu SC, Joshi G, et al. (2013) India: Diagnostic Assessment of Select Environmental Challenges. Report No. 70004-IN, World Bank, South Asia Region. |
| [55] | Giannadaki D, Lelieveld J, Pozzer A (2016) Implementing the U.S. air quality standard for PM2.5 worldwide can prevent millions of premature deaths per year. Environ Health 15: 88.r polluter in the U.S. Retrieved August 10, 2016, from Union of Concerned Scientists: Science for a Healthy Planet and Safer World, Available from: http://www.ucsusa.org/clean_energy/coalvswind/c01.html#.V6tTQigrLIU. |
| 1. | Rocio de la Torre, Canan G. Corlu, Javier Faulin, Bhakti S. Onggo, Angel A. Juan, Simulation, Optimization, and Machine Learning in Sustainable Transportation Systems: Models and Applications, 2021, 13, 2071-1050, 1551, 10.3390/su13031551 | |
| 2. | Larry E. Erickson, Gregory L. Newmark, Michael J. Higgins, Zixian Wang, Nitrogen oxides and ozone in urban air: A review of 50 plus years of progress, 2020, 39, 1944-7442, 10.1002/ep.13484 | |
| 3. | Larry E. Erickson, Reducing greenhouse gas emissions and improving air quality: Two global challenges, 2017, 36, 19447442, 982, 10.1002/ep.12665 | |
| 4. | Ian Vázquez-Rowe, Ramzy Kahhat, Gustavo Larrea-Gallegos, Kurt Ziegler-Rodriguez, Peru's road to climate action: Are we on the right path? The role of life cycle methods to improve Peruvian national contributions, 2019, 659, 00489697, 249, 10.1016/j.scitotenv.2018.12.322 | |
| 5. | Patrick L. Kinney, Interactions of Climate Change, Air Pollution, and Human Health, 2018, 5, 2196-5412, 179, 10.1007/s40572-018-0188-x | |
| 6. | Daniel Neves Schmitz Gonçalves, George Vasconcelos Goes, Márcio de Almeida D'Agosto, Renata Albergaria de Mello Bandeira, Energy use and emissions scenarios for transport to gauge progress toward national commitments, 2019, 135, 03014215, 110997, 10.1016/j.enpol.2019.110997 | |
| 7. | Shupeng Zhu, Jeremy R. Horne, Michael Mac Kinnon, G.S. Samuelsen, Donald Dabdub, Comprehensively assessing the drivers of future air quality in California, 2019, 125, 01604120, 386, 10.1016/j.envint.2019.02.007 | |
| 8. | Summaira Malik, Asim Iqbal, Asma Imran, Muhammad Usman, Muhammad Nadeem, Saira Asif, Awais Bokhari, Impact of economic capabilities and population agglomeration on PM2.5 emission: empirical evidence from sub-Saharan African countries, 2020, 0944-1344, 10.1007/s11356-020-10907-9 | |
| 9. | Françoise Bartiaux, Mara Maretti, Alfredo Cartone, Philipp Biermann, Veneta Krasteva, Sustainable energy transitions and social inequalities in energy access: A relational comparison of capabilities in three European countries, 2019, 1, 25897918, 226, 10.1016/j.glt.2019.11.002 | |
| 10. | Matthew L. Richardson, Ashley D. Milton, Elgloria Harrison, People with Different Educational Attainment in Washington, DC, USA have Differential Knowledge and Perceptions about Environmental Issues, 2020, 12, 2071-1050, 2063, 10.3390/su12052063 | |
| 11. | Larry E. Erickson, Wendy Griswold, Ronaldo G. Maghirang, Brian P. Urbaszewski, Air Quality, Health and Community Action, 2017, 08, 2152-2197, 1057, 10.4236/jep.2017.810067 | |
| 12. | Xinpeng Xing, Jianhua Wang, Tiansen Liu, He Liu, Yue Zhu, How Energy Consumption and Pollutant Emissions Affect the Disparity of Public Health in Countries with High Fossil Energy Consumption, 2019, 16, 1660-4601, 4678, 10.3390/ijerph16234678 | |
| 13. | Daniel Badulescu, Ramona Simut, Alina Badulescu, Andrei-Vlad Badulescu, The Relative Effects of Economic Growth, Environmental Pollution and Non-Communicable Diseases on Health Expenditures in European Union Countries, 2019, 16, 1660-4601, 5115, 10.3390/ijerph16245115 | |
| 14. | Esteban Lopez-Arboleda, Alfonso T. Sarmiento, Laura M. Cardenas, Systemic approach for integration of sustainability in evaluation of public policies for adoption of electric vehicles, 2020, 1094-429X, 10.1007/s11213-020-09540-x | |
| 15. | Kei Jung Kwon, Bong Ju Park, Efficiency of Spathiphyllum spp. as a plant-microbial fuel cell, 2021, 27, 2447-536X, 173, 10.1590/2447-536x.v27i2.2264 | |
| 16. | Thabo I Hlatshwayo, Eduard M Stam, Wendy J Collinson-Jonker, Abeda Dawood, An inventory of amphibian roadkill in the western Soutpansberg, Limpopo province, South Africa, 2022, 2156-4574, 1, 10.1080/21564574.2022.2115154 | |
| 17. | Kenichiro Chinen, Mitsutaka Matsumoto, Chang Liu, Pingsheng Tong, Yongliang Stanley Han, Hideki Endo, Expanding electric-vehicle adoption beyond the national border: Insights for developing marketing policies for global electric-vehicle manufacturers, 2022, 1556-8318, 1, 10.1080/15568318.2022.2045652 | |
| 18. | Davide W. Pederzoli, Cristina Carnevali, Riccardo Genova, Maurizio Mazzucchelli, Adriana Del Borghi, Michela Gallo, Luca Moreschi, Life cycle assessment of hydrogen-powered city buses in the High V.LO-City project: integrating vehicle operation and refuelling infrastructure, 2022, 4, 2523-3963, 10.1007/s42452-021-04933-6 | |
| 19. | Rafael Marcuzzo, Lucila M. S. Campos, Mauricio Uriona Maldonado, Caroline Rodrigues Vaz, 2021, Chapter 47, 978-3-030-78569-7, 609, 10.1007/978-3-030-78570-3_47 | |
| 20. | Muhammad Sibtain, Hassan Bashir, Mohsin Nawaz, Salma Hameed, Muhammad Imran Azam, Xianshan Li, Tanveer Abbas, Snoober Saleem, A multivariate ultra-short-term wind speed forecasting model by employing multistage signal decomposition approaches and a deep learning network, 2022, 263, 01968904, 115703, 10.1016/j.enconman.2022.115703 | |
| 21. | Esteban Lopez-Arboleda, Alfonso T. Sarmiento, Laura M. Cardenas, Understanding synergies between electric-vehicle market dynamics and sustainability: Case study of Colombia, 2021, 321, 09596526, 128834, 10.1016/j.jclepro.2021.128834 | |
| 22. | Cristian Timmermann, Eduardo Noboa, Energy Sovereignty: A Values-Based Conceptual Analysis, 2022, 28, 1353-3452, 10.1007/s11948-022-00409-x | |
| 23. | Dewi Kumalasari, Mila Koeva, Faridaddin Vahdatikhaki, Dessislava Petrova Antonova, Monika Kuffer, Planning Walkable Cities: Generative Design Approach towards Digital Twin Implementation, 2023, 15, 2072-4292, 1088, 10.3390/rs15041088 | |
| 24. | Danilo Ferreira de Souza, Francisco Antônio Marino Salotti, Ildo Luís Sauer, Hédio Tatizawa, Aníbal Traça de Almeida, Arnaldo Gakiya Kanashiro, An assessment of the impact of Brazilian energy efficiency policies for electric motors, 2022, 5, 27724271, 100033, 10.1016/j.nexus.2021.100033 | |
| 25. | Melissa Demartini, Marco Ferrari, Kannan Govindan, Flavio Tonelli, The transition to electric vehicles and a net zero economy: A model based on circular economy, stakeholder theory, and system thinking approach, 2023, 09596526, 137031, 10.1016/j.jclepro.2023.137031 | |
| 26. | Esteban Lopez-Arboleda, Alfonso T. Sarmiento, Laura M. Cardenas, Policy assessment for electromobility promotion in Colombia: A system dynamics approach, 2023, 121, 13619209, 103799, 10.1016/j.trd.2023.103799 | |
| 27. | Jibin Li, Xuan Li, Huan Liu, Li Gao, Weitong Wang, Zhenyao Wang, Ting Zhou, Qilin Wang, Climate change impacts on wastewater infrastructure: A systematic review and typological adaptation strategy, 2023, 242, 00431354, 120282, 10.1016/j.watres.2023.120282 | |
| 28. | Fayez Alanazi, Mamdouh Alenezi, Software Engineering Techniques for Building Sustainable Cities with Electric Vehicles, 2023, 13, 2076-3417, 8741, 10.3390/app13158741 | |
| 29. | Metin İlbasmış, Mücahit Çitil, Furkan Demirtaş, Muhammad Ali, Abdulkadir Barut, Mohammad Mohsin, Does green investments improve air quality? Evidence for developed and developing European countries, 2023, 1614-7499, 10.1007/s11356-023-28544-3 | |
| 30. | Yung-Shuen Shen, Guan-Ting Huang, Chien-Li Chang-Chien, Lance Hongwei Huang, Chien-Hung Kuo, Allen H. Hu, The impact of passenger electric vehicles on carbon reduction and environmental impact under the 2050 net zero policy in Taiwan, 2023, 183, 03014215, 113838, 10.1016/j.enpol.2023.113838 | |
| 31. | Husan Khodjibabayev, Bahadir Ismailkhodjaev, Malokhat Abdukodirova, Dildora Mavlyanova, Ibrokhim Israilov, T. Samandarov, D. Bazarov, Analysis of chlorophyll “a”, “b”, and carotenoids in leaves of oriental maple, biota, common oak, and chestnut trees resistant to harmful substances emitted by motor vehicles in Tashkent city, 2023, 401, 2267-1242, 02032, 10.1051/e3sconf/202340102032 | |
| 32. | Ramesh Chandra Nayak, Arvind B. Bodhe, Jainendra Chauhan, Mahesh Vasantrao Kulkarni, Naushad Hasin Khan, Amey R. Khedikar, Pratik C. Ghutke, 2024, Chapter 14, 978-3-031-59845-6, 323, 10.1007/978-3-031-59846-3_14 | |
| 33. | Tingke Fang, Coleman Vairin, Annette von Jouanne, Emmanuel Agamloh, Alex Yokochi, Review of Fuel-Cell Electric Vehicles, 2024, 17, 1996-1073, 2160, 10.3390/en17092160 | |
| 34. | Odoligie Imarhiagbe, Matthew C. Ogwu, Ebiuwa G. Obahiagbon, Nicolas A. Poggioli, 2024, Chapter 1117, 1867-979X, 10.1007/698_2024_1117 | |
| 35. | A Johnson Antony, Selvajyothi Kamakshy, 2024, Extended Kalman Filter Based Estimation of the State of Charge of Lithium Iron Phosphate Battery Using an Equivalent Circuit Model, 979-8-3503-7929-7, 1, 10.1109/ICEPE63236.2024.10668934 | |
| 36. | Xu Hao, Deyu Zhou, Ruiheng Zhong, Shunxi Li, Xianming Meng, Bo Liu, Electrification pathways for light-duty logistics vehicles based on perceived cost of ownership in Northern China, 2024, 3, 2831-932X, 10.20517/cf.2024.24 | |
| 37. | Hunter Kellerman, Jess C. Mace, Kara Y. Detwiller, Mathew Geltzeiler, Timothy L. Smith, Vivek C. Pandrangi, Travel Costs and Carbon Savings Associated With Telemedicine in a Tertiary Care Rhinology Center, 2025, 2042-6976, 10.1002/alr.23540 | |
| 38. | Rock Agon, Barry Rawn, 2024, Optimizing Grid Performance through Vehicle-to-Grid Integration: A Comprehensive Review, 979-8-3503-8612-7, 1, 10.1109/APPEEC61255.2024.10922355 | |
| 39. | Vibhor Gupta, Suresh Chaudhary, Olajide Fadare, Shilpa Senapati, Sushil Beriwal, Comparison of Energy Consumption Between Single Energy O-Gantry and Dual Energy C-Arm Linear Accelerator, 2025, 10, 24521094, 101762, 10.1016/j.adro.2025.101762 |
Larry E. Erickson, Merrisa Jennings. Energy, Transportation, Air Quality, Climate Change, Health Nexus: Sustainable Energy is Good for Our Health[J]. AIMS Public Health, 2017, 4(1): 47-61. doi: 10.3934/publichealth.2017.1.47

| Variable | Item | Measurement Item | Source |
| Intention to re-consume (INT) | INT1 | I intend to repurchase organic foods. | [17,35] |
| INT2 | I intend to eat more organically processed foods in the future. | ||
| INT3 | I would like to repurchase organic food because it is the best option. | ||
| INT4 | I would like to reintroduce organic food, particularly environmentally friendly products. | ||
| INT5 | I would like to re-consume organic food, preferably healthy and nutritious food. | ||
| INT6 | For the welfare of farmers, I would like to re-consume organic food. | ||
| Attitude (ATT) | ATT1 | Buying organic food is a good idea. | [17,35,62] |
| ATT2 | Buying organic food is a wise decision. | ||
| ATT3 | Buying organic food is important. | ||
| ATT4 | Consuming organic food is advantageous. | ||
| ATT5 | Consuming organic food is valuable. | ||
| ATT6 | Consuming organic food is interesting. | ||
| ATT7 | I like organic food because it is processed without the use of chemicals. | ||
| ATT8 | I like organic food because it is more nutritious. | ||
| ATT9 | I like organic food because it is healthier to consume. | ||
| ATT10 | I like organic food because it is environmentally friendly. | ||
| ATT11 | I like organic food because it allows me to contribute to the well-being of farmers. | ||
| Subjective norms (SN) | SN1 | Most of the people important to me think that I should eat organic food. | [62,63,64] |
| SN2 | My family believes that I should consume organic food. | ||
| SN3 | People whose opinions I value believe that I should consume organic food. | ||
| SN4 | My friend's positive feedback encourages me to consume organic food. | ||
| SN5 | My loved ones expect me to consume organic food. | ||
| SN6 | Because of external pressure (social, environmental, network, etc.), I choose organic food. | ||
| Perceived Behavior Control (PBC) | PBC1 | It is entirely up to me whether or not I buy organic food. | [17,62,63,64] |
| PBC2 | Consumers believe they can buy organic food. | ||
| PBC3 | Consumers believe they have the resources, time, and willingness to buy organic food. | ||
| PBC4 | Customers believe that they have control over whether or not they consume organic food. | ||
| PBC5 | Consumers believe that there will be numerous opportunities for them to consume organic food. | ||
| PBC6 | Consumers find it simple to consume organic food. | ||
| PBC7 | Consumers believe they can consume organic food if they desire to do so. | ||
| Sensory Appeal Perceived (SEN_APP) | SEN_APP1 | In my opinion, organic food is more attractive. | [18,40,62,65] |
| SEN_APP2 | In my opinion, organic food appears to be tasty. | ||
| SEN_APP3 | In my opinion, organic food looks fresher. (especial for rice, in question is natural / no over-processing after harvest) | ||
| SEN_APP4 | In my opinion, organic food has a pleasant texture. | ||
| Warm Glow (WG) | WG1 | Buying organic food gives me a pleasant feeling. | [17,21,51,66,67] |
| WG2 | Consuming organic food makes me happy because it makes me feel that I have done something good. | ||
| WG3 | I am happy when I can make choices to consume organic food, for myself and my family. | ||
| WG4 | Every time I consume organic food, I feel good about myself because I have protected the environment. | ||
| WG5 | I am satisfied because I have contributed to the efficiency of natural resources by consuming organic food. | ||
| WG6 | Consuming organic food makes me feel good because it contributes to the preservation of the quality of the Earth (soil, water, etc.). | ||
| WG7 | Purchasing organic food makes me happy because I am contributing to the well-being of farmers. | ||
| WG8 | I am pleased that I have contributed to the growth of the local economy by purchasing organic food. | ||
| Egoistic motive (E) | E1 | I eat organic food to better maintain my health. | [1,23,45,68] |
| E2 | Organic food is the food that my family consumes for the sake of our family's health. | ||
| E3 | I eat organic food to provide my body with more nutrition. | ||
| E4 | I choose organic foods to obtain products that are safer to consume. |
DownLoad:
CSV
| Demographic Variable | N | % | |
| Age (years old) | 17–25 | 179 | 53.12 |
| 26–35 | 97 | 28.78 | |
| 36–45 | 25 | 7.42 | |
| 56–55 | 31 | 9.20 | |
| > 56 | 5 | 1.48 | |
| Gender | Male | 95 | 28.19 |
| Female | 242 | 71.81 | |
| Education qualification | Higher secondary | 52 | 15.43 |
| Graduate | 212 | 62.91 | |
| Postgraduate | 71 | 21.07 | |
| Any other | 2 | 0.59 | |
| Marital status | Single | 210 | 62.31 |
| Married | 127 | 37.69 | |
| Employment status | Employed | 171 | 50.74 |
| Unemployed | 12 | 3.56 | |
| Retired | 2 | 0.59 | |
| Homemaker | 37 | 10.98 | |
| Student | 115 | 34.12 | |
DownLoad:
CSV
| CR | AVE | 1 | 2 | 3 | 4 | 5 | 6 | 7 | |
| 1.Attitude | 0.953 | 0.649 | |||||||
| 2.Egoistic motive | 0.943 | 0.806 | 0.808 | ||||||
| 3.Intention to re-consume | 0.955 | 0.781 | 0.589 | 0.536 | |||||
| 4.PBC | 0.918 | 0.650 | 0.531 | 0.485 | 0.605 | ||||
| 5.Sesory appeal | 0.905 | 0.705 | 0.524 | 0.365 | 0.541 | 0.485 | |||
| 6.Subjecctive norms | 0.931 | 0.731 | 0.473 | 0.345 | 0.394 | 0.401 | 0.476 | ||
| 7.Warm Glow | 0.959 | 0.747 | 0.768 | 0.689 | 0.547 | 0.494 | 0.452 | 0.394 |
DownLoad:
CSV
| Hypothesis | Path | Std Beta | t-value | Result | f2 |
| H1 | ATT → INT | 0.289 | 3.518* | Supported | 0.097 |
| SN → ATT | 0.112 | 3.271* | Supported | 0.033 | |
| SN → INT | 0.042 | 0.816ns | Rejected | 0.002 | |
| PBC → INT | 0.313 | 4.738* | Supported | 0.125 | |
| H2 | SEN_APP → ATT | 0.141 | 2.763* | Supported | 0.050 |
| SEN_APP → INT | 0.204 | 3.045* | Supported | 0.052 | |
| H3 | E → ATT | 0.457 | 8.594* | Supported | 0.405 |
| WG → ATT | 0.333 | 7.542* | Supported | 0.197 | |
| Note: *p < 0.05. | |||||
DownLoad:
CSV
| Items | Outer Loading | Cross Loading | ||||||||||||
| ATT | E | INT | PBC | SEN_APP | SN | WG | ATT | E | INT | PBC | SEN_APP | SN | WG | |
| SEN_APP.1 | 0.812 | 0.342 | 0.219 | 0.352 | 0.328 | 0.812 | 0.346 | 0.282 | ||||||
| SEN_APP.2 | 0.842 | 0.356 | 0.247 | 0.390 | 0.302 | 0.842 | 0.387 | 0.296 | ||||||
| SEN_APP.3 | 0.859 | 0.469 | 0.312 | 0.411 | 0.393 | 0.859 | 0.317 | 0.395 | ||||||
| SEN_APP.4 | 0.845 | 0.418 | 0.314 | 0.490 | 0.407 | 0.845 | 0.362 | 0.400 | ||||||
| WG.1 | 0.839 | 0.657 | 0.605 | 0.429 | 0.394 | 0.351 | 0.357 | 0.839 | ||||||
| WG.2 | 0.837 | 0.590 | 0.511 | 0.468 | 0.423 | 0.353 | 0.311 | 0.837 | ||||||
| WG.3 | 0.860 | 0.621 | 0.605 | 0.448 | 0.387 | 0.348 | 0.336 | 0.860 | ||||||
| WG.4 | 0.902 | 0.648 | 0.579 | 0.468 | 0.410 | 0.381 | 0.314 | 0.902 | ||||||
| WG.5 | 0.896 | 0.646 | 0.554 | 0.458 | 0.388 | 0.354 | 0.315 | 0.896 | ||||||
| WG.6 | 0.879 | 0.644 | 0.618 | 0.425 | 0.383 | 0.335 | 0.271 | 0.879 | ||||||
| WG.7 | 0.854 | 0.600 | 0.474 | 0.473 | 0.386 | 0.393 | 0.334 | 0.854 | ||||||
| WG.8 | 0.847 | 0.625 | 0.512 | 0.422 | 0.363 | 0.359 | 0.315 | 0.847 | ||||||
| SN.1 | 0.858 | 0.327 | 0.308 | 0.314 | 0.333 | 0.340 | 0.858 | 0.266 | ||||||
| SN.2 | 0.889 | 0.370 | 0.291 | 0.342 | 0.356 | 0.372 | 0.889 | 0.304 | ||||||
| SN.3 | 0.868 | 0.429 | 0.294 | 0.324 | 0.299 | 0.351 | 0.868 | 0.377 | ||||||
| SN.4 | 0.781 | 0.326 | 0.156 | 0.234 | 0.245 | 0.356 | 0.781 | 0.275 | ||||||
| SN.5 | 0.875 | 0.415 | 0.298 | 0.348 | 0.314 | 0.374 | 0.875 | 0.341 | ||||||
| PBC.2 | 0.807 | 0.347 | 0.386 | 0.454 | 0.807 | 0.323 | 0.302 | 0.353 | ||||||
| PBC.3 | 0.865 | 0.434 | 0.410 | 0.491 | 0.865 | 0.342 | 0.408 | 0.359 | ||||||
| PBC.4 | 0.746 | 0.337 | 0.296 | 0.415 | 0.746 | 0.321 | 0.192 | 0.359 | ||||||
| PBC.5 | 0.824 | 0.449 | 0.347 | 0.486 | 0.824 | 0.397 | 0.296 | 0.377 | ||||||
| PBC.6 | 0.766 | 0.369 | 0.331 | 0.376 | 0.766 | 0.349 | 0.328 | 0.376 | ||||||
| PBC.7 | 0.824 | 0.421 | 0.350 | 0.462 | 0.824 | 0.350 | 0.226 | 0.375 | ||||||
| E.1 | 0.899 | 0.682 | 0.899 | 0.420 | 0.357 | 0.281 | 0.296 | 0.583 | ||||||
| E.2 | 0.888 | 0.655 | 0.888 | 0.449 | 0.431 | 0.285 | 0.316 | 0.556 | ||||||
| E.3 | 0.907 | 0.702 | 0.907 | 0.463 | 0.402 | 0.299 | 0.301 | 0.584 | ||||||
| E.4 | 0.898 | 0.670 | 0.898 | 0.460 | 0.390 | 0.321 | 0.234 | 0.597 | ||||||
| INT.1 | 0.900 | 0.462 | 0.481 | 0.900 | 0.504 | 0.407 | 0.318 | 0.448 | ||||||
| INT.2 | 0.904 | 0.461 | 0.435 | 0.904 | 0.504 | 0.409 | 0.322 | 0.427 | ||||||
| INT.3 | 0.886 | 0.507 | 0.466 | 0.886 | 0.476 | 0.448 | 0.335 | 0.469 | ||||||
| INT.4 | 0.908 | 0.526 | 0.448 | 0.908 | 0.482 | 0.437 | 0.316 | 0.466 | ||||||
| INT.5 | 0.896 | 0.517 | 0.462 | 0.896 | 0.495 | 0.420 | 0.315 | 0.459 | ||||||
| INT.6 | 0.803 | 0.481 | 0.353 | 0.803 | 0.492 | 0.494 | 0.345 | 0.475 | ||||||
| ATT.1 | 0.847 | 0.847 | 0.610 | 0.439 | 0.413 | 0.367 | 0.312 | 0.613 | ||||||
| ATT.10 | 0.857 | 0.857 | 0.647 | 0.492 | 0.383 | 0.384 | 0.356 | 0.618 | ||||||
| ATT.11 | 0.778 | 0.778 | 0.515 | 0.514 | 0.417 | 0.441 | 0.408 | 0.633 | ||||||
| ATT.2 | 0.843 | 0.843 | 0.629 | 0.414 | 0.420 | 0.357 | 0.325 | 0.615 | ||||||
| ATT.3 | 0.750 | 0.750 | 0.565 | 0.413 | 0.384 | 0.423 | 0.424 | 0.564 | ||||||
| ATT.4 | 0.803 | 0.803 | 0.615 | 0.429 | 0.462 | 0.370 | 0.441 | 0.579 | ||||||
| ATT.5 | 0.858 | 0.858 | 0.660 | 0.475 | 0.373 | 0.355 | 0.276 | 0.585 | ||||||
| ATT.6 | 0.723 | 0.723 | 0.498 | 0.375 | 0.399 | 0.404 | 0.351 | 0.556 | ||||||
| ATT.7 | 0.758 | 0.758 | 0.605 | 0.422 | 0.337 | 0.345 | 0.306 | 0.540 | ||||||
| ATT.8 | 0.766 | 0.766 | 0.621 | 0.440 | 0.317 | 0.414 | 0.385 | 0.554 | ||||||
| ATT.9 | 0.865 | 0.865 | 0.705 | 0.516 | 0.429 | 0.371 | 0.324 | 0.594 | ||||||
| Description: ATT: Attitude; E: Egoistic; INT: Intention to re-consume; PBC: Perceived Behavioral Control; SEN_APP: Sensory Appeal Perceived; SN: Subjective norm; WG: Warm Glow. | ||||||||||||||
DownLoad:
CSV
| Mean | Standard Deviation | Matrix Correlations | ||||||||||
| WG.1 | WG.2 | WG.3 | WG.4 | WG.5 | WG.6 | WG.7 | WG.8 | E.1 | E.2 | |||
| WG.1 | 4.228 | 0.738 | 1.000 | |||||||||
| WG.2 | 4.267 | 0.702 | 0.771 | 1.000 | ||||||||
| WG.3 | 4.270 | 0.744 | 0.774 | 0.726 | 1.000 | |||||||
| WG.4 | 4.285 | 0.740 | 0.690 | 0.693 | 0.755 | 1.000 | ||||||
| WG.5 | 4.279 | 0.778 | 0.654 | 0.685 | 0.721 | 0.852 | 1.000 | |||||
| WG.6 | 4.356 | 0.713 | 0.652 | 0.658 | 0.703 | 0.814 | 0.833 | 1.000 | ||||
| WG.7 | 4.246 | 0.764 | 0.632 | 0.652 | 0.630 | 0.716 | 0.724 | 0.700 | 1.000 | |||
| WG.8 | 4.208 | 0.792 | 0.620 | 0.621 | 0.635 | 0.704 | 0.715 | 0.705 | 0.867 | 1.000 | ||
| E.1 | 4.513 | 0.702 | 0.564 | 0.450 | 0.570 | 0.535 | 0.499 | 0.571 | 0.401 | 0.432 | 1.000 | |
| E.2 | 4.288 | 0.806 | 0.513 | 0.441 | 0.524 | 0.494 | 0.468 | 0.508 | 0.425 | 0.464 | 0.735 | 1.000 |
| E.3 | 4.365 | 0.774 | 0.529 | 0.465 | 0.535 | 0.523 | 0.516 | 0.544 | 0.435 | 0.486 | 0.730 | 0.758 |
| E.4 | 4.501 | 0.698 | 0.567 | 0.478 | 0.545 | 0.527 | 0.508 | 0.595 | 0.442 | 0.456 | 0.764 | 0.703 |
| E.5 | 3.202 | 1.211 | 0.307 | 0.289 | 0.289 | 0.283 | 0.303 | 0.226 | 0.264 | 0.318 | 0.283 | 0.302 |
| E.6 | 3.685 | 1.117 | 0.454 | 0.421 | 0.431 | 0.421 | 0.395 | 0.398 | 0.418 | 0.466 | 0.433 | 0.413 |
| E.7 | 3.644 | 1.152 | 0.448 | 0.426 | 0.382 | 0.401 | 0.392 | 0.382 | 0.420 | 0.393 | 0.321 | 0.347 |
| ATT.1 | 4.395 | 0.659 | 0.608 | 0.510 | 0.515 | 0.554 | 0.543 | 0.560 | 0.467 | 0.474 | 0.569 | 0.529 |
| ATT.2 | 4.344 | 0.693 | 0.577 | 0.512 | 0.522 | 0.555 | 0.565 | 0.538 | 0.473 | 0.507 | 0.569 | 0.566 |
| ATT.3 | 4.145 | 0.847 | 0.479 | 0.469 | 0.517 | 0.506 | 0.492 | 0.465 | 0.458 | 0.512 | 0.498 | 0.560 |
| ATT.4 | 4.193 | 0.771 | 0.522 | 0.470 | 0.499 | 0.527 | 0.514 | 0.485 | 0.468 | 0.512 | 0.502 | 0.588 |
| ATT.5 | 4.469 | 0.640 | 0.534 | 0.494 | 0.476 | 0.526 | 0.519 | 0.571 | 0.450 | 0.470 | 0.587 | 0.578 |
| ATT.6 | 4.139 | 0.834 | 0.527 | 0.469 | 0.489 | 0.464 | 0.475 | 0.450 | 0.491 | 0.482 | 0.460 | 0.439 |
| ATT.7 | 4.475 | 0.739 | 0.498 | 0.465 | 0.469 | 0.474 | 0.477 | 0.479 | 0.445 | 0.425 | 0.582 | 0.503 |
| ATT.8 | 4.329 | 0.783 | 0.471 | 0.423 | 0.479 | 0.489 | 0.512 | 0.508 | 0.450 | 0.493 | 0.556 | 0.489 |
| ATT.9 | 4.528 | 0.631 | 0.551 | 0.439 | 0.518 | 0.523 | 0.529 | 0.578 | 0.469 | 0.487 | 0.648 | 0.553 |
| ATT.10 | 4.481 | 0.654 | 0.523 | 0.470 | 0.520 | 0.600 | 0.582 | 0.588 | 0.482 | 0.500 | 0.619 | 0.548 |
| ATT.11 | 4.362 | 0.739 | 0.534 | 0.518 | 0.497 | 0.517 | 0.506 | 0.471 | 0.663 | 0.678 | 0.437 | 0.448 |
| SN.1 | 3.706 | 0.953 | 0.281 | 0.237 | 0.292 | 0.220 | 0.247 | 0.171 | 0.193 | 0.199 | 0.301 | 0.303 |
| SN.2 | 3.712 | 0.976 | 0.297 | 0.273 | 0.279 | 0.245 | 0.262 | 0.211 | 0.270 | 0.269 | 0.268 | 0.294 |
| SN.3 | 3.742 | 0.972 | 0.384 | 0.319 | 0.363 | 0.333 | 0.327 | 0.282 | 0.325 | 0.274 | 0.268 | 0.265 |
| SN.4 | 3.724 | 0.992 | 0.253 | 0.230 | 0.218 | 0.232 | 0.215 | 0.189 | 0.313 | 0.258 | 0.157 | 0.159 |
| SN.5 | 3.733 | 0.990 | 0.299 | 0.261 | 0.271 | 0.298 | 0.282 | 0.286 | 0.323 | 0.336 | 0.261 | 0.312 |
| SN.6 | 3.932 | 0.974 | 0.381 | 0.244 | 0.345 | 0.295 | 0.303 | 0.279 | 0.334 | 0.307 | 0.307 | 0.275 |
| SN.7 | 2.861 | 1.315 | 0.131 | 0.108 | 0.087 | 0.074 | 0.108 | 0.043 | 0.132 | 0.159 | 0.058 | 0.074 |
| PBC.1 | 4.318 | 0.733 | 0.310 | 0.331 | 0.327 | 0.271 | 0.298 | 0.306 | 0.274 | 0.244 | 0.289 | 0.252 |
| PBC.2 | 4.181 | 0.680 | 0.314 | 0.309 | 0.267 | 0.304 | 0.286 | 0.314 | 0.325 | 0.321 | 0.302 | 0.349 |
| PBC.3 | 4.160 | 0.713 | 0.325 | 0.336 | 0.293 | 0.330 | 0.326 | 0.273 | 0.309 | 0.293 | 0.322 | 0.431 |
| PBC.4 | 4.228 | 0.726 | 0.329 | 0.335 | 0.309 | 0.277 | 0.303 | 0.302 | 0.321 | 0.310 | 0.271 | 0.258 |
| PBC.5 | 4.240 | 0.679 | 0.323 | 0.388 | 0.312 | 0.360 | 0.322 | 0.307 | 0.321 | 0.277 | 0.270 | 0.356 |
| PBC.6 | 4.039 | 0.841 | 0.287 | 0.349 | 0.363 | 0.349 | 0.337 | 0.323 | 0.295 | 0.300 | 0.243 | 0.364 |
| PBC.7 | 4.291 | 0.657 | 0.328 | 0.334 | 0.343 | 0.367 | 0.312 | 0.343 | 0.301 | 0.266 | 0.313 | 0.324 |
| SEN_APP.1 | 4.104 | 0.761 | 0.243 | 0.265 | 0.228 | 0.248 | 0.202 | 0.183 | 0.313 | 0.274 | 0.167 | 0.203 |
| SEN_APP.2 | 4.053 | 0.745 | 0.242 | 0.251 | 0.269 | 0.263 | 0.266 | 0.249 | 0.248 | 0.258 | 0.203 | 0.212 |
| SEN_APP.3 | 4.276 | 0.688 | 0.344 | 0.302 | 0.347 | 0.370 | 0.350 | 0.326 | 0.362 | 0.331 | 0.278 | 0.253 |
| SEN_APP.4 | 4.172 | 0.689 | 0.331 | 0.353 | 0.309 | 0.375 | 0.348 | 0.340 | 0.382 | 0.331 | 0.277 | 0.279 |
| INT.1 | 4.374 | 0.594 | 0.387 | 0.423 | 0.416 | 0.399 | 0.397 | 0.365 | 0.379 | 0.333 | 0.408 | 0.432 |
| INT.2 | 4.374 | 0.604 | 0.354 | 0.416 | 0.376 | 0.399 | 0.359 | 0.359 | 0.379 | 0.315 | 0.359 | 0.388 |
| INT.3 | 4.276 | 0.670 | 0.413 | 0.436 | 0.398 | 0.410 | 0.416 | 0.366 | 0.424 | 0.384 | 0.374 | 0.457 |
| INT.4 | 4.350 | 0.603 | 0.380 | 0.438 | 0.411 | 0.421 | 0.431 | 0.393 | 0.392 | 0.357 | 0.395 | 0.366 |
| INT.5 | 4.392 | 0.597 | 0.383 | 0.409 | 0.416 | 0.405 | 0.416 | 0.404 | 0.400 | 0.342 | 0.412 | 0.400 |
| INT.6 | 4.326 | 0.658 | 0.354 | 0.357 | 0.353 | 0.442 | 0.402 | 0.359 | 0.525 | 0.496 | 0.279 | 0.337 |
DownLoad:
CSV
| E.3 | E.4 | E.5 | E.6 | E.7 | ATT.1 | ATT.2 | ATT.3 | ATT.4 | ATT.5 | ATT.6 | ATT.7 | |
| E.3 | 1.000 | |||||||||||
| E.4 | 0.759 | 1.000 | ||||||||||
| E.5 | 0.320 | 0.221 | 1.000 | |||||||||
| E.6 | 0.452 | 0.392 | 0.703 | 1.000 | ||||||||
| E.7 | 0.362 | 0.303 | 0.660 | 0.741 | 1.000 | |||||||
| ATT.1 | 0.537 | 0.556 | 0.268 | 0.390 | 0.376 | 1.000 | ||||||
| ATT.2 | 0.578 | 0.544 | 0.320 | 0.415 | 0.425 | 0.858 | 1.000 | |||||
| ATT.3 | 0.525 | 0.449 | 0.414 | 0.475 | 0.384 | 0.625 | 0.657 | 1.000 | ||||
| ATT.4 | 0.612 | 0.504 | 0.359 | 0.432 | 0.425 | 0.650 | 0.697 | 0.656 | 1.000 | |||
| ATT.5 | 0.601 | 0.603 | 0.192 | 0.331 | 0.307 | 0.757 | 0.720 | 0.597 | 0.677 | 1.000 | ||
| ATT.6 | 0.445 | 0.446 | 0.372 | 0.429 | 0.438 | 0.591 | 0.579 | 0.534 | 0.618 | 0.567 | 1.000 | |
| ATT.7 | 0.532 | 0.557 | 0.148 | 0.289 | 0.279 | 0.572 | 0.544 | 0.421 | 0.521 | 0.602 | 0.461 | 1.000 |
| ATT.8 | 0.639 | 0.539 | 0.337 | 0.454 | 0.400 | 0.530 | 0.529 | 0.514 | 0.558 | 0.610 | 0.480 | 0.607 |
| ATT.9 | 0.650 | 0.679 | 0.191 | 0.329 | 0.271 | 0.676 | 0.650 | 0.551 | 0.602 | 0.740 | 0.531 | 0.723 |
| ATT.10 | 0.573 | 0.583 | 0.222 | 0.353 | 0.322 | 0.661 | 0.669 | 0.565 | 0.599 | 0.717 | 0.552 | 0.688 |
| ATT.11 | 0.511 | 0.454 | 0.247 | 0.422 | 0.354 | 0.578 | 0.568 | 0.542 | 0.549 | 0.589 | 0.549 | 0.566 |
| SN.1 | 0.278 | 0.226 | 0.386 | 0.298 | 0.302 | 0.227 | 0.247 | 0.299 | 0.344 | 0.197 | 0.268 | 0.244 |
| SN.2 | 0.284 | 0.199 | 0.363 | 0.292 | 0.273 | 0.269 | 0.278 | 0.366 | 0.389 | 0.216 | 0.279 | 0.247 |
| SN.3 | 0.283 | 0.239 | 0.372 | 0.371 | 0.416 | 0.326 | 0.343 | 0.388 | 0.407 | 0.285 | 0.312 | 0.315 |
| SN.4 | 0.154 | 0.088 | 0.333 | 0.307 | 0.363 | 0.212 | 0.224 | 0.366 | 0.349 | 0.176 | 0.344 | 0.211 |
| SN.5 | 0.270 | 0.228 | 0.347 | 0.370 | 0.349 | 0.284 | 0.281 | 0.390 | 0.390 | 0.287 | 0.308 | 0.279 |
| SN.6 | 0.281 | 0.260 | 0.261 | 0.305 | 0.365 | 0.319 | 0.303 | 0.350 | 0.349 | 0.332 | 0.399 | 0.305 |
| SN.7 | 0.065 | 0.021 | 0.396 | 0.330 | 0.314 | 0.101 | 0.114 | 0.242 | 0.167 | 0.032 | 0.229 | 0.044 |
| PBC.1 | 0.287 | 0.309 | 0.122 | 0.111 | 0.148 | 0.287 | 0.270 | 0.208 | 0.228 | 0.265 | 0.219 | 0.209 |
| PBC.2 | 0.365 | 0.371 | 0.161 | 0.196 | 0.219 | 0.244 | 0.233 | 0.238 | 0.329 | 0.282 | 0.280 | 0.260 |
| PBC.3 | 0.383 | 0.339 | 0.217 | 0.216 | 0.214 | 0.358 | 0.375 | 0.335 | 0.446 | 0.323 | 0.337 | 0.329 |
| PBC.4 | 0.253 | 0.283 | 0.241 | 0.220 | 0.207 | 0.277 | 0.262 | 0.255 | 0.266 | 0.255 | 0.295 | 0.224 |
| PBC.5 | 0.301 | 0.321 | 0.161 | 0.182 | 0.223 | 0.418 | 0.398 | 0.367 | 0.416 | 0.342 | 0.381 | 0.322 |
| PBC.6 | 0.325 | 0.260 | 0.287 | 0.259 | 0.256 | 0.288 | 0.359 | 0.354 | 0.409 | 0.248 | 0.293 | 0.214 |
| PBC.7 | 0.316 | 0.303 | 0.169 | 0.214 | 0.227 | 0.399 | 0.399 | 0.313 | 0.364 | 0.339 | 0.337 | 0.266 |
| SEN_APP.1 | 0.213 | 0.203 | 0.341 | 0.349 | 0.296 | 0.279 | 0.258 | 0.335 | 0.304 | 0.229 | 0.342 | 0.229 |
| SEN_APP.2 | 0.244 | 0.228 | 0.347 | 0.359 | 0.278 | 0.253 | 0.263 | 0.364 | 0.282 | 0.246 | 0.294 | 0.223 |
| SEN_APP.3 | 0.273 | 0.317 | 0.225 | 0.283 | 0.251 | 0.401 | 0.348 | 0.390 | 0.358 | 0.374 | 0.362 | 0.373 |
| SEN_APP.4 | 0.266 | 0.308 | 0.250 | 0.329 | 0.335 | 0.288 | 0.317 | 0.333 | 0.295 | 0.322 | 0.356 | 0.312 |
| INT.1 | 0.439 | 0.449 | 0.209 | 0.240 | 0.260 | 0.358 | 0.336 | 0.322 | 0.348 | 0.390 | 0.302 | 0.400 |
| INT.2 | 0.400 | 0.414 | 0.221 | 0.214 | 0.268 | 0.382 | 0.352 | 0.317 | 0.323 | 0.407 | 0.303 | 0.367 |
| INT.3 | 0.423 | 0.421 | 0.260 | 0.298 | 0.354 | 0.405 | 0.409 | 0.410 | 0.431 | 0.432 | 0.356 | 0.359 |
| INT.4 | 0.431 | 0.414 | 0.200 | 0.247 | 0.260 | 0.406 | 0.400 | 0.376 | 0.416 | 0.451 | 0.351 | 0.412 |
| INT.5 | 0.429 | 0.418 | 0.198 | 0.260 | 0.267 | 0.421 | 0.355 | 0.386 | 0.383 | 0.428 | 0.343 | 0.419 |
| INT.6 | 0.331 | 0.322 | 0.237 | 0.305 | 0.286 | 0.353 | 0.339 | 0.372 | 0.367 | 0.405 | 0.328 | 0.279 |
DownLoad:
CSV
| ATT.8 | ATT.9 | ATT.10 | ATT.11 | SN.1 | SN.2 | SN.3 | SN.4 | SN.5 | SN.6 | SN.7 | PBC.1 | |
| ATT.8 | 1.000 | |||||||||||
| ATT.9 | 0.694 | 1.000 | ||||||||||
| ATT.10 | 0.624 | 0.802 | 1.000 | |||||||||
| ATT.11 | 0.620 | 0.641 | 0.672 | 1.000 | ||||||||
| SN.1 | 0.289 | 0.243 | 0.274 | 0.273 | 1.000 | |||||||
| SN.2 | 0.326 | 0.271 | 0.291 | 0.350 | 0.764 | 1.000 | ||||||
| SN.3 | 0.357 | 0.334 | 0.354 | 0.382 | 0.687 | 0.697 | 1.000 | |||||
| SN.4 | 0.274 | 0.200 | 0.241 | 0.311 | 0.552 | 0.568 | 0.653 | 1.000 | ||||
| SN.5 | 0.382 | 0.316 | 0.345 | 0.412 | 0.672 | 0.750 | 0.653 | 0.636 | 1.000 | |||
| SN.6 | 0.361 | 0.349 | 0.368 | 0.360 | 0.423 | 0.401 | 0.480 | 0.595 | 0.483 | 1.000 | ||
| SN.7 | 0.154 | 0.067 | 0.116 | 0.196 | 0.467 | 0.461 | 0.422 | 0.524 | 0.489 | 0.421 | 1.000 | |
| PBC.1 | 0.185 | 0.337 | 0.257 | 0.210 | 0.121 | 0.115 | 0.115 | 0.043 | 0.043 | 0.064 | -0.040 | 1.000 |
| PBC.2 | 0.256 | 0.358 | 0.271 | 0.313 | 0.293 | 0.302 | 0.214 | 0.149 | 0.319 | 0.167 | 0.018 | 0.468 |
| PBC.3 | 0.272 | 0.353 | 0.338 | 0.380 | 0.371 | 0.420 | 0.329 | 0.251 | 0.359 | 0.272 | 0.109 | 0.436 |
| PBC.4 | 0.265 | 0.307 | 0.244 | 0.333 | 0.174 | 0.181 | 0.168 | 0.174 | 0.130 | 0.127 | 0.046 | 0.650 |
| PBC.5 | 0.225 | 0.383 | 0.368 | 0.365 | 0.270 | 0.256 | 0.260 | 0.231 | 0.250 | 0.218 | 0.057 | 0.335 |
| PBC.6 | 0.242 | 0.280 | 0.306 | 0.278 | 0.310 | 0.339 | 0.277 | 0.201 | 0.269 | 0.166 | 0.077 | 0.360 |
| PBC.7 | 0.275 | 0.381 | 0.317 | 0.339 | 0.189 | 0.223 | 0.196 | 0.173 | 0.183 | 0.198 | 0.033 | 0.424 |
| SEN_APP.1 | 0.281 | 0.207 | 0.228 | 0.355 | 0.308 | 0.316 | 0.269 | 0.309 | 0.289 | 0.226 | 0.213 | 0.138 |
| SEN_APP.2 | 0.326 | 0.281 | 0.307 | 0.315 | 0.336 | 0.364 | 0.343 | 0.305 | 0.309 | 0.230 | 0.217 | 0.148 |
| SEN_APP.3 | 0.394 | 0.376 | 0.385 | 0.399 | 0.255 | 0.273 | 0.284 | 0.290 | 0.261 | 0.299 | 0.121 | 0.238 |
| SEN_APP.4 | 0.374 | 0.358 | 0.350 | 0.402 | 0.258 | 0.307 | 0.288 | 0.295 | 0.389 | 0.261 | 0.138 | 0.227 |
| INT.1 | 0.348 | 0.471 | 0.408 | 0.395 | 0.288 | 0.308 | 0.260 | 0.195 | 0.296 | 0.301 | 0.082 | 0.382 |
| INT.2 | 0.336 | 0.440 | 0.424 | 0.415 | 0.284 | 0.313 | 0.265 | 0.182 | 0.316 | 0.281 | 0.088 | 0.375 |
| INT.3 | 0.392 | 0.428 | 0.422 | 0.440 | 0.290 | 0.307 | 0.292 | 0.213 | 0.317 | 0.338 | 0.128 | 0.341 |
| INT.4 | 0.397 | 0.504 | 0.476 | 0.455 | 0.267 | 0.292 | 0.301 | 0.191 | 0.286 | 0.283 | 0.103 | 0.346 |
| INT.5 | 0.428 | 0.498 | 0.467 | 0.432 | 0.270 | 0.285 | 0.281 | 0.208 | 0.292 | 0.296 | 0.077 | 0.360 |
| INT.6 | 0.425 | 0.392 | 0.407 | 0.581 | 0.266 | 0.303 | 0.312 | 0.247 | 0.334 | 0.252 | 0.114 | 0.259 |
DownLoad:
CSV
| PBC.2 | PBC.3 | PBC.4 | PBC.5 | PBC.6 | PBC.7 | SEN_APP.1 | SEN_APP.2 | SEN_APP.3 | SEN_APP.4 | INT.1 | INT.2 | |
| PBC.2 | 1.000 | |||||||||||
| PBC.3 | 0.723 | 1.000 | ||||||||||
| PBC.4 | 0.487 | 0.554 | 1.000 | |||||||||
| PBC.5 | 0.593 | 0.643 | 0.533 | 1.000 | ||||||||
| PBC.6 | 0.501 | 0.613 | 0.530 | 0.534 | 1.000 | |||||||
| PBC.7 | 0.573 | 0.616 | 0.545 | 0.641 | 0.602 | 1.000 | ||||||
| SEN_APP.1 | 0.233 | 0.275 | 0.236 | 0.307 | 0.267 | 0.266 | 1.000 | |||||
| SEN_APP.2 | 0.215 | 0.230 | 0.197 | 0.285 | 0.271 | 0.265 | 0.686 | 1.000 | ||||
| SEN_APP.3 | 0.293 | 0.309 | 0.320 | 0.360 | 0.289 | 0.328 | 0.586 | 0.603 | 1.000 | |||
| SEN_APP.4 | 0.326 | 0.324 | 0.307 | 0.368 | 0.337 | 0.309 | 0.532 | 0.589 | 0.658 | 1.000 | ||
| INT.1 | 0.420 | 0.461 | 0.366 | 0.424 | 0.351 | 0.406 | 0.295 | 0.324 | 0.336 | 0.401 | 1.000 | |
| INT.2 | 0.420 | 0.440 | 0.381 | 0.425 | 0.334 | 0.429 | 0.322 | 0.318 | 0.323 | 0.402 | 0.868 | 1.000 |
| INT.3 | 0.405 | 0.442 | 0.334 | 0.421 | 0.329 | 0.357 | 0.287 | 0.375 | 0.376 | 0.450 | 0.755 | 0.772 |
| INT.4 | 0.366 | 0.428 | 0.360 | 0.432 | 0.307 | 0.424 | 0.308 | 0.374 | 0.339 | 0.433 | 0.794 | 0.773 |
| INT.5 | 0.388 | 0.431 | 0.355 | 0.441 | 0.342 | 0.428 | 0.269 | 0.326 | 0.358 | 0.434 | 0.758 | 0.737 |
| INT.6 | 0.405 | 0.401 | 0.403 | 0.428 | 0.331 | 0.405 | 0.382 | 0.346 | 0.443 | 0.471 | 0.606 | 0.648 |
DownLoad:
CSV
| INT.3 | INT.4 | INT.5 | INT.6 | |
| INT.3 | 1.000 | |||
| INT.4 | 0.766 | 1.000 | ||
| INT.5 | 0.745 | 0.821 | 1.000 | |
| INT.6 | 0.657 | 0.653 | 0.678 | 1.000 |
DownLoad:
CSV
| Variable | Item | Measurement Item | Source |
| Intention to re-consume (INT) | INT1 | I intend to repurchase organic foods. | [17,35] |
| INT2 | I intend to eat more organically processed foods in the future. | ||
| INT3 | I would like to repurchase organic food because it is the best option. | ||
| INT4 | I would like to reintroduce organic food, particularly environmentally friendly products. | ||
| INT5 | I would like to re-consume organic food, preferably healthy and nutritious food. | ||
| INT6 | For the welfare of farmers, I would like to re-consume organic food. | ||
| Attitude (ATT) | ATT1 | Buying organic food is a good idea. | [17,35,62] |
| ATT2 | Buying organic food is a wise decision. | ||
| ATT3 | Buying organic food is important. | ||
| ATT4 | Consuming organic food is advantageous. | ||
| ATT5 | Consuming organic food is valuable. | ||
| ATT6 | Consuming organic food is interesting. | ||
| ATT7 | I like organic food because it is processed without the use of chemicals. | ||
| ATT8 | I like organic food because it is more nutritious. | ||
| ATT9 | I like organic food because it is healthier to consume. | ||
| ATT10 | I like organic food because it is environmentally friendly. | ||
| ATT11 | I like organic food because it allows me to contribute to the well-being of farmers. | ||
| Subjective norms (SN) | SN1 | Most of the people important to me think that I should eat organic food. | [62,63,64] |
| SN2 | My family believes that I should consume organic food. | ||
| SN3 | People whose opinions I value believe that I should consume organic food. | ||
| SN4 | My friend's positive feedback encourages me to consume organic food. | ||
| SN5 | My loved ones expect me to consume organic food. | ||
| SN6 | Because of external pressure (social, environmental, network, etc.), I choose organic food. | ||
| Perceived Behavior Control (PBC) | PBC1 | It is entirely up to me whether or not I buy organic food. | [17,62,63,64] |
| PBC2 | Consumers believe they can buy organic food. | ||
| PBC3 | Consumers believe they have the resources, time, and willingness to buy organic food. | ||
| PBC4 | Customers believe that they have control over whether or not they consume organic food. | ||
| PBC5 | Consumers believe that there will be numerous opportunities for them to consume organic food. | ||
| PBC6 | Consumers find it simple to consume organic food. | ||
| PBC7 | Consumers believe they can consume organic food if they desire to do so. | ||
| Sensory Appeal Perceived (SEN_APP) | SEN_APP1 | In my opinion, organic food is more attractive. | [18,40,62,65] |
| SEN_APP2 | In my opinion, organic food appears to be tasty. | ||
| SEN_APP3 | In my opinion, organic food looks fresher. (especial for rice, in question is natural / no over-processing after harvest) | ||
| SEN_APP4 | In my opinion, organic food has a pleasant texture. | ||
| Warm Glow (WG) | WG1 | Buying organic food gives me a pleasant feeling. | [17,21,51,66,67] |
| WG2 | Consuming organic food makes me happy because it makes me feel that I have done something good. | ||
| WG3 | I am happy when I can make choices to consume organic food, for myself and my family. | ||
| WG4 | Every time I consume organic food, I feel good about myself because I have protected the environment. | ||
| WG5 | I am satisfied because I have contributed to the efficiency of natural resources by consuming organic food. | ||
| WG6 | Consuming organic food makes me feel good because it contributes to the preservation of the quality of the Earth (soil, water, etc.). | ||
| WG7 | Purchasing organic food makes me happy because I am contributing to the well-being of farmers. | ||
| WG8 | I am pleased that I have contributed to the growth of the local economy by purchasing organic food. | ||
| Egoistic motive (E) | E1 | I eat organic food to better maintain my health. | [1,23,45,68] |
| E2 | Organic food is the food that my family consumes for the sake of our family's health. | ||
| E3 | I eat organic food to provide my body with more nutrition. | ||
| E4 | I choose organic foods to obtain products that are safer to consume. |
| Demographic Variable | N | % | |
| Age (years old) | 17–25 | 179 | 53.12 |
| 26–35 | 97 | 28.78 | |
| 36–45 | 25 | 7.42 | |
| 56–55 | 31 | 9.20 | |
| > 56 | 5 | 1.48 | |
| Gender | Male | 95 | 28.19 |
| Female | 242 | 71.81 | |
| Education qualification | Higher secondary | 52 | 15.43 |
| Graduate | 212 | 62.91 | |
| Postgraduate | 71 | 21.07 | |
| Any other | 2 | 0.59 | |
| Marital status | Single | 210 | 62.31 |
| Married | 127 | 37.69 | |
| Employment status | Employed | 171 | 50.74 |
| Unemployed | 12 | 3.56 | |
| Retired | 2 | 0.59 | |
| Homemaker | 37 | 10.98 | |
| Student | 115 | 34.12 | |
| CR | AVE | 1 | 2 | 3 | 4 | 5 | 6 | 7 | |
| 1.Attitude | 0.953 | 0.649 | |||||||
| 2.Egoistic motive | 0.943 | 0.806 | 0.808 | ||||||
| 3.Intention to re-consume | 0.955 | 0.781 | 0.589 | 0.536 | |||||
| 4.PBC | 0.918 | 0.650 | 0.531 | 0.485 | 0.605 | ||||
| 5.Sesory appeal | 0.905 | 0.705 | 0.524 | 0.365 | 0.541 | 0.485 | |||
| 6.Subjecctive norms | 0.931 | 0.731 | 0.473 | 0.345 | 0.394 | 0.401 | 0.476 | ||
| 7.Warm Glow | 0.959 | 0.747 | 0.768 | 0.689 | 0.547 | 0.494 | 0.452 | 0.394 |
| Hypothesis | Path | Std Beta | t-value | Result | f2 |
| H1 | ATT → INT | 0.289 | 3.518* | Supported | 0.097 |
| SN → ATT | 0.112 | 3.271* | Supported | 0.033 | |
| SN → INT | 0.042 | 0.816ns | Rejected | 0.002 | |
| PBC → INT | 0.313 | 4.738* | Supported | 0.125 | |
| H2 | SEN_APP → ATT | 0.141 | 2.763* | Supported | 0.050 |
| SEN_APP → INT | 0.204 | 3.045* | Supported | 0.052 | |
| H3 | E → ATT | 0.457 | 8.594* | Supported | 0.405 |
| WG → ATT | 0.333 | 7.542* | Supported | 0.197 | |
| Note: *p < 0.05. | |||||
| Items | Outer Loading | Cross Loading | ||||||||||||
| ATT | E | INT | PBC | SEN_APP | SN | WG | ATT | E | INT | PBC | SEN_APP | SN | WG | |
| SEN_APP.1 | 0.812 | 0.342 | 0.219 | 0.352 | 0.328 | 0.812 | 0.346 | 0.282 | ||||||
| SEN_APP.2 | 0.842 | 0.356 | 0.247 | 0.390 | 0.302 | 0.842 | 0.387 | 0.296 | ||||||
| SEN_APP.3 | 0.859 | 0.469 | 0.312 | 0.411 | 0.393 | 0.859 | 0.317 | 0.395 | ||||||
| SEN_APP.4 | 0.845 | 0.418 | 0.314 | 0.490 | 0.407 | 0.845 | 0.362 | 0.400 | ||||||
| WG.1 | 0.839 | 0.657 | 0.605 | 0.429 | 0.394 | 0.351 | 0.357 | 0.839 | ||||||
| WG.2 | 0.837 | 0.590 | 0.511 | 0.468 | 0.423 | 0.353 | 0.311 | 0.837 | ||||||
| WG.3 | 0.860 | 0.621 | 0.605 | 0.448 | 0.387 | 0.348 | 0.336 | 0.860 | ||||||
| WG.4 | 0.902 | 0.648 | 0.579 | 0.468 | 0.410 | 0.381 | 0.314 | 0.902 | ||||||
| WG.5 | 0.896 | 0.646 | 0.554 | 0.458 | 0.388 | 0.354 | 0.315 | 0.896 | ||||||
| WG.6 | 0.879 | 0.644 | 0.618 | 0.425 | 0.383 | 0.335 | 0.271 | 0.879 | ||||||
| WG.7 | 0.854 | 0.600 | 0.474 | 0.473 | 0.386 | 0.393 | 0.334 | 0.854 | ||||||
| WG.8 | 0.847 | 0.625 | 0.512 | 0.422 | 0.363 | 0.359 | 0.315 | 0.847 | ||||||
| SN.1 | 0.858 | 0.327 | 0.308 | 0.314 | 0.333 | 0.340 | 0.858 | 0.266 | ||||||
| SN.2 | 0.889 | 0.370 | 0.291 | 0.342 | 0.356 | 0.372 | 0.889 | 0.304 | ||||||
| SN.3 | 0.868 | 0.429 | 0.294 | 0.324 | 0.299 | 0.351 | 0.868 | 0.377 | ||||||
| SN.4 | 0.781 | 0.326 | 0.156 | 0.234 | 0.245 | 0.356 | 0.781 | 0.275 | ||||||
| SN.5 | 0.875 | 0.415 | 0.298 | 0.348 | 0.314 | 0.374 | 0.875 | 0.341 | ||||||
| PBC.2 | 0.807 | 0.347 | 0.386 | 0.454 | 0.807 | 0.323 | 0.302 | 0.353 | ||||||
| PBC.3 | 0.865 | 0.434 | 0.410 | 0.491 | 0.865 | 0.342 | 0.408 | 0.359 | ||||||
| PBC.4 | 0.746 | 0.337 | 0.296 | 0.415 | 0.746 | 0.321 | 0.192 | 0.359 | ||||||
| PBC.5 | 0.824 | 0.449 | 0.347 | 0.486 | 0.824 | 0.397 | 0.296 | 0.377 | ||||||
| PBC.6 | 0.766 | 0.369 | 0.331 | 0.376 | 0.766 | 0.349 | 0.328 | 0.376 | ||||||
| PBC.7 | 0.824 | 0.421 | 0.350 | 0.462 | 0.824 | 0.350 | 0.226 | 0.375 | ||||||
| E.1 | 0.899 | 0.682 | 0.899 | 0.420 | 0.357 | 0.281 | 0.296 | 0.583 | ||||||
| E.2 | 0.888 | 0.655 | 0.888 | 0.449 | 0.431 | 0.285 | 0.316 | 0.556 | ||||||
| E.3 | 0.907 | 0.702 | 0.907 | 0.463 | 0.402 | 0.299 | 0.301 | 0.584 | ||||||
| E.4 | 0.898 | 0.670 | 0.898 | 0.460 | 0.390 | 0.321 | 0.234 | 0.597 | ||||||
| INT.1 | 0.900 | 0.462 | 0.481 | 0.900 | 0.504 | 0.407 | 0.318 | 0.448 | ||||||
| INT.2 | 0.904 | 0.461 | 0.435 | 0.904 | 0.504 | 0.409 | 0.322 | 0.427 | ||||||
| INT.3 | 0.886 | 0.507 | 0.466 | 0.886 | 0.476 | 0.448 | 0.335 | 0.469 | ||||||
| INT.4 | 0.908 | 0.526 | 0.448 | 0.908 | 0.482 | 0.437 | 0.316 | 0.466 | ||||||
| INT.5 | 0.896 | 0.517 | 0.462 | 0.896 | 0.495 | 0.420 | 0.315 | 0.459 | ||||||
| INT.6 | 0.803 | 0.481 | 0.353 | 0.803 | 0.492 | 0.494 | 0.345 | 0.475 | ||||||
| ATT.1 | 0.847 | 0.847 | 0.610 | 0.439 | 0.413 | 0.367 | 0.312 | 0.613 | ||||||
| ATT.10 | 0.857 | 0.857 | 0.647 | 0.492 | 0.383 | 0.384 | 0.356 | 0.618 | ||||||
| ATT.11 | 0.778 | 0.778 | 0.515 | 0.514 | 0.417 | 0.441 | 0.408 | 0.633 | ||||||
| ATT.2 | 0.843 | 0.843 | 0.629 | 0.414 | 0.420 | 0.357 | 0.325 | 0.615 | ||||||
| ATT.3 | 0.750 | 0.750 | 0.565 | 0.413 | 0.384 | 0.423 | 0.424 | 0.564 | ||||||
| ATT.4 | 0.803 | 0.803 | 0.615 | 0.429 | 0.462 | 0.370 | 0.441 | 0.579 | ||||||
| ATT.5 | 0.858 | 0.858 | 0.660 | 0.475 | 0.373 | 0.355 | 0.276 | 0.585 | ||||||
| ATT.6 | 0.723 | 0.723 | 0.498 | 0.375 | 0.399 | 0.404 | 0.351 | 0.556 | ||||||
| ATT.7 | 0.758 | 0.758 | 0.605 | 0.422 | 0.337 | 0.345 | 0.306 | 0.540 | ||||||
| ATT.8 | 0.766 | 0.766 | 0.621 | 0.440 | 0.317 | 0.414 | 0.385 | 0.554 | ||||||
| ATT.9 | 0.865 | 0.865 | 0.705 | 0.516 | 0.429 | 0.371 | 0.324 | 0.594 | ||||||
| Description: ATT: Attitude; E: Egoistic; INT: Intention to re-consume; PBC: Perceived Behavioral Control; SEN_APP: Sensory Appeal Perceived; SN: Subjective norm; WG: Warm Glow. | ||||||||||||||
| Mean | Standard Deviation | Matrix Correlations | ||||||||||
| WG.1 | WG.2 | WG.3 | WG.4 | WG.5 | WG.6 | WG.7 | WG.8 | E.1 | E.2 | |||
| WG.1 | 4.228 | 0.738 | 1.000 | |||||||||
| WG.2 | 4.267 | 0.702 | 0.771 | 1.000 | ||||||||
| WG.3 | 4.270 | 0.744 | 0.774 | 0.726 | 1.000 | |||||||
| WG.4 | 4.285 | 0.740 | 0.690 | 0.693 | 0.755 | 1.000 | ||||||
| WG.5 | 4.279 | 0.778 | 0.654 | 0.685 | 0.721 | 0.852 | 1.000 | |||||
| WG.6 | 4.356 | 0.713 | 0.652 | 0.658 | 0.703 | 0.814 | 0.833 | 1.000 | ||||
| WG.7 | 4.246 | 0.764 | 0.632 | 0.652 | 0.630 | 0.716 | 0.724 | 0.700 | 1.000 | |||
| WG.8 | 4.208 | 0.792 | 0.620 | 0.621 | 0.635 | 0.704 | 0.715 | 0.705 | 0.867 | 1.000 | ||
| E.1 | 4.513 | 0.702 | 0.564 | 0.450 | 0.570 | 0.535 | 0.499 | 0.571 | 0.401 | 0.432 | 1.000 | |
| E.2 | 4.288 | 0.806 | 0.513 | 0.441 | 0.524 | 0.494 | 0.468 | 0.508 | 0.425 | 0.464 | 0.735 | 1.000 |
| E.3 | 4.365 | 0.774 | 0.529 | 0.465 | 0.535 | 0.523 | 0.516 | 0.544 | 0.435 | 0.486 | 0.730 | 0.758 |
| E.4 | 4.501 | 0.698 | 0.567 | 0.478 | 0.545 | 0.527 | 0.508 | 0.595 | 0.442 | 0.456 | 0.764 | 0.703 |
| E.5 | 3.202 | 1.211 | 0.307 | 0.289 | 0.289 | 0.283 | 0.303 | 0.226 | 0.264 | 0.318 | 0.283 | 0.302 |
| E.6 | 3.685 | 1.117 | 0.454 | 0.421 | 0.431 | 0.421 | 0.395 | 0.398 | 0.418 | 0.466 | 0.433 | 0.413 |
| E.7 | 3.644 | 1.152 | 0.448 | 0.426 | 0.382 | 0.401 | 0.392 | 0.382 | 0.420 | 0.393 | 0.321 | 0.347 |
| ATT.1 | 4.395 | 0.659 | 0.608 | 0.510 | 0.515 | 0.554 | 0.543 | 0.560 | 0.467 | 0.474 | 0.569 | 0.529 |
| ATT.2 | 4.344 | 0.693 | 0.577 | 0.512 | 0.522 | 0.555 | 0.565 | 0.538 | 0.473 | 0.507 | 0.569 | 0.566 |
| ATT.3 | 4.145 | 0.847 | 0.479 | 0.469 | 0.517 | 0.506 | 0.492 | 0.465 | 0.458 | 0.512 | 0.498 | 0.560 |
| ATT.4 | 4.193 | 0.771 | 0.522 | 0.470 | 0.499 | 0.527 | 0.514 | 0.485 | 0.468 | 0.512 | 0.502 | 0.588 |
| ATT.5 | 4.469 | 0.640 | 0.534 | 0.494 | 0.476 | 0.526 | 0.519 | 0.571 | 0.450 | 0.470 | 0.587 | 0.578 |
| ATT.6 | 4.139 | 0.834 | 0.527 | 0.469 | 0.489 | 0.464 | 0.475 | 0.450 | 0.491 | 0.482 | 0.460 | 0.439 |
| ATT.7 | 4.475 | 0.739 | 0.498 | 0.465 | 0.469 | 0.474 | 0.477 | 0.479 | 0.445 | 0.425 | 0.582 | 0.503 |
| ATT.8 | 4.329 | 0.783 | 0.471 | 0.423 | 0.479 | 0.489 | 0.512 | 0.508 | 0.450 | 0.493 | 0.556 | 0.489 |
| ATT.9 | 4.528 | 0.631 | 0.551 | 0.439 | 0.518 | 0.523 | 0.529 | 0.578 | 0.469 | 0.487 | 0.648 | 0.553 |
| ATT.10 | 4.481 | 0.654 | 0.523 | 0.470 | 0.520 | 0.600 | 0.582 | 0.588 | 0.482 | 0.500 | 0.619 | 0.548 |
| ATT.11 | 4.362 | 0.739 | 0.534 | 0.518 | 0.497 | 0.517 | 0.506 | 0.471 | 0.663 | 0.678 | 0.437 | 0.448 |
| SN.1 | 3.706 | 0.953 | 0.281 | 0.237 | 0.292 | 0.220 | 0.247 | 0.171 | 0.193 | 0.199 | 0.301 | 0.303 |
| SN.2 | 3.712 | 0.976 | 0.297 | 0.273 | 0.279 | 0.245 | 0.262 | 0.211 | 0.270 | 0.269 | 0.268 | 0.294 |
| SN.3 | 3.742 | 0.972 | 0.384 | 0.319 | 0.363 | 0.333 | 0.327 | 0.282 | 0.325 | 0.274 | 0.268 | 0.265 |
| SN.4 | 3.724 | 0.992 | 0.253 | 0.230 | 0.218 | 0.232 | 0.215 | 0.189 | 0.313 | 0.258 | 0.157 | 0.159 |
| SN.5 | 3.733 | 0.990 | 0.299 | 0.261 | 0.271 | 0.298 | 0.282 | 0.286 | 0.323 | 0.336 | 0.261 | 0.312 |
| SN.6 | 3.932 | 0.974 | 0.381 | 0.244 | 0.345 | 0.295 | 0.303 | 0.279 | 0.334 | 0.307 | 0.307 | 0.275 |
| SN.7 | 2.861 | 1.315 | 0.131 | 0.108 | 0.087 | 0.074 | 0.108 | 0.043 | 0.132 | 0.159 | 0.058 | 0.074 |
| PBC.1 | 4.318 | 0.733 | 0.310 | 0.331 | 0.327 | 0.271 | 0.298 | 0.306 | 0.274 | 0.244 | 0.289 | 0.252 |
| PBC.2 | 4.181 | 0.680 | 0.314 | 0.309 | 0.267 | 0.304 | 0.286 | 0.314 | 0.325 | 0.321 | 0.302 | 0.349 |
| PBC.3 | 4.160 | 0.713 | 0.325 | 0.336 | 0.293 | 0.330 | 0.326 | 0.273 | 0.309 | 0.293 | 0.322 | 0.431 |
| PBC.4 | 4.228 | 0.726 | 0.329 | 0.335 | 0.309 | 0.277 | 0.303 | 0.302 | 0.321 | 0.310 | 0.271 | 0.258 |
| PBC.5 | 4.240 | 0.679 | 0.323 | 0.388 | 0.312 | 0.360 | 0.322 | 0.307 | 0.321 | 0.277 | 0.270 | 0.356 |
| PBC.6 | 4.039 | 0.841 | 0.287 | 0.349 | 0.363 | 0.349 | 0.337 | 0.323 | 0.295 | 0.300 | 0.243 | 0.364 |
| PBC.7 | 4.291 | 0.657 | 0.328 | 0.334 | 0.343 | 0.367 | 0.312 | 0.343 | 0.301 | 0.266 | 0.313 | 0.324 |
| SEN_APP.1 | 4.104 | 0.761 | 0.243 | 0.265 | 0.228 | 0.248 | 0.202 | 0.183 | 0.313 | 0.274 | 0.167 | 0.203 |
| SEN_APP.2 | 4.053 | 0.745 | 0.242 | 0.251 | 0.269 | 0.263 | 0.266 | 0.249 | 0.248 | 0.258 | 0.203 | 0.212 |
| SEN_APP.3 | 4.276 | 0.688 | 0.344 | 0.302 | 0.347 | 0.370 | 0.350 | 0.326 | 0.362 | 0.331 | 0.278 | 0.253 |
| SEN_APP.4 | 4.172 | 0.689 | 0.331 | 0.353 | 0.309 | 0.375 | 0.348 | 0.340 | 0.382 | 0.331 | 0.277 | 0.279 |
| INT.1 | 4.374 | 0.594 | 0.387 | 0.423 | 0.416 | 0.399 | 0.397 | 0.365 | 0.379 | 0.333 | 0.408 | 0.432 |
| INT.2 | 4.374 | 0.604 | 0.354 | 0.416 | 0.376 | 0.399 | 0.359 | 0.359 | 0.379 | 0.315 | 0.359 | 0.388 |
| INT.3 | 4.276 | 0.670 | 0.413 | 0.436 | 0.398 | 0.410 | 0.416 | 0.366 | 0.424 | 0.384 | 0.374 | 0.457 |
| INT.4 | 4.350 | 0.603 | 0.380 | 0.438 | 0.411 | 0.421 | 0.431 | 0.393 | 0.392 | 0.357 | 0.395 | 0.366 |
| INT.5 | 4.392 | 0.597 | 0.383 | 0.409 | 0.416 | 0.405 | 0.416 | 0.404 | 0.400 | 0.342 | 0.412 | 0.400 |
| INT.6 | 4.326 | 0.658 | 0.354 | 0.357 | 0.353 | 0.442 | 0.402 | 0.359 | 0.525 | 0.496 | 0.279 | 0.337 |
| E.3 | E.4 | E.5 | E.6 | E.7 | ATT.1 | ATT.2 | ATT.3 | ATT.4 | ATT.5 | ATT.6 | ATT.7 | |
| E.3 | 1.000 | |||||||||||
| E.4 | 0.759 | 1.000 | ||||||||||
| E.5 | 0.320 | 0.221 | 1.000 | |||||||||
| E.6 | 0.452 | 0.392 | 0.703 | 1.000 | ||||||||
| E.7 | 0.362 | 0.303 | 0.660 | 0.741 | 1.000 | |||||||
| ATT.1 | 0.537 | 0.556 | 0.268 | 0.390 | 0.376 | 1.000 | ||||||
| ATT.2 | 0.578 | 0.544 | 0.320 | 0.415 | 0.425 | 0.858 | 1.000 | |||||
| ATT.3 | 0.525 | 0.449 | 0.414 | 0.475 | 0.384 | 0.625 | 0.657 | 1.000 | ||||
| ATT.4 | 0.612 | 0.504 | 0.359 | 0.432 | 0.425 | 0.650 | 0.697 | 0.656 | 1.000 | |||
| ATT.5 | 0.601 | 0.603 | 0.192 | 0.331 | 0.307 | 0.757 | 0.720 | 0.597 | 0.677 | 1.000 | ||
| ATT.6 | 0.445 | 0.446 | 0.372 | 0.429 | 0.438 | 0.591 | 0.579 | 0.534 | 0.618 | 0.567 | 1.000 | |
| ATT.7 | 0.532 | 0.557 | 0.148 | 0.289 | 0.279 | 0.572 | 0.544 | 0.421 | 0.521 | 0.602 | 0.461 | 1.000 |
| ATT.8 | 0.639 | 0.539 | 0.337 | 0.454 | 0.400 | 0.530 | 0.529 | 0.514 | 0.558 | 0.610 | 0.480 | 0.607 |
| ATT.9 | 0.650 | 0.679 | 0.191 | 0.329 | 0.271 | 0.676 | 0.650 | 0.551 | 0.602 | 0.740 | 0.531 | 0.723 |
| ATT.10 | 0.573 | 0.583 | 0.222 | 0.353 | 0.322 | 0.661 | 0.669 | 0.565 | 0.599 | 0.717 | 0.552 | 0.688 |
| ATT.11 | 0.511 | 0.454 | 0.247 | 0.422 | 0.354 | 0.578 | 0.568 | 0.542 | 0.549 | 0.589 | 0.549 | 0.566 |
| SN.1 | 0.278 | 0.226 | 0.386 | 0.298 | 0.302 | 0.227 | 0.247 | 0.299 | 0.344 | 0.197 | 0.268 | 0.244 |
| SN.2 | 0.284 | 0.199 | 0.363 | 0.292 | 0.273 | 0.269 | 0.278 | 0.366 | 0.389 | 0.216 | 0.279 | 0.247 |
| SN.3 | 0.283 | 0.239 | 0.372 | 0.371 | 0.416 | 0.326 | 0.343 | 0.388 | 0.407 | 0.285 | 0.312 | 0.315 |
| SN.4 | 0.154 | 0.088 | 0.333 | 0.307 | 0.363 | 0.212 | 0.224 | 0.366 | 0.349 | 0.176 | 0.344 | 0.211 |
| SN.5 | 0.270 | 0.228 | 0.347 | 0.370 | 0.349 | 0.284 | 0.281 | 0.390 | 0.390 | 0.287 | 0.308 | 0.279 |
| SN.6 | 0.281 | 0.260 | 0.261 | 0.305 | 0.365 | 0.319 | 0.303 | 0.350 | 0.349 | 0.332 | 0.399 | 0.305 |
| SN.7 | 0.065 | 0.021 | 0.396 | 0.330 | 0.314 | 0.101 | 0.114 | 0.242 | 0.167 | 0.032 | 0.229 | 0.044 |
| PBC.1 | 0.287 | 0.309 | 0.122 | 0.111 | 0.148 | 0.287 | 0.270 | 0.208 | 0.228 | 0.265 | 0.219 | 0.209 |
| PBC.2 | 0.365 | 0.371 | 0.161 | 0.196 | 0.219 | 0.244 | 0.233 | 0.238 | 0.329 | 0.282 | 0.280 | 0.260 |
| PBC.3 | 0.383 | 0.339 | 0.217 | 0.216 | 0.214 | 0.358 | 0.375 | 0.335 | 0.446 | 0.323 | 0.337 | 0.329 |
| PBC.4 | 0.253 | 0.283 | 0.241 | 0.220 | 0.207 | 0.277 | 0.262 | 0.255 | 0.266 | 0.255 | 0.295 | 0.224 |
| PBC.5 | 0.301 | 0.321 | 0.161 | 0.182 | 0.223 | 0.418 | 0.398 | 0.367 | 0.416 | 0.342 | 0.381 | 0.322 |
| PBC.6 | 0.325 | 0.260 | 0.287 | 0.259 | 0.256 | 0.288 | 0.359 | 0.354 | 0.409 | 0.248 | 0.293 | 0.214 |
| PBC.7 | 0.316 | 0.303 | 0.169 | 0.214 | 0.227 | 0.399 | 0.399 | 0.313 | 0.364 | 0.339 | 0.337 | 0.266 |
| SEN_APP.1 | 0.213 | 0.203 | 0.341 | 0.349 | 0.296 | 0.279 | 0.258 | 0.335 | 0.304 | 0.229 | 0.342 | 0.229 |
| SEN_APP.2 | 0.244 | 0.228 | 0.347 | 0.359 | 0.278 | 0.253 | 0.263 | 0.364 | 0.282 | 0.246 | 0.294 | 0.223 |
| SEN_APP.3 | 0.273 | 0.317 | 0.225 | 0.283 | 0.251 | 0.401 | 0.348 | 0.390 | 0.358 | 0.374 | 0.362 | 0.373 |
| SEN_APP.4 | 0.266 | 0.308 | 0.250 | 0.329 | 0.335 | 0.288 | 0.317 | 0.333 | 0.295 | 0.322 | 0.356 | 0.312 |
| INT.1 | 0.439 | 0.449 | 0.209 | 0.240 | 0.260 | 0.358 | 0.336 | 0.322 | 0.348 | 0.390 | 0.302 | 0.400 |
| INT.2 | 0.400 | 0.414 | 0.221 | 0.214 | 0.268 | 0.382 | 0.352 | 0.317 | 0.323 | 0.407 | 0.303 | 0.367 |
| INT.3 | 0.423 | 0.421 | 0.260 | 0.298 | 0.354 | 0.405 | 0.409 | 0.410 | 0.431 | 0.432 | 0.356 | 0.359 |
| INT.4 | 0.431 | 0.414 | 0.200 | 0.247 | 0.260 | 0.406 | 0.400 | 0.376 | 0.416 | 0.451 | 0.351 | 0.412 |
| INT.5 | 0.429 | 0.418 | 0.198 | 0.260 | 0.267 | 0.421 | 0.355 | 0.386 | 0.383 | 0.428 | 0.343 | 0.419 |
| INT.6 | 0.331 | 0.322 | 0.237 | 0.305 | 0.286 | 0.353 | 0.339 | 0.372 | 0.367 | 0.405 | 0.328 | 0.279 |
| ATT.8 | ATT.9 | ATT.10 | ATT.11 | SN.1 | SN.2 | SN.3 | SN.4 | SN.5 | SN.6 | SN.7 | PBC.1 | |
| ATT.8 | 1.000 | |||||||||||
| ATT.9 | 0.694 | 1.000 | ||||||||||
| ATT.10 | 0.624 | 0.802 | 1.000 | |||||||||
| ATT.11 | 0.620 | 0.641 | 0.672 | 1.000 | ||||||||
| SN.1 | 0.289 | 0.243 | 0.274 | 0.273 | 1.000 | |||||||
| SN.2 | 0.326 | 0.271 | 0.291 | 0.350 | 0.764 | 1.000 | ||||||
| SN.3 | 0.357 | 0.334 | 0.354 | 0.382 | 0.687 | 0.697 | 1.000 | |||||
| SN.4 | 0.274 | 0.200 | 0.241 | 0.311 | 0.552 | 0.568 | 0.653 | 1.000 | ||||
| SN.5 | 0.382 | 0.316 | 0.345 | 0.412 | 0.672 | 0.750 | 0.653 | 0.636 | 1.000 | |||
| SN.6 | 0.361 | 0.349 | 0.368 | 0.360 | 0.423 | 0.401 | 0.480 | 0.595 | 0.483 | 1.000 | ||
| SN.7 | 0.154 | 0.067 | 0.116 | 0.196 | 0.467 | 0.461 | 0.422 | 0.524 | 0.489 | 0.421 | 1.000 | |
| PBC.1 | 0.185 | 0.337 | 0.257 | 0.210 | 0.121 | 0.115 | 0.115 | 0.043 | 0.043 | 0.064 | -0.040 | 1.000 |
| PBC.2 | 0.256 | 0.358 | 0.271 | 0.313 | 0.293 | 0.302 | 0.214 | 0.149 | 0.319 | 0.167 | 0.018 | 0.468 |
| PBC.3 | 0.272 | 0.353 | 0.338 | 0.380 | 0.371 | 0.420 | 0.329 | 0.251 | 0.359 | 0.272 | 0.109 | 0.436 |
| PBC.4 | 0.265 | 0.307 | 0.244 | 0.333 | 0.174 | 0.181 | 0.168 | 0.174 | 0.130 | 0.127 | 0.046 | 0.650 |
| PBC.5 | 0.225 | 0.383 | 0.368 | 0.365 | 0.270 | 0.256 | 0.260 | 0.231 | 0.250 | 0.218 | 0.057 | 0.335 |
| PBC.6 | 0.242 | 0.280 | 0.306 | 0.278 | 0.310 | 0.339 | 0.277 | 0.201 | 0.269 | 0.166 | 0.077 | 0.360 |
| PBC.7 | 0.275 | 0.381 | 0.317 | 0.339 | 0.189 | 0.223 | 0.196 | 0.173 | 0.183 | 0.198 | 0.033 | 0.424 |
| SEN_APP.1 | 0.281 | 0.207 | 0.228 | 0.355 | 0.308 | 0.316 | 0.269 | 0.309 | 0.289 | 0.226 | 0.213 | 0.138 |
| SEN_APP.2 | 0.326 | 0.281 | 0.307 | 0.315 | 0.336 | 0.364 | 0.343 | 0.305 | 0.309 | 0.230 | 0.217 | 0.148 |
| SEN_APP.3 | 0.394 | 0.376 | 0.385 | 0.399 | 0.255 | 0.273 | 0.284 | 0.290 | 0.261 | 0.299 | 0.121 | 0.238 |
| SEN_APP.4 | 0.374 | 0.358 | 0.350 | 0.402 | 0.258 | 0.307 | 0.288 | 0.295 | 0.389 | 0.261 | 0.138 | 0.227 |
| INT.1 | 0.348 | 0.471 | 0.408 | 0.395 | 0.288 | 0.308 | 0.260 | 0.195 | 0.296 | 0.301 | 0.082 | 0.382 |
| INT.2 | 0.336 | 0.440 | 0.424 | 0.415 | 0.284 | 0.313 | 0.265 | 0.182 | 0.316 | 0.281 | 0.088 | 0.375 |
| INT.3 | 0.392 | 0.428 | 0.422 | 0.440 | 0.290 | 0.307 | 0.292 | 0.213 | 0.317 | 0.338 | 0.128 | 0.341 |
| INT.4 | 0.397 | 0.504 | 0.476 | 0.455 | 0.267 | 0.292 | 0.301 | 0.191 | 0.286 | 0.283 | 0.103 | 0.346 |
| INT.5 | 0.428 | 0.498 | 0.467 | 0.432 | 0.270 | 0.285 | 0.281 | 0.208 | 0.292 | 0.296 | 0.077 | 0.360 |
| INT.6 | 0.425 | 0.392 | 0.407 | 0.581 | 0.266 | 0.303 | 0.312 | 0.247 | 0.334 | 0.252 | 0.114 | 0.259 |
| PBC.2 | PBC.3 | PBC.4 | PBC.5 | PBC.6 | PBC.7 | SEN_APP.1 | SEN_APP.2 | SEN_APP.3 | SEN_APP.4 | INT.1 | INT.2 | |
| PBC.2 | 1.000 | |||||||||||
| PBC.3 | 0.723 | 1.000 | ||||||||||
| PBC.4 | 0.487 | 0.554 | 1.000 | |||||||||
| PBC.5 | 0.593 | 0.643 | 0.533 | 1.000 | ||||||||
| PBC.6 | 0.501 | 0.613 | 0.530 | 0.534 | 1.000 | |||||||
| PBC.7 | 0.573 | 0.616 | 0.545 | 0.641 | 0.602 | 1.000 | ||||||
| SEN_APP.1 | 0.233 | 0.275 | 0.236 | 0.307 | 0.267 | 0.266 | 1.000 | |||||
| SEN_APP.2 | 0.215 | 0.230 | 0.197 | 0.285 | 0.271 | 0.265 | 0.686 | 1.000 | ||||
| SEN_APP.3 | 0.293 | 0.309 | 0.320 | 0.360 | 0.289 | 0.328 | 0.586 | 0.603 | 1.000 | |||
| SEN_APP.4 | 0.326 | 0.324 | 0.307 | 0.368 | 0.337 | 0.309 | 0.532 | 0.589 | 0.658 | 1.000 | ||
| INT.1 | 0.420 | 0.461 | 0.366 | 0.424 | 0.351 | 0.406 | 0.295 | 0.324 | 0.336 | 0.401 | 1.000 | |
| INT.2 | 0.420 | 0.440 | 0.381 | 0.425 | 0.334 | 0.429 | 0.322 | 0.318 | 0.323 | 0.402 | 0.868 | 1.000 |
| INT.3 | 0.405 | 0.442 | 0.334 | 0.421 | 0.329 | 0.357 | 0.287 | 0.375 | 0.376 | 0.450 | 0.755 | 0.772 |
| INT.4 | 0.366 | 0.428 | 0.360 | 0.432 | 0.307 | 0.424 | 0.308 | 0.374 | 0.339 | 0.433 | 0.794 | 0.773 |
| INT.5 | 0.388 | 0.431 | 0.355 | 0.441 | 0.342 | 0.428 | 0.269 | 0.326 | 0.358 | 0.434 | 0.758 | 0.737 |
| INT.6 | 0.405 | 0.401 | 0.403 | 0.428 | 0.331 | 0.405 | 0.382 | 0.346 | 0.443 | 0.471 | 0.606 | 0.648 |
| INT.3 | INT.4 | INT.5 | INT.6 | |
| INT.3 | 1.000 | |||
| INT.4 | 0.766 | 1.000 | ||
| INT.5 | 0.745 | 0.821 | 1.000 | |
| INT.6 | 0.657 | 0.653 | 0.678 | 1.000 |

