We review results about the influence tumor heterogeneity has on optimal chemotherapy protocols (relative to timing, dosing and sequencing of the agents) that can be inferred from mathematical models. If a tumor consists of a homogeneous population of chemotherapeutically sensitive cells, then optimal protocols consist of upfront dosing of cytotoxic agents at maximum tolerated doses (MTD) followed by rest periods. This structure agrees with the MTD paradigm in medical practice where drug holidays limit the overall toxicity. As tumor heterogeneity becomes prevalent and sub-populations with resistant traits emerge, this structure no longer needs to be optimal. Depending on conditions relating to the growth rates of the sub-populations and whether drug resistance is intrinsic or acquired, various mathematical models point to administrations at lower than maximum dose rates as being superior. Such results are mirrored in the medical literature in the emergence of adaptive chemotherapy strategies. If conditions are unfavorable, however, it becomes difficult, if not impossible, to limit a resistant population from eventually becoming dominant. On the other hand, increased heterogeneity of tumor cell populations increases a tumor's immunogenicity and immunotherapies may provide a viable and novel alternative for such cases.
Citation: Urszula Ledzewicz, Heinz Schättler, Shuo Wang. On the role of tumor heterogeneity for optimal cancer chemotherapy[J]. Networks and Heterogeneous Media, 2019, 14(1): 131-147. doi: 10.3934/nhm.2019007
We review results about the influence tumor heterogeneity has on optimal chemotherapy protocols (relative to timing, dosing and sequencing of the agents) that can be inferred from mathematical models. If a tumor consists of a homogeneous population of chemotherapeutically sensitive cells, then optimal protocols consist of upfront dosing of cytotoxic agents at maximum tolerated doses (MTD) followed by rest periods. This structure agrees with the MTD paradigm in medical practice where drug holidays limit the overall toxicity. As tumor heterogeneity becomes prevalent and sub-populations with resistant traits emerge, this structure no longer needs to be optimal. Depending on conditions relating to the growth rates of the sub-populations and whether drug resistance is intrinsic or acquired, various mathematical models point to administrations at lower than maximum dose rates as being superior. Such results are mirrored in the medical literature in the emergence of adaptive chemotherapy strategies. If conditions are unfavorable, however, it becomes difficult, if not impossible, to limit a resistant population from eventually becoming dominant. On the other hand, increased heterogeneity of tumor cell populations increases a tumor's immunogenicity and immunotherapies may provide a viable and novel alternative for such cases.

| [1] |
MTD, NCI Dictionary of Cancer Terms, https://www.cancer.gov/publications/dictionaries/cancer-terms/def/mtd, accessed 08/18/18. |
| [2] | Metronomic scheduling of anticancer treatment: The next generation of multitarget therapy?. Future Oncology (2011) 7: 385-394. |
| [3] |
Designing proliferating cell population models with functional targets for control by anti-cancer drugs. Discr. and Cont. Dyn. Syst., Series B (2013) 18: 865-889. 
|
| [4] |
F. Billy, J. Clairambault and O. Fercoq, Optimisation of Cancer Drug Treatments Using Cell Population Dynamics, in: Mathematical Methods and Models in Biomedicine, (U. Ledzewicz, H. Schättler, A. Friedman and E. Kashdan, Eds.), Springer, New York, 2013, 265–309. |
| [5] |
Concentration phenomena in some non-local equation. J. Discrete and Continuous Dynamical Systems, Series B (2017) 22: 763-781.
|
| [6] |
B. Bonnard and M. Chyba, Singular Trajectories and their Role in Control Theory, Mathématiques & Applications, vol. 40, Springer Verlag, Paris, 2003. |
| [7] |
A. Bressan and B. Piccoli, Introduction to the Mathematical Theory of Control, American Institute of Mathematical Sciences, 2007. |
| [8] |
M. Delitalia and T. Lorenzi, Formations of evolutionary patterns in cancer dynamics, in: Pattern Formation in Morphogenesis: Problems and Mathematical Issues, (V. Capasso et al., Eds.), Springer Proceedings in Mathematics, 15 (2013), 179–190. |
| [9] |
Recognition and learning in a mathematical model for immune response against cancer. Discr. and Cont. Dyn. Syst., Series B (2013) 18: 891-914.
|
| [10] |
M. Delitalia and T. Lorenzi, Mathematical modelling of cancer under target therapeutic actions: Selection, mutation and drug resistance, in: Managing Complexity, Reducing Perplexity in Biological Systems, (M. Delitala and G. Ajmone Marsan Eds.), Springer Proceedings in Mathematics & Statistics, 2014, 81–99. |
| [11] |
Cancer immunoediting: From immunosurveillance to tumor escape. Nat. Immunol. (2002) 3: 991-998.
|
| [12] |
Cancer epigenetics: Tumor Heterogeneity, Plasticity of Stem-like States, and Drug Resistance. Molecular Cell (2014) 54: 716-727.
|
| [13] |
M. Eisen, Mathematical Models in Cell Biology and Cancer Chemotherapy, Lecture Notes in Biomathematics, Vol. 30, Springer Verlag, Berlin, 1979. |
| [14] |
A change of strategy in the war on cancer. Nature (2009) 459: 508-509.
|
| [15] |
Adaptive therapy. Cancer Research (2009) 69: 4894-4903.
|
| [16] | Drug resistance in cancer: A perspective. Cancer and Metastasis Review (2001) 20: 63-68. |
| [17] | A model for resistance of tumor cells to cancer chemotherapeutic agents. Mathematical Biosciences (1983) 65: 291-307. |
| [18] |
The penetration of anticancer drugs through tumor tissue as a function of cellular adhesion and packing density of tumor cells. Cancer Research (2006) 66: 1033-1039.
|
| [19] |
The impact of cell density and mutations in a model of multidrug resistance in solid tumors. Bull. Math. Biol. (2014) 74: 627-653.
|
| [20] |
Cell resensitization during protracted dosing of heterogeneous cell populations. Radiation Research (1998) 150: 681-687.
|
| [21] |
Minimizing long-term burden: the logic for metronomic chemotherapeutic dosing and its angiogenic basis. J. of Theoretical Biology (2003) 220: 545-554.
|
| [22] |
Less is more, regularly: Metronomic dosing of cytotoxic drugs can target tumor angiogenesis in mice. J. Clinical Investigations (2000) 105: 1045-1047.
|
| [23] | An optimal control problem related to leukemia chemotherapy. Scientific Bulletins of the Silesian Technical University (1983) 65: 120-130. |
| [24] |
The role of cell density and intratumoral heterogeneity in multidrug resistance. Cancer Research (2013) 73: 7168-7175.
|
| [25] |
Optimal bang-bang controls for a 2-compartment model in cancer chemotherapy. J. of Optimization Theory and Applications - JOTA (2002) 114: 609-637.
|
| [26] |
Analysis of a cell-cycle specific model for cancer chemotherapy. J. of Biological Systems (2002) 10: 183-206.
|
| [27] |
Drug resistance in cancer chemotherapy as an optimal control problem. Discrete and Continuous Dynamical Systems, Series B (2006) 6: 129-150.
|
| [28] |
U. Ledzewicz and H. Schättler, Tumor microenvironment and anticancer therapies: An optimal control approach, in: Mathematical Oncolgy 2013, (A. d'Onofrio and A. Gandolfi, Eds.), Birkhäuser, New York, 2013, 295–334. |
| [29] |
A $3$-compartment model for chemotherapy of heterogeneous tumor populations. Acta Applicandae Matematicae (2015) 135: 191-207.
|
| [30] |
Optimal controls for a mathematical model of tumor-immune interactions under targeted chemotherapy with immune boost. Discrete and Continuous Dynamical Systems, Series B (2013) 18: 1031-1051.
|
| [31] |
On optimal chemotherapy for heterogeneous tumors. J. of Biological Systems (2014) 22: 177-197.
|
| [32] |
A review of optimal chemotherapy protocols: From MTD towards metronomic therapy. Math. Model. Nat. Phenom. (2014) 9: 131-152.
|
| [33] |
U. Ledzewicz and H. Schättler, Optimizing chemotherapeutic anti-cancer treatment and the tumor microenvironment: an analysis of mathematical models, in: Systems Biology of Tumor Microenvironment, Advances in Experimental Medicine and Biology Vol. 936, (K.A. Rejniak (ed.)), 2016, 209–223. |
| [34] |
Population adaptive evolution, chemotherapeutic resistance and multiple anti-cancer therapies. ESAIM: Mathematical Modelling and Numerical Analysis (2013) 47: 377-399.
|
| [35] |
Effects of space structure and combination therapies on phenotypic heterogeneity and drug resistance in solid tumors. Bull. Math. Biol. (2015) 77: 1-22.
|
| [36] | Tumor size, sensitivity to therapy, and design of treatment schedules. Cancer Treatment Reports (1977) 61: 1307-1317. |
| [37] | The Norton-Simon hypothesis revisited. Cancer Treatment Reports (1986) 70: 41-61. |
| [38] |
B. Perthame, Transport Equations in Biology, Birkhäuser, Basel, Switzerland, 2007. |
| [39] | A multi-targeted, metronomic and maximum tolerated dose "chemo-switch" regimen is antiangiogenic, producing objective responses and survival benefit in a mouse model of cancer. J. of Clinical Oncology (2005) 23: 939-952. |
| [40] |
L. S. Pontryagin, V. G. Boltyanskii, R. V. Gamkrelidze and E. F. Mishchenko, The Mathematical Theory of Optimal Processes, Macmillan, New York, 1964. |
| [41] |
C. Pouchol, J. Clairambault, A. Lorz and E. Trélat, Asymptotic analysis and optimal control of integro-differential system modelling healtyh and ccells exposed to chemotherapy, J. de Mathématiques Pures et Appliquées, 2017; arXiv: 1612.04698 [math.OC] |
| [42] |
E. Ramos, C. Nespoli and P. Ramos, Feedback optimal control for mathematical models for cancer treatment, Preprint, 2018. |
| [43] |
H. Schättler and U. Ledzewicz, Geometric Optimal Control, Interdisciplinary Applied Mathematics, vol. 38, Springer, 2012. |
| [44] |
H. Schättler and U. Ledzewicz, Optimal Control for Mathematical Models of Cancer Therapies, Interdisciplinary Applied Mathematics, vol. 42, Springer, 2015. |
| [45] |
Cancer immunoediting: Integrating immunity's roles in cancer suppression and promotion. Science (2011) 331: 1565-1570.
|
| [46] |
S. V. Sharma et al., A chromatin-mediated reversible drug-tolerant state in cancer cell subpopulations, Cell, 141 (2010), 69–80. |
| [47] |
On mathematical modeling of critical variables in cancer treatment (goals: better understanding of the past and better planning in the future). Bulletin of Mathematical Biology (1986) 48: 253-278.
|
| [48] | Course of the immune reaction during the development of a malignant tumour. Biophysics (1980) 24: 917-923. |
| [49] |
G. W. Swan, Applications of Optimal Control Theory in Medicine, Marcel Dekker, New York, 1984. |
| [50] |
General applications of optimal control theory in cancer chemotherapy. IMA J. of Mathematical Applications in Medicine and Biology (1988) 5: 303-316.
|
| [51] |
A. Swierniak, Optimal treatment protocols in leukemia - modelling the proliferation cycle, Biomedical Systems Modelling and Simulation (Paris, 1988), 51–53, IMACS Ann. Comput. Appl. Math., 5, IMACS Trans. Sci. Comput. '88, Baltzer, Basel, 1989. |
| [52] | Cell cycle as an object of control. Journal of Biological Systems (1995) 3: 41-54. |
| [53] | Optimal control for a class of compartmental models in cancer chemotherapy. Int. J. Applied Mathematics and Computer Science (2003) 13: 357-368. |
| [54] | Optimal control problems arising in cell-cycle-specific cancer chemotherapy. Cell proliferation (1996) 29: 117-139. |
| [55] | Qualitative analysis of controlled drug resistance model - inverse Laplace and semigroup approach. Control and Cybernetics (1999) 28: 61-75. |
| [56] |
Cancer chemotherapy optimization under evolving drug resistance. Nonlinear Analysis (2000) 47: 375-386.
|
| [57] |
G. Tonini, M. Imperatori, B. Vincenci, A. M. Frezza and D. Santini, Rechallenge therapy and treatment holiday: Different strategies in management of metastatic colorectal cancer, J. Experimental Clinical Cancer Research, 32 (2013), p92. |
| [58] |
Optimal control of a mathematical model for cancer chemotherapy under tumor heterogeneity. Mathematical Biosciences and Engineering - MBE (2016) 13: 1223-1240.
|
| [59] |
S. Wang and H. Schättler, Optimal control for cancer chemotherapy under tumor heterogeneity, Discrete and Continuous Dynamical Systems, Series B, 48 (2018). |
| [60] |
Back to the basics: the importance of concentration $\times$ time in oncology. J. of Clinical Oncology (1993) 11: 820-821.
|


Figures(5)
Urszula Ledzewicz, Heinz Schättler, Shuo Wang. On the role of tumor heterogeneity for optimal cancer chemotherapy[J]. Networks and Heterogeneous Media, 2019, 14(1): 131-147. doi: 10.3934/nhm.2019007

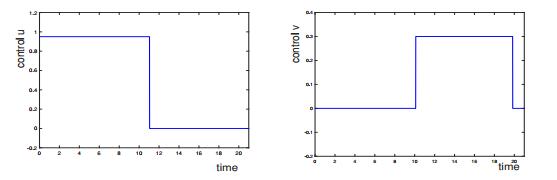
Example of locally optimal controls for a
Example of an extremal control and associated states for a bang-singular controlled trajectory
Extremal controls (top), evolution of the total tumor
Example of the phase portraits for the system (19)-(20) with a Gompertzian growth function
Example of numerically computed optimal controls for the system (19)-(20) with a Gompertzian growth function


 DownLoad: