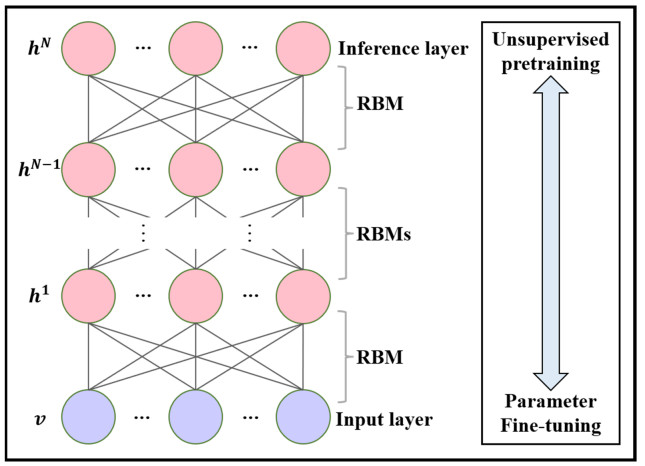
A dose-effect relationship analysis of traditional Chinese Medicine (TCM) is crucial to the modernization of TCM. However, due to the complex and nonlinear nature of TCM data, such as multicollinearity, it can be challenging to conduct a dose-effect relationship analysis. Partial least squares can be applied to multicollinearity data, but its internally extracted principal components cannot adequately express the nonlinear characteristics of TCM data. To address this issue, this paper proposes an analytical model based on a deep Boltzmann machine (DBM) and partial least squares. The model uses the DBM to extract nonlinear features from the feature space, replaces the components in partial least squares, and performs a multiple linear regression. Ultimately, this model is suitable for analyzing the dose-effect relationship of TCM. The model was evaluated using experimental data from Ma Xing Shi Gan Decoction and datasets from the UCI Machine Learning Repository. The experimental results demonstrate that the prediction accuracy of the model based on the DBM and partial least squares method is on average 10% higher than that of existing methods.
Citation: Wangping Xiong, Yimin Zhu, Qingxia Zeng, Jianqiang Du, Kaiqi Wang, Jigen Luo, Ming Yang, Xian Zhou. Dose-effect relationship analysis of TCM based on deep Boltzmann machine and partial least squares[J]. Mathematical Biosciences and Engineering, 2023, 20(8): 14395-14413. doi: 10.3934/mbe.2023644
A dose-effect relationship analysis of traditional Chinese Medicine (TCM) is crucial to the modernization of TCM. However, due to the complex and nonlinear nature of TCM data, such as multicollinearity, it can be challenging to conduct a dose-effect relationship analysis. Partial least squares can be applied to multicollinearity data, but its internally extracted principal components cannot adequately express the nonlinear characteristics of TCM data. To address this issue, this paper proposes an analytical model based on a deep Boltzmann machine (DBM) and partial least squares. The model uses the DBM to extract nonlinear features from the feature space, replaces the components in partial least squares, and performs a multiple linear regression. Ultimately, this model is suitable for analyzing the dose-effect relationship of TCM. The model was evaluated using experimental data from Ma Xing Shi Gan Decoction and datasets from the UCI Machine Learning Repository. The experimental results demonstrate that the prediction accuracy of the model based on the DBM and partial least squares method is on average 10% higher than that of existing methods.

| [1] | D. B. Singh, R. K. Pathak, D. Rai, From traditional herbal medicine to rational drug discovery: strategies, challenges, and future perspectives, Rev. Bras. Farmacogn., 32 (2022), 147–159. https://doi.org/10.1007/s43450-022-00235-z |
| [2] |
J. Yang, Y. Li, Q. Liu, L. Li, A. Feng, T. Wang, et al., Brief introduction of medical database and data mining technology in big data era, J. Evidence-Based Med., 13 (2020), 57–69. https://doi.org/10.1111/jebm.12373 doi: 10.1111/jebm.12373

|
| [3] |
D. Ma, S. Wang, Y. Shi, S. Ni, M. Tang, A. Xu, The development of traditional Chinese medicine, J. Tradit. Chin. Med. Sci., 8 (2021), 1–9. https://doi.org/10.1016/j.jtcms.2021.11.002 doi: 10.1016/j.jtcms.2021.11.002
|
| [4] |
J. Sun, X. Meng, Application of big data technology in extracting information analysis of traditional Chinese medicine, J. Phys.: Conf. Ser., 1881 (2021), 042050. https://doi.org/10.1088/1742-6596/1881/4/042050 doi: 10.1088/1742-6596/1881/4/042050
|
| [5] |
X. Chu, B. Sun, Q. Huang, S. Peng, Y. Zhou, Y. Zhang, Quantitative knowledge presentation models of traditional Chinese medicine (TCM): A review, Artif. Intell. Med., 103 (2020), 101810. https://doi.org/10.1016/j.artmed.2020.101810 doi: 10.1016/j.artmed.2020.101810
|
| [6] |
H. Jiang, Y. Zhang, Z. Liu, X. Wang, J. He, H. Jin, Advanced applications of mass spectrometry imaging technology in quality control and safety assessments of traditional Chinese medicines, J. Ethnopharmacol., 284 (2022), 114760. https://doi.org/10.1016/j.jep.2021.114760 doi: 10.1016/j.jep.2021.114760
|
| [7] |
L. Gan, X. Yin, J. Huang, B. Jia, Transcranial Doppler analysis based on computer and artificial intelligence for acute cerebrovascular disease, Math. Biosci. Eng., 20 (2023), 1695–1715. https://doi.org/10.3934/mbe.2023077 doi: 10.3934/mbe.2023077
|
| [8] |
X. Wang, X. Zhang, J. Li, B. Hu, J. Zhang, W. Zhang, et al., Analysis of prescription medication rules of traditional Chinese medicine for bradyarrhythmia treatment based on data mining, Medicine, 101 (2022), 31436. https://doi.org/10.1097/md.0000000000031436 doi: 10.1097/md.0000000000031436
|
| [9] | Y. Yang, Y. Huang, L. Yang, H. Liu, Design of TCM research demand system based on data mining technology, in 2023 IEEE International Conference on Integrated Circuits and Communication Systems (ICICACS), (2023), 1–5. https://doi.org/10.1109/ICICACS57338.2023.10099881 |
| [10] |
J. Chen, J. Xu, P. Huang, Y. Luo, Y. Shi, P. Ma, The potential applications of traditional Chinese medicine in Parkinson's disease: A new opportunity, Biomed. Pharmacother., 149 (2022), 112866. https://doi.org/10.1016/j.biopha.2022.112866 doi: 10.1016/j.biopha.2022.112866
|
| [11] |
Y. Liu, T. Geng, Z. Wan, Q. Lu, X. Zhang, Z. Qiu, et al., Associations of serum folate and vitamin B12 levels with cardiovascular disease mortality among patients with type 2 diabetes, JAMA Netw. Open, 5 (2022), 2146124. https://doi.org/10.1001/jamanetworkopen.2021.46124 doi: 10.1001/jamanetworkopen.2021.46124
|
| [12] |
Y. Liu, B. Li, Y. Su, R. Zhao, P. Song, H. Li, et al., Potential activity of Traditional Chinese Medicine against Ulcerative colitis: A review, J. Ethnopharmacol., 289 (2022), 115084. https://doi.org/10.1016/j.jep.2022.115084 doi: 10.1016/j.jep.2022.115084
|
| [13] | M. E. McNamara, M. Zisser, C. G. Beevers, J. Shumake, Not just "big" data: Importance of sample size, measurement error, and uninformative predictors for developing prognostic models for digital interventions, Behav. Res. Ther., 153 (2022), 104086. https://doi.org/10.1016/j.brat.2022.104086 |
| [14] | H. Abdi, Lynne. J. Williams, Partial least squares methods: Partial least squares correlation and partial least square regression, Comput. Toxicol., 930 (2012). https://doi.org/10.1007/978-1-62703-059-5_23 |
| [15] |
F. Schuberth, M. E. Rademaker, J. Henseler, Assessing the overall fit of composite models estimated by partial least squares path modeling, Eur. J. Mark., 57 (2022), 1678–1702. https://doi.org/10.1108/EJM-08-2020-0586 doi: 10.1108/EJM-08-2020-0586
|
| [16] | Z. Shang, Y. Dong, M. Li, Z. Li, Robust feature selection and classification algorithm based on partial least squares regression, J. Comput. Appl., 37 (2017), 871–875. |
| [17] | J. Qin, X. Yu, P. Zhang, M. Yang, An optimal band selection method for hyperspectral imagery based on kernel partial least squares, J. Geomatics Sci. Technol., 30 (2013), 172–176. |
| [18] | L. Zhou, Research on Feature Extraction Method Based on Monlinear Partial Least Squares, Master's thesis, Nanjing University of Science and Technology in Nanjing, 2011. |
| [19] | Z. Zhu, J. Du, R. Yu, B. Nie, Partial least squares optimization method integrating restricted Boltzmann machine, Comput. Eng., 43 (2017), 193–197. |
| [20] |
W. Xiong, T. Li, Q. Zeng, J. Du, B. Nie, C. Chen, et al., Research on partial least squares method based on deep confidence network in traditional Chinese medicine, Discrete Dyn. Nat. Soc., 2020 (2020), 4142824. https://doi.org/10.1155/2020/4142824 doi: 10.1155/2020/4142824
|
| [21] |
W. Dai, K. Feng, X. Sun, L. Xu, S. Wu, K. Rahmand, et al., Natural products for the treatment of stress-induced depression: Pharmacology, mechanism and traditional use, J. Ethnopharmacol., 285 (2022), 114692. https://doi.org/10.1016/j.jep.2021.114692 doi: 10.1016/j.jep.2021.114692
|
| [22] |
Y. Fei, H. Cao, R. Xia, Q. Chai, C. Liang, Y. Feng, et al., Methodological challenges in design and conduct of randomised controlled trials in acupuncture, BMJ, 376 (2022), 064345. https://doi.org/10.1136/bmj-2021-064345 doi: 10.1136/bmj-2021-064345
|
| [23] |
J. Yan, C. Peng, P. Chen, W. Zhang, C. Jiang, S. Sang, et al., In-vitro anti-Helicobacter pylori activity and preliminary mechanism of action of Canarium album Raeusch. fruit extracts, J. Ethnopharmacol., 283 (2022), 114578. https://doi.org/10.1016/j.jep.2021.114578 doi: 10.1016/j.jep.2021.114578
|
| [24] |
Z. Xie, X. Feng, X. Chen, Partial least trimmed squares regression, Chemom. Intell. Lab. Syst., 221 (2022), 104486. https://doi.org/10.1016/j.chemolab.2021.104486 doi: 10.1016/j.chemolab.2021.104486
|
| [25] | Q. Zeng, Research and Application of improved PLS in Traditional Chinese Medicine Data, Master's thesis, Jiangxi University of Chinese Medicine in Nanchang, 2019. https://doi.org/10.27180/d.cnki.gjxzc.2019.000050 |
| [26] | T. Li, Study on Partial Least Squares Variable Screening Method for Chinese Dosage Effectiveness Data, Master's thesis, Jiangxi University of Chinese Medicine in Nanchang, 2021. https://doi.org/10.27180/d.cnki.gjxzc.2021.000470 |
| [27] |
Y. Ichikawa, K. Hukushima, Statistical-mechanical study of deep boltzmann machine given weight parameters after training by singular value decomposition, J. Phys. Soc. Jpn., 91 (2022), 114001. https://doi.org/10.7566/JPSJ.91.114001 doi: 10.7566/JPSJ.91.114001
|
| [28] | N. Srivastava, R. R Salakhutdinov, G. E. Hinton, Modeling documents with deep boltzmann machines, preprint, arXiv: 13096865. |
| [29] | F. Taheri, K. Rahbar, P. Salimi, Effective features in content-based image retrieval from a combination of low-level features and deep Boltzmann machine, Multimed. Tools Appl., (2022). https://doi.org/10.1007/s11042-022-13670-w |
| [30] |
Y. Wang, F. Xu, J. Wang, X. Cui, T. Yi, Reconfigurable stochastic neurons for restricted boltzmann machine, J. Phys.: Conf. Ser., 2347 (2022), 012014. https://doi.org/10.1088/1742-6596/2347/1/012014 doi: 10.1088/1742-6596/2347/1/012014
|
| [31] |
N Zhang, S. Ding, J. Zhang, Y. Xue, An overview on Restricted Boltzmann Machines, Neurocomputing, 275 (2018), 1186–1199. https://doi.org/10.1016/j.neucom.2017.09.065 doi: 10.1016/j.neucom.2017.09.065
|
| [32] |
V. Duraisamy, A. Devi, S. Aggarwal, Multi disease prediction based on combined deep reinforcement Boltzmann machines, AIP Conf. Proc., 2555 (2022), 020003. https://doi.org/10.1063/5.0108952 doi: 10.1063/5.0108952
|
| [33] | P. Rana, Physicochemical Properties of Protein Tertiary Structure, 2013. Available from: https://archive.ics.uci.edu/ml/datasets/Physicochemical+Properties+of+Protein+Tertiary+Structure |
| [34] | A. Tsanas, M. Little, P. McSharry, L. Ramig, Accurate telemonitoring of Parkinson's disease progression by non-invasive speech tests, Nat. Prec., (2009). https://doi.org/10.1038/npre.2009.3920.1 |
| [35] |
H. Anysz, A. Zbiciak, N. Ibadov, The influence of input data standardization method on prediction accuracy of artificial neural networks, Procedia Eng., 153 (2016), 66–70. https://doi.org/10.1016/j.proeng.2016.08.081 doi: 10.1016/j.proeng.2016.08.081
|
| [36] |
M. Shanker, M. Y. Hu, M. S. Hung, Effect of data standardization on neural network training, Omega, 24 (1996), 385–397. https://doi.org/10.1016/0305-0483(96)00010-2 doi: 10.1016/0305-0483(96)00010-2
|


Figures(4) / Tables(6)

Wangping Xiong, Yimin Zhu, Qingxia Zeng, Jianqiang Du, Kaiqi Wang, Jigen Luo, Ming Yang, Xian Zhou. Dose-effect relationship analysis of TCM based on deep Boltzmann machine and partial least squares[J]. Mathematical Biosciences and Engineering, 2023, 20(8): 14395-14413. doi: 10.3934/mbe.2023644


 DownLoad: