GI-MOSM, Grupo de Investigação em Modelação e Optimização de Sistemas Multifuncionais, ISEL, IPL - Instituto Superior de Engenharia de Lisboa, Portugal
2.
LAETA, IDMEC - Instituto Superior Técnico - Universidade de Lisboa, Portugal
Received:
19 May 2016
Accepted:
03 July 2016
Published:
05 July 2016
Functionally graded materials are commonly particulate composites characterized by a varying spatial distribution of the inclusion particles. Because of this, these materials possess a great suitability potential concerning to material properties, which can be very useful to achieve specified structural behaviors. Significant features of these materials are related to their thermal barrier properties especially when ceramic materials are involved, and to the mitigation of abrupt stresses transitions, typically found in laminates. From the manufacturing point of view as well as from the computational perspective, these materials can be thought as effectively having a continuous variation of their constituent phases and consequently their properties, or by resulting from the stacking of a specified number of layers, each having constant properties. This work presents a set of parametric studies aiming to characterize the static response of hybrid functionally graded plates, concerning to their transverse displacement profile and stresses distributions. To this purpose, one considers parameters such as different ceramic materials, plates’ aspect ratio, continuous or discrete variation of phase’s mixture through thickness, the carbon nanotubes (CNT) weight fraction contents and the type of nanotubes. The results obtained are discussed and conclusions are drawn.
Citation: D. M. S. Costa, M. A. R. Loja. Assessing the static behavior of hybrid CNT-metal-ceramic composite plates[J]. AIMS Materials Science, 2016, 3(3): 808-831. doi: 10.3934/matersci.2016.3.808
Related Papers:
[1]
M.A.R. Loja, André Carvalho, Ines C.J. Barbosa .
A study on the static behavior of functionally graded I-shaped beams. AIMS Materials Science, 2024, 11(1): 28-57.
doi: 10.3934/matersci.2024002
[2]
Reginald Umunakwe, Ifeoma Janefrances Umunakwe, Uzoma Samuel Nwigwe, Wilson Uzochukwu Eze, Akinlabi Oyetunji .
Review on properties of hybrid aluminum–ceramics/fly ash composites. AIMS Materials Science, 2020, 7(6): 859-870.
doi: 10.3934/matersci.2020.6.859
[3]
Carlos A. Sánchez, Yamile Cardona-Maya, Andrés D. Morales, Juan S. Rudas, Cesar A. Isaza .
Development and evaluation of polyvinyl alcohol films reinforced with carbon nanotubes and alumina for manufacturing hybrid metal matrix composites by the sandwich technique. AIMS Materials Science, 2021, 8(2): 149-165.
doi: 10.3934/matersci.2021011
[4]
Ruaa Al-Mezrakchi, Ahmed Al-Ramthan, Shah Alam .
Designing and modeling new generation of advanced hybrid composite sandwich structure armors for ballistic threats in defense applications. AIMS Materials Science, 2020, 7(5): 608-631.
doi: 10.3934/matersci.2020.5.608
[5]
Tim Slawik, Anne Günther, Tassilo Moritz, Alexander Michaelis .
Co-Sintering behaviour of zirconia-ferritic steel composites. AIMS Materials Science, 2016, 3(3): 1160-1176.
doi: 10.3934/matersci.2016.3.1160
[6]
Mateo Duarte, Andrés Benítez, Katiuska Gómez, Benjamín Zuluaga D, Juan Meza, Yamile Cardona-Maya, Juan S. Rudas, César Isaza .
Nanomechanical characterization of a metal matrix composite reinforced with carbon nanotubes. AIMS Materials Science, 2020, 7(1): 33-45.
doi: 10.3934/matersci.2020.1.33
[7]
Adel M Bash, Sulaiman E. Mnawe, Salim A. Salah .
Numerical buckling analysis of carbon fibre-epoxy composite plates with different cutouts number by finite element method. AIMS Materials Science, 2020, 7(1): 46-59.
doi: 10.3934/matersci.2020.1.46
[8]
Robiul Islam Rubel, Md. Hasan Ali, Md. Abu Jafor, Md. Mahmodul Alam .
Carbon nanotubes agglomeration in reinforced composites: A review. AIMS Materials Science, 2019, 6(5): 756-780.
doi: 10.3934/matersci.2019.5.756
[9]
Mohammad Na'aim Abd Rahim, Mohd Shukor Salleh, Saifudin Hafiz Yahaya, Sivarao Subramonian, Azrin Hani Abdul Rashid, Syarifah Nur Aqida Syed Ahmad, Salah Salman Al-Zubaidi .
Microstructural investigation and mechanical properties of Al2O3-MWCNTs reinforced aluminium composite. AIMS Materials Science, 2025, 12(2): 318-335.
doi: 10.3934/matersci.2025017
[10]
Peter Rusinov, Zhesfina Blednova, Anastasia Rusinova, George Kurapov, Maxim Semadeni .
Study of the structure and mechanical properties of composites used in the oil and gas industry. AIMS Materials Science, 2023, 10(4): 589-603.
doi: 10.3934/matersci.2023033
Abstract
Functionally graded materials are commonly particulate composites characterized by a varying spatial distribution of the inclusion particles. Because of this, these materials possess a great suitability potential concerning to material properties, which can be very useful to achieve specified structural behaviors. Significant features of these materials are related to their thermal barrier properties especially when ceramic materials are involved, and to the mitigation of abrupt stresses transitions, typically found in laminates. From the manufacturing point of view as well as from the computational perspective, these materials can be thought as effectively having a continuous variation of their constituent phases and consequently their properties, or by resulting from the stacking of a specified number of layers, each having constant properties. This work presents a set of parametric studies aiming to characterize the static response of hybrid functionally graded plates, concerning to their transverse displacement profile and stresses distributions. To this purpose, one considers parameters such as different ceramic materials, plates’ aspect ratio, continuous or discrete variation of phase’s mixture through thickness, the carbon nanotubes (CNT) weight fraction contents and the type of nanotubes. The results obtained are discussed and conclusions are drawn.
1. Introduction
The advantages of composite materials are well known in many technological and scientific domains. We may say that the great research attention, these materials have deserved from the scientific community, have contributed to an effective dissemination and use in many real situations that range from the aerospace and automotive industries to the ones devoted to sports and biomedical applications. The goal of achieving structures with enhanced performances is being partially fulfilled through the use of composites with improved materials characteristics, which have been conceived through the optimal design of the materials at microscale level, and by tailoring different constituent phases at different scale levels. In recent years several contributions were published considering the addition of carbon nanotubes to polymeric and ceramic matrices. To illustrate this, we can refer among others, works orientated to characterize material properties of composites with these types of matrices [1,2,3]. Comparatively, a minor visibility was given to the metal matrix composites [4,5,6]. The use of ceramic materials as reinforcement particles and as agents of a thermal performance improvement is a more common solution in the context of particle composites. These solutions may assume that the weight or volume fraction remains constant in the whole composite or admit that they may vary in the 3D domain of the composite structural element. Functionally graded materials are typical examples of this last case, where the mixture composition of the constituent phases depends on the space coordinates of the composite [7,8]. The structural analysis of components or systems made of these materials was carried out by several researchers mainly considering polymeric or ceramic matrices with ceramic reinforcement particles [9,10,11,12,13,14,15]. To note that these works focusedfrom the mechanical to thermal analysis of beams, plates and shell structures, using a diverse range of numerical approaches. More recently, the possibility of using nanoparticles to enhance material characteristics, has deserved the attention of many researchers, and it has been possible to find a number of review studies in the nanocomposites field, focusing processing techniques, nanotube dispersion, interface, strengthening mechanisms and mechanical properties, and on its use as a reinforcement agent in composites [16,17,18,19,20,21,22,23,24,25,26,27]. Concerning to the analysis of structures made of materials that somehow include nanocomposites [28,29], and particularly in the case of functionally graded materials that incorporate nanoparticles [30,31,32] we can perceive a research field that is currently in expansion. It is however understood that further research will be needed for a more comprehensive understanding of the response of these structures from nano to macroscale, as well as in what concerns to the multiscale interaction. In the present work, the authors proceed to the characterization of the static response of moderately thick plates made of dual-phase functionally graded materials, where the continuous phase is metallic and the discontinuous one are ceramic particles. Additionally these metal-ceramic graded composites may be enriched with carbon nanotubes. Parametric studies are developed, to characterize the influence of some parameters on the transverse displacements of the plates as well as the inherent states of stress. For each case study, a set of results is presented either in tabular or graphical form.
2. Materials and Method
2.1. Functionally graded metal-ceramic composites
Functionally graded materials are known to possess the advantageous ability of minimizing abrupt stresses transitions, due to the continuous mixture variation of its constituent phases. This is achieved by gradually varying the volume fraction of the constituent phases along the selected composite plate dimensions (thickness, width or depth). This volume fraction is more commonly referred to the volume percentage of reinforcement particles dispersed in a continuous phase, the matrix. In the present work, we consider FGM’s which matrix is metallic and the particles are from different ceramic materials. The spatial variation of this volume fraction is assumed to occur in the thickness direction according to the expression:
Vf=(12+zh)p
(1)
where h and z stands respectively for the whole thickness and the thickness coordinate which has its origin at the middle surface of the graded composite. The exponent p permits to adjust the way, the ceramic volume fraction will vary through the thickness, as can be observed on Figure 1.
Figure 1. Volume fraction distribution through FGM thickness
In accordance with this evolution, the material properties of the resulting composite will vary in a continuous form. The determination of these properties may be carried out by using different homogenization schemes [9,11], which aim to obtain average, macroscopic values, which one can use on daily structural analysis. In the cases presented in this work, two approaches were used: one based on Voigt rule of mixtures and the other based on Mori-Tanaka homogenization scheme. In the case of the Voigt rule, the effective material properties of the graded material are only based on the volume fraction of the different phases, as we can observe in equation 2 for a dual-phase composite (neglecting voids):
Peff=PmVfm+PcVfcwithVfm+Vfc=1
(2)
with P meaning a generic material property, for instance the Young’s modulus, Poisson’s ratio or the density. The subscripts m, c identify the metallic and ceramic phases and eff stands for the resulting material effective property. In Mori-Tanaka approach, a micromechanics’ based model, the interaction of the elastic fields among neighboring inclusions is considered, and the elastic properties are estimated by solving the following equations:
The prediction of the average elastic properties of the functionally graded material is then obtained using one of these approaches. To note that the metallic phase here mentioned, may be instead, a nanocomposite resulting from the dispersion of carbon nanotubes in the metal, as we have considered in this work. Thus, if we consider the inclusion of carbon nanotubes, then we will have to estimate first the properties of this nanocomposite, which is done using the Halpin-Tsai equations [33] as shown in next sub-section. It is globally a hierarchical process.
2.2. Hybrid CNT-metal-ceramic composite
The structural performance of these functionally graded plates may be improved by considering a multiscale hierarchical composite which can be achieved by hybridizing the mentioned continuous phase, the matrix, through the dispersion of carbon-nanotubes. In such conditions, and considering the present work, the overall homogenization process can be split into two phases: one wherein the dispersed CNT in the metallic matrix phase yields a nanocomposite with its own material characteristics, and a second one where this nanocomposite will receive ceramic inclusions in a graded manner, and finally achieving the graded CNT-metal-ceramic multiscale composite.
To estimate the effective material properties of this nanoparticle composite, one have used Halpin-Tsai equations 5-7 [33]. Assuming a perfect CNT dispersion within the matrix, the nanocomposite can be considered to be an isotropic material, which enables to write for the Young’s modulus:
with ECN, VCN, lCN, dCN, and tCN, standing for the Young’s modulus, volume fraction, length, outer diameter, and thickness of the carbon nanotubes, respectively. Em denotes the metallic matrix Young’s modulus. The volume fraction of the carbon nanotubes can be expressed as [28]:
VCN=wCNwCN+(ρCNρm)−(ρCNρm)wCN
(7)
where wCN, ρCN, and ρm denote the CNT weight fraction and density, and the metallic matrix density respectively. The Poisson’s ratio of the nanocomposite is calculated by using the Voigt rule of mixtures:
νmCN=νCN.VCN+νm.(1−VCN)
(8)
Considering a determined nanotube’ weight fraction, it is then possible to obtain the corresponding volume fraction through eq. 7. Using then the estimation expression given in eq. 5, where characteristic nanotube’s material and geometrical parameters βdl and βdd, are explicitly given in eq. 6, we are finally able to obtain the Young’s modulus prediction for the nanocomposite.
This prediction is supported by the assumption that a good dispersion of the carbon nanotubes is guaranteed. The effectiveness of the dispersion is a very important issue and it has been studied by many researchers. Among others, we can refer [16,22,32]. From the studies carried out upon this topic, it can be said that a good dispersion of the carbon nanotubes is indispensable for the improvement of the mechanical response of a composite material. However this dispersion is difficult to obtain because, due to Van der Waals forces among the nano-inclusions and the surrounding matrix, the carbon nanotubes tend to agglomerate and form bundles or ropes. These agglomerates possess lower aspect ratios and these contribute to a more limited capacity to carry and transfer the loads. According to the experiments carried out by [23] and [24] using SWCNTs, as the bundles grow in diameter, this aspect ratio diminishes and the axial and shear moduli decrease drastically, suggesting that individual CNTs are slipping within the bundle and decreasing the load required to deform the bundle. Nevertheless, depending on the application, these bundles may have advantages. As result of other studies [34], it was concluded that the sliding mechanism within bundles may provide high mechanical damping. Generally speaking, it is important to break these agglomerates into individual CNTs in order to take full advantage of their reinforcement effect. From the literature review, we can conclude that an intense effort has been developed in order to modify the surface properties of the carbon nanotubes, to minimize this agglomeration trend, focusing on chemical functionalization and on physical methods. Comprehensive reviews on the methods used to this purpose, are given in [35, 36, 37]. Because of these aspects, and not to compromise the assumption of a perfect dispersion of the CNTs in the matrix, which underlies the isotropic assumption for the nanocomposites used in this study, one has then considered low values of CNT weight fraction/volume fraction [28].
2.3. Finite element modeling
Considering the characteristics of the plate structures focused in the numerical studies to carry out, one has decided to use the first order shear deformation theory (FSDT) [38], which is adequate for the analysis of moderately thick to thin plates. For this theory, the displacements of an arbitrary point in a plate are given as:
where u0, v0 represent the in-plane mid-plane membrane displacements and w0 is the transverse out-of-plane displacement of the mid-plane. θ0x and θ0y stand respectively for the rotations about the y
and x axes. The strain field (omitting dependencies, for simplicity) is obtained by applying the Elasticity kinematical relations for small deformations, being written as:
The first three strains are the in-plane normal and shear ones and the last two, are the interlaminar transverse shear strains. The thickness inextensibility, characteristic of this theory, is expressed by εz=0.
Considering that the hybrid CNT-metal-ceramic composite, can be considered as an isotropic material, at each point of its domain, the constitutive relationship that relates the states of strain and stress, can be written as:
where the expressions for the elastic coefficients Qij are given in the literature [38] for isotropic homogeneous materials. In this work, they may vary spatially, namely with the thickness coordinate, so they are a function of this direction coordinate.
The finite element linear static analyses were carried out by using the usual equilibrium equation after the imposition of the adequate set of boundary conditions:
Kq=F
(12)
with K and q being respectively the global stiffness matrix and the generalized nodal displacements vector. The applied generalized forces is represented by the vector F. The implementation of the models developed, considered the coding of two quadrilateral finite element plate models, a bi-linear (Q4) and a bi-quadratic (Q9), both from Lagrange family. Concerning to other implementation issues, it is worth to mention that a selective integration scheme was used to minimize shear locking effects, and a shear correction factor (k) characteristic of FSDT was also considered, and set to 5/6.
3. Results and Discussion
3.1. Validation study
To enable the validation of the finite element models implemented, one has considered a first study where one compares the present models results with other authors’ alternative solutions. This comparison is carried out for the maximum transverse displacement of a plate, and for normal in-plane stresses in its outer surfaces. To this purpose, a functionally graded square plate with a unit edge length and an aspect ratio a/h = 20, is assumed to be simply supported and submitted to a uniform transverse pressure, applied in its whole top surface. The material properties of the phases are summarized in Table 1.
The plate was discretized in 18 elements in both in-plane directions and the effective Young’s modulus was estimated using both Voigt and Mori-Tanaka method. The maximum transverse displacements obtained for different values of exponent of the volume fraction distribution power law, and for different homogenization schemes, are presented in Tables 2 and 3, in a non-dimensional form, using ˉw=w/h The external load applied to this first case, equals pz=Em.h4 Pa in order to correspond to a unit parameter load.
Table 2.Non-dimensional maximum deflection ˉw . Mesh Q4
A thicker plate, with an aspect ratio a/h = 5 and submitted to a uniformly distributed force pz=Em.h4 Pa was then considered for the in-plane normal stresses σx, comparison purposes. These stresses, obtained at the lower and upper surface centroid are presented in a non-dimensional form, in Tables 4 and 5 for both meshes. This is carried out using the multiplier ¯σx=σx(h2/pz).
From the results obtained it is also possible to understand that the present models denote a better agreement with [10], when a graded variation of the properties is present. In the other cases of a single constituent material, the agreement with [9] is closer. Similar conclusions can be drawn if one uses a similar mesh of Q9 plate finite elements, as can be observed in Table 5.
It is worth noting that the reference solutions are based on higher order theories implemented through meshless methods.
3.2. Case studies
In order to enable a parametric study related to the static response of an FGM plate, a set of studies was developed. To this purpose, a simply supported plate with a varying composition of a metallic matrix and different ceramic inclusions was considered. The effective average properties were determined using Voigt rule of mixtures, and it was also considered the possibility of first hybridizing the metallic matrix with carbon nanotubes with different weight fractions on that response. In all the cases considered, the plate was submitted to a uniformly distributed pressure pz=104 Pa.
The material properties of the metallic and the ceramic phases, used in this sub-section, are given in Table 6. The meshes remain unaltered.
For simplicity, we will denote as FGM1 the mixture of the aluminum matrix with the zirconia, and FGM2 the mixture of the aluminum matrix with alumina. The geometrical and material properties of the carbon nanotubes used to hybridize the metallic aluminum matrix correspond to the ones used by [21] and [28], among others, and are shown in Table 7.
Table 7.Material and geometrical properties of CNTs
The results continue to be presented in a non-dimensional form. It is worth mentioning here that according to [24,39] the diameter here considered for the MWCNTs is expected to provide a worse performance to the nanocomposite, as its aspect ratio is much lower than the one corresponding to the SWCNTs, which in the present case are respectively equal to 2500 and to 17857.143.
3.2.1. Influence of finite element model
In a first stage it was considered the evaluation of the performance of the plate finite element models (Q4, Q9) used in the present work. To achieve this goal, we considered the plate was made of FGM1 and possesses an aspect ratio (a/h) of 20. It was also allowed the possibility of hybridizing the matrix with multi-walled carbon nanotubes (MWCNTs). The fraction volumes of the constituents were assumed to vary continuously. The results obtained for the maximum transverse displacement for different values of exponent (p) of the volume fraction power law, are presented in Table 8.
Table 8.Non-dimensional maximum deflection ˉw, (MWCNT)
As it is possible to confirm, under the present conditions, both elements give a similar response. Because of this, one continues using one or other of these elements in further studies. However Q4 has a lower computational cost, which may be a selection parameter in order to make the more adequate selection for a certain approach. Concerning to the magnitude of the response, it is additionally possible to conclude that from the first case where the FGM1 doesn’t include CNTs to the other two cases where increasing weight fraction contents (wCN) of MWCNT are considered, one obtains an increasing maximum transverse deflection. This is an expected trend in this case, as the present multi-walled nanotubes properties, contribute with a negative strengthening effect to this metallic matrix and therefore to the overall hybrid material. This negative effect, already identified by other authors [39], may be explained through the close relation to the carbon nanotube diameter, which has a very important effect on the resulting properties of the nanocomposite. In fact, there are research works that reported the conclusion that larger diameters [24] lead to lower effective modulus, thus explaining the trend that is visible in the present study.
Just as an academic example we considered two additional situations. A first one, where we simplistically supposed that all the remaining characteristics of the MWCNT would be maintained, except its outer diameter which we will consider to be lower, for example 4e-9 m. In the other case we have considered other MWCNT’s from U.S. Research Nanomaterials Inc. [40]. The information provided by this company was then used to determine the estimated properties for the nanocomposite. The properties for these nanotubes are presented in Table 9.
These cases are respectively identified as MWCNT*, MWCNT** and MWCNT***. As we may see, particularly for the MWCNTs, when a lower diameter (MWCNT**) is considered and assuming that all the remaining parameters would be the same, an increasing trend is verified with the CNTs weigh fraction. If one considers a more realistic situation (MWCNT***) the improvement in the predicted Young’s modulus is quite notorious, even when compared to the SWCNT case.
3.2.2. Influence of continuous and discrete approach
Another aspect that was considered important to analyze is related to the continuous or discrete approach of these hybrid functionally graded composites. To this, one has considered three different numbers of layers, namely five, ten and fifty. Figure 2 illustrates the results obtained as function of MWCNT weight fractions () and power law exponent (p), for five and fifty layers. The plate finite element used was Q9. In a global appreciation, we can conclude from this figure, that the growing pattern of the maximum transverse deflection referred in the previous case is also here confirmed, independently of the number of layers used in the discrete approach.
Figure 3, allows to conclude that when the power law exponent (p) increases from 0.5 to 5, the discrepancy among the results obtained using 5 or 50 layers also increases, which may explained by the mixture evolution rate through the thickness (see Figure 1). This is also visible for lower values of (p) taking as reference the situation (p = 1). The way the convergence occurs for exponent values greater or minor than the unit one is different and is quantified in Table 10.
Figure 3. Non-dimensional maximum deflection ˉw versus MWCNT wCN
Due to symmetry reasons, only one of the in-plane normal stresses, corresponding to this case study, is presented in Tables 11 and 12.
In the first table the functionally graded composite does not incorporates carbon nanotubes and on the second table, a 5% weight fraction of these nano-inclusions are considered. In all the case studies here presented, the stresses are determined at the Gauss points.
As expect there is no symmetry between the values found in the lower and upper surfaces, due to the fact that on these surfaces there exist different materials mixture compositions. In the lower surface we have the metallic matrix (with or without nano-inclusions) and on the upper surface there exists a ceramic-rich mixture. Also because of this, we have greater stresses values on the upper surface, with the exception of the situation when p = 0, where we have a whole ceramic homogeneous composition.
Similar qualitative conclusions can be drawn in the case p = 5. However, as in this case the transverse displacements are lower, then the stresses also become lower.
3.2.3. Influence of carbon nanotubes
Considering now the same plate with an aspect ratio a/h = 10, and assuming that the volume fraction of the metal and ceramic varies continuously, it is important to understand the effect the present SWCNTs and MWCNTs have on the FGM. The FGM used to this purpose continues to be the first one, FGM1. The results were obtained using the same mesh as in the previous case, for the different hybrid nanocomposites and are depicted in Figures 4 and 5.
Figure 4. Non-dimensional maximum deflection ˉw versus exponent p
From Figure 4 we can observe again that incorporating SWCNTs in the FGM1 provide a clear stiffening effect. Also, when we increase the weight fraction of the SWCNTs we obtain decreasing maximum transverse displacements, which is contrary to what happens in the case of MWCNTs inclusion.
Figure 5. Non-dimensional maximum deflection ˉw versus wCN
It is worth noting that this happens with the present materials, because of their relative orders of magnitude. Also, we can observe that the greater the exponent (p) of the power law the greater this effect. In Figure 5 we can observe in more detail the evolution trend of the plate deflection when the FGM1 includes SWCNTs or MWCNTs.
The slopes associated to the non-dimensional deflection of the hybrid SWCNT nanocomposites are positive whereas the slopes of the MWCNT nanocomposites are negative. The in-plane non-dimensional stress at the plates outer surfaces centroid’s can be seen in Tables 13 and 14, for different SWCNT and MWCNT weight fractions.
Table 13.Non-dimensional stress ¯σx at plate outer surfaces’ centroids (SWCNT)
Similar conclusions concerning to the trend evolution depending on the exponent of the volume fraction power law and on the CNT weight fraction, can be taken from these tables.
To note that the results associated to the null MWCNT weight fraction were omitted because that situation is already contemplated in the null SWCNT weight fraction case, i.e. there are no nano inclusions.
Table 14.Non-dimensional stress ¯σx at plate outer surfaces’ centroids (MWCNT)
The non-dimensional normal stress distribution can be observed in Figure 6. A symmetric distribution profile is visible as it was expected, and the places where the minimum and maximum values occur are respectively identified by red or blue triangles. This extrema identification is not taken in absolute value but instead considers the real mathematical relation among the values.
Figure 6. In-plane non-dimensional normal stress ¯σx (wCN= 0)
Due to symmetry reasons only the non-dimensional in-plane shear stress and one of the interlaminar shear stresses (¯σxy and ¯σxz) are presented in Tables 15 to 17.
If the FGM1 includes carbon nanotubes either multi-walled or single-walled, then the structural response for the set of weight fractions considered can be observed in Tables 16 and 17 respectively. From these tables, it is possible to understand that the shear stresses present higher values in the case of the MWCNT, for a similar weight fraction, which is expected as we have already seen for the maximum transverse displacements.
Table 15.Non-dimensional maximum shear stresses, ¯σxy and ¯σxz
To note also that the positive stresses are also higher in this last case due to a cross effect with the elastic properties of the ceramic-rich mixture.
The aspect ratio of the plate structure is an important geometrical parameter, because it is commonly considered as a first selection indicator of the shear deformation theory to use. It may also give us a preliminary perception of expectable deformations, in connection with the boundary conditions to which the plate is submitted. To illustrate its influence, two aspect ratios were chosen, a/h = 10 and a/h = 20. The FGM1 continues to be considered as well as its mixture continuous variation. The non-dimensional deflections obtained, considering the dispersion or not, of single-walled carbon nanotubes can be observed in Table 18.
Table 18.Non-dimensional maximum deflection ˉw (SWCNT)
It is possible to see that the non-dimensional in-plane shear stress is not affected by the aspect ratio, while in the case of the interlaminar shear stress, which are known to increase when the plate becomes thicker, this trend is verified by the corresponding non-dimensional quantity.
Table 21.Non-dimensional maximum shear stresses, ¯σxy and ¯σxz (SWCNT)
From Figure 9, although the nature of the distribution surface is preserved, the magnitude of the non-dimensional stress is higher for the minor aspect ratio. The response pattern identified is also extensive to the cases where nanotubes are dispersed in the metallic constituent phase.
3.2.5. Influence of ceramic materials
Structures made of different materials will potentially behave differently, so in this case we will consider both FGM1 and FGM2 and the hybridization of these FGMs with SWCNTs. An aspect ratio a/h = 10 is chosen and the volume fractions continues to vary continuously. Similar meshes were used as well as the external load applied. The non-dimensional maximum transverse displacements are presented in Table 22.
Table 22.Non-dimensional maximum deflection ˉw, (SWCNT)
The maximum deflections become minor for FGM2 when compared with the ones obtained using FGM1. This is an expected pattern, as the second material because of its elastic properties, has a higher strengthening effect. Also, we can say that within the range of SWCNTs contents considered (not to compromise the CNTs dispersion) the higher the weight fraction, the stiffer the plate becomes.
Concerning to the non-dimensional normal stress ¯σx and shear stresses ¯σxy and ¯σxz, Tables 23 to 25 illustrate the influence of the ceramic material used. In these cases we see that the increase of the SWCNT weight fraction produces minor magnitude non-dimensional stresses. This effect was already identified in previous sub-sections.
Table 23.Non-dimensional maximum shear stresses ¯σx, (SWCNT)
Additionally, the FGM2 plate when compared to the FGM1 plate, presents higher non-dimensional stresses, which is due to the magnitude of its elastic stiffness coefficients.
Table 24.Non-dimensional maximum shear stresses ¯σxy, (SWCNT)
This work presents a characterization study of the static response of moderately thick plates made of dual-phase metal-ceramic functionally graded materials, where it was also considered the possibility of dispersing carbon nanotubes in the metallic matrix. The resulting hybrid multiscale composites were then used in order to predict the response of a plate structure and its dependence on a set of selected parameters. The structural responses analyzed were the maximum transverse displacement of the plates and normal and shear stress components. The parametric studies carried out allowed characterizing the influence of material and geometrical properties of the plates analyzed. Summarizing the results obtained in the different parametric studies carried out, it is possible to conclude that for the discretization used there is no significant difference between the two plate finite elements implemented. It is also possible to say that using a sufficiently large number of discrete layers with a constant volume fraction one converges to the results associated to the continuous volume fraction variation through thickness. Concerning to the inclusion of carbon nanotubes we conclude that single walled carbon nanotubes provide a clear stiffening effect visible either in the transverse deflection or on the stresses distributions. These patterns are verified for the weight fractions contents considered in this study. Because of the material properties, namely the aspect ratio considered for the multi-walled carbon nanotubes, as opportunely mentioned, its inclusion produced an inverse contribution, when compared to the single-walled ones. However as it was illustrated, one can say that the inclusion of adequately selected multi-walled carbon nanotubes may provide a significant improvement in the mechanical performance of the nanocomposite and subsequently of the hybrid composite. The aspect ratio of the plates is also a relevant parameter. As we can conclude from the results obtained, thicker plates present lower transverse displacements, and thus stresses. However it is possible to see that interlaminar shear stresses increase with the aspect ratio decrease. When the plate includes the higher modulus ceramic it is also visible the expected response of lower displacements and stresses. Globally, the results obtained from this parametric study are expected to contribute to the understanding of the static behavior of metal-ceramic functionally graded materials with dispersed carbon nanotubes.
Acknowledgments
The authors acknowledge the support from Project LAETA, UID/EMS/50022/2013.
Conflict of Interest
The authors report no conflict of interests in this research.
References
[1]
Zok FW, Levi CG (2001) Mechanical Properties of Porous-Matrix Ceramic Composites. Adv Eng Mater 3: 15-23.
[2]
Ramakrishna S, Mayer J, Wintermantel E, et al. (2001) Biomedical applications of polymer-composite materials: a review. Compos Sci Technol 61: 1189-1224. doi: 10.1016/S0266-3538(00)00241-4
[3]
Hussain F, Hojjati M, Okamoto M, et al. (2006) Polymer-matrix Nanocomposites, Processing, Manufacturing, and Application: An Overview. J Compos Mater 40: 1511-1575. doi: 10.1177/0021998306067321
[4]
Esawi AMK, Morsi K, Sayed A, et al. (2010) Effect of carbon nanotube (CNT) content on the mechanical properties of CNT-reinforced aluminium composites. Compos Sci Technol 70: 2237-2241. doi: 10.1016/j.compscitech.2010.05.004
[5]
Neubauer E, Kitzmantel M, Hulman M, et al. (2010) Potential and challenges of metal-matrix-composites reinforced with carbon nanofibers and carbon nanotubes. Compos Sci Technol 70: 2228-2236. doi: 10.1016/j.compscitech.2010.09.003
[6]
Metal Matrix Composites: Materials, Manufacturing and Engineering. Edited by J. Paulo Davim. Walter de Gruyter GmbH, Berlin/Munich/Boston (2014).
[7]
Miyamoto Y, Kaysser WA, Rabin BH, et al. (1999) Functionally graded materials: design, processing and applications. Springer, New York.
[8]
Birman V, Byrd LW (2007) Modeling and Analysis of Functionally Graded materials and Structures. Appl Mech Rev 60: 195-216. doi: 10.1115/1.2777164
[9]
Ferreira AJM, Batra RC, Roque CMC, et al. (2005) Static analysis of functionally graded plates using third-order shear deformation theory and a meshless method. Compos Struct 69: 449-457. doi: 10.1016/j.compstruct.2004.08.003
[10]
Qian LF, Batra RC, Chen LM (2004) Static and dynamic deformations of thick functionally graded elastic plates by using higher-order shear and normal deformable plate theory and meshless local Petrov-Galerkin method. Compos Part B 35: 685-697 doi: 10.1016/j.compositesb.2004.02.004
[11]
Loja MAR, Barbosa JI, Mota Soares CM (2012) A Study on the Modeling of Sandwich Functionally Graded Particulate Composites. Compos Struct 94: 2209-2217. doi: 10.1016/j.compstruct.2012.02.015
[12]
Tornabene F, Fantuzzi N, Bacciocchi M (2014) Free vibrations of free-form doubly-curved shells made of functionally graded materials using higher-order equivalent single layer theories. Compos Part B 67: 490-509. doi: 10.1016/j.compositesb.2014.08.012
[13]
Viola E, Rossetti L, Fantuzzi N, et al. (2014) Static analysis of functionally graded conical shells and panels using the generalized unconstrained third order theory coupled with the stress recovery. Compos Struct 112: 44-65. doi: 10.1016/j.compstruct.2014.01.039
[14]
Loja MAR, Barbosa JI, Mota Soares CM (2015) Analysis of Sandwich Beam Structures Using Kriging Based Higher Order Models. Compos Struct 119: 99-106. doi: 10.1016/j.compstruct.2014.08.019
[15]
Fazzolari F (2015) Natural frequencies and critical temperatures of functionally graded sandwich plates subjected to uniform and non-uniform temperature distributions. Compos Struct 121: 197-210. doi: 10.1016/j.compstruct.2014.10.039
[16]
Thostenson ET, Li C, Chou T-W (2005) Review: Nanocomposites in context. Compos Sci Technol 65: 491-516. doi: 10.1016/j.compscitech.2004.11.003
[17]
Zapata-Solvas E, Gómez-García D, Domínguez-Rodríguez A (2012) Towards physical properties tailoring of carbon nanotubes-reinforced ceramic matrix composites. J Eur Ceram Soc 32: 3001-3020. doi: 10.1016/j.jeurceramsoc.2012.04.018
[18]
Coleman JN, Khan U, Blau WJ, et al. (2006) Small but strong: A review of the mechanical properties of carbon nanotube-polymer composites. Carbon 44: 1624-1652. doi: 10.1016/j.carbon.2006.02.038
[19]
Kuilla T, Bhadra S, Yao D, et al. (2010) Recent advances in graphene based polymer composites. Prog Polym Sci 35: 1350-1375. doi: 10.1016/j.progpolymsci.2010.07.005
[20]
Du J-H, Bai J, Cheng H-M (2007) The present status and key problems of carbon nanotube based polymer composites. eXPRESS Polym Lett 1: 253-273. doi: 10.3144/expresspolymlett.2007.39
[21]
Kim M, Park Y-B, Okoli OI, et al. (2009) Processing, characterization, and modeling of carbon nanotube-reinforced multiscale composites. Compos Sci Technol 69: 335-342. doi: 10.1016/j.compscitech.2008.10.019
[22]
Hu Y, Shenderova OA, Hu Z, et al. (2006) Carbon nanostructures for advanced composites. Rep Prog Phys 69: 1847-1895.
[23]
Ajayan PM, Schadler LS, Giannaris C, et al. (2000) Single-walled carbon nanotube-polymer composites: Strength and weakness. Adv Mater 12: 750.
[24]
Salvetat JP, Briggs GAD, Bonard JM, et al. (1999) Elastic and Shear Moduli of Single-Walled Carbon Nanotube Ropes. Phys Rev Lett 82: 944. doi: 10.1103/PhysRevLett.82.944
[25]
Liew KM, Wong CH, Tan MJ (2006) Tensile and compressive properties of carbon nanotube bundles. Acta Mater 54: 225-231. doi: 10.1016/j.actamat.2005.09.002
[26]
Bartolucci SF, Paras J, Rafiee MA, et al. (2011) Graphene-aluminum nanocomposites. Mater Sci Eng A 528: 7933-7937. doi: 10.1016/j.msea.2011.07.043
[27]
Rashad M, Pan F, Hua H, et al. (2015) Enhanced tensile properties of magnesium composites reinforced with graphene nanoplatelets. Mater Sci Eng A 630: 36-44. doi: 10.1016/j.msea.2015.02.002
[28]
Rafiee M, He XQ, Mareishi S, et al. (2014) Modeling and stress analysis of smart cnts/fiber/polymer multiscale composite plates. Int J Appl Mech 6: 1450025. doi: 10.1142/S1758825114500252
[29]
Zhu P, Lei ZX, Liew KM (2012) Static and free vibration analyses of carbon nanotube-reinforced composite plates using finite element method with first order shear deformation plate theory. Compos Struct 94: 1450-1460. doi: 10.1016/j.compstruct.2011.11.010
[30]
Alibeigloo A, Liew KM (2013) Thermoelastic analysis of functionally graded carbon nanotube-reinforced composite plate using theory of elasticity. Compos Struct 106: 873-881. doi: 10.1016/j.compstruct.2013.07.002
[31]
Liew KM, Lei ZX, Zhang LW (2015) Mechanical analysis of functionally graded carbon nanotube reinforced composites: A review. Compos Struct 120: 90-97. doi: 10.1016/j.compstruct.2014.09.041
[32]
Tornabene F, Fantuzzi N, Bacciocchi M, et al. (2016) Effect of agglomeration on the natural frequencies of functionally graded carbon nanotube-reinforced laminated composite doubly curved shells. Compos Part B 89: 187-218. doi: 10.1016/j.compositesb.2015.11.016
[33]
Halpin JC, Kardos JL (1976) The Halpin-Tsai Equations: A Review. Polym Eng Sci 16: 344-352. doi: 10.1002/pen.760160512
[34]
Suhr J, Koratkar N, Keblinski P, et al. (2005) Viscoelasticity in carbon nanotube composites. Nat Mater 4: 134. doi: 10.1038/nmat1293
[35]
Sinnott SB (2002) Chemical functionalization of carbon nanotubes: a review. J Nanosci Nanotechnol 2: 113. doi: 10.1166/jnn.2002.107
[36]
Balasubramanian K, Burghard M (2005) Chemically functionalized carbon nanotubes. Nano Micro Small 1: 180-192.
[37]
Ma P-C, Siddiqui NA, Marom G, et al. (2010) Dispersion and functionalization of carbon nanotubes for polymer-based nanocomposites: A review. Compos Part A 41: 1345-1367. doi: 10.1016/j.compositesa.2010.07.003
[38]
Reddy JN (2004) Mechanics of Laminated Composite Plates and Shells: Theory and Analysis, 2nd ed., CRC Press.
[39]
Abu Al-Rub RK, Tyson BM, Yazdanbakhsh A (2012) On the aspect ratio effect of multi-walled carbon nanotube reinforcements on the mechanical properties of cementitious nanocomposites. Constr Build Mater 35: 647-655. doi: 10.1016/j.conbuildmat.2012.04.086
[40]
U.S. Research Nanomaterials Inc. Available from: (http://www.us-nano.com/inc/sdetail/215, 21 June 2016, 17:38 GMT).
This article has been cited by:
1.
M. A. R. Loja,
Dynamic Response of Soft Core Sandwich Beams with Metal-Graphene Nanocomposite Skins,
2017,
2017,
1070-9622,
1,
10.1155/2017/7842413
2.
G. M. S. Bernardo, M. A. R. Loja,
Reconstruction and analysis of hybrid composite shells using meshless methods,
2017,
9,
2008-3556,
111,
10.1007/s40091-017-0152-2
3.
A. F. Mota, M. A. R. Loja,
Mechanical Behavior of Porous Functionally Graded Nanocomposite Materials,
2019,
5,
2311-5629,
34,
10.3390/c5020034
4.
Ravi Kumar, Ajay Kumar, Małgorzata Szafraniec, Danuta Barnat-Hunek, Joanna Styczeń,
Axial and Shear Buckling Analysis of Multiscale FGM Carbon Nanotube Plates Using the MTSDT Model: A Numerical Approach,
2022,
15,
1996-1944,
2401,
10.3390/ma15072401
5.
Ana Filipa Mota, Maria Amélia Ramos Loja,
A study on porous nanocomposite graded plates using equivalent single layer and layerwise models,
2022,
1537-6494,
1,
10.1080/15376494.2022.2092665
6.
Ranojit Banerjee, Mrutyunjay Rout, Dipankar Bose, Amit Karmakar,
A solution to free vibration of rotating pretwisted hybrid CNTs multiscale functionally graded conical shell,
2022,
23,
1550-2287,
367,
10.1080/15502287.2021.1973151
7.
Alda Carvalho, Ana Martins, Ana F. Mota, Maria A. R. Loja,
Variability on Functionally Graded Plates’ Deflection Due to Uncertainty on Carbon Nanotubes’ Properties,
2024,
29,
2297-8747,
22,
10.3390/mca29020022
D. M. S. Costa, M. A. R. Loja. Assessing the static behavior of hybrid CNT-metal-ceramic composite plates[J]. AIMS Materials Science, 2016, 3(3): 808-831. doi: 10.3934/matersci.2016.3.808
D. M. S. Costa, M. A. R. Loja. Assessing the static behavior of hybrid CNT-metal-ceramic composite plates[J]. AIMS Materials Science, 2016, 3(3): 808-831. doi: 10.3934/matersci.2016.3.808
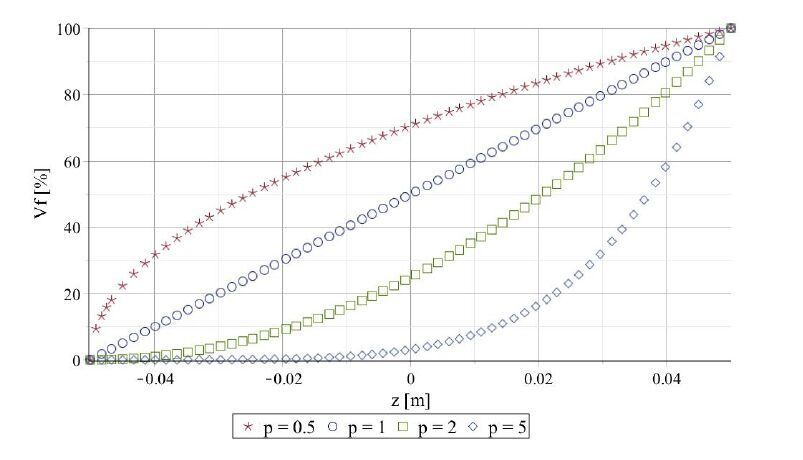 Figure 1. Volume fraction distribution through FGM thickness
 DownLoad: CSV
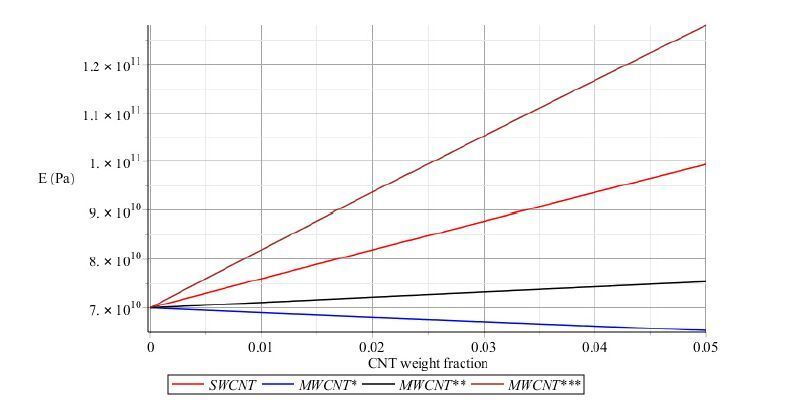 Figure 2. Evolution of Young modulus E versus wCN, for different nanocomposites
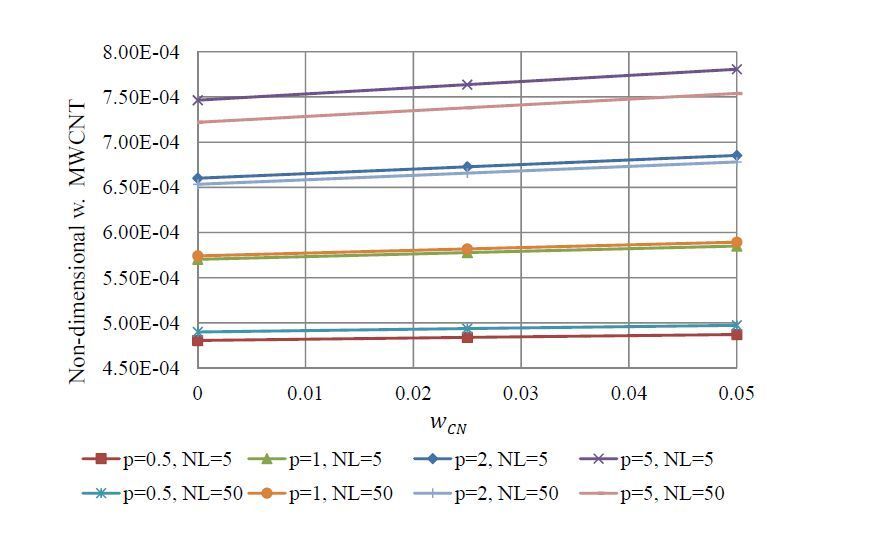 Figure 3. Non-dimensional maximum deflection ˉw versus MWCNT wCN
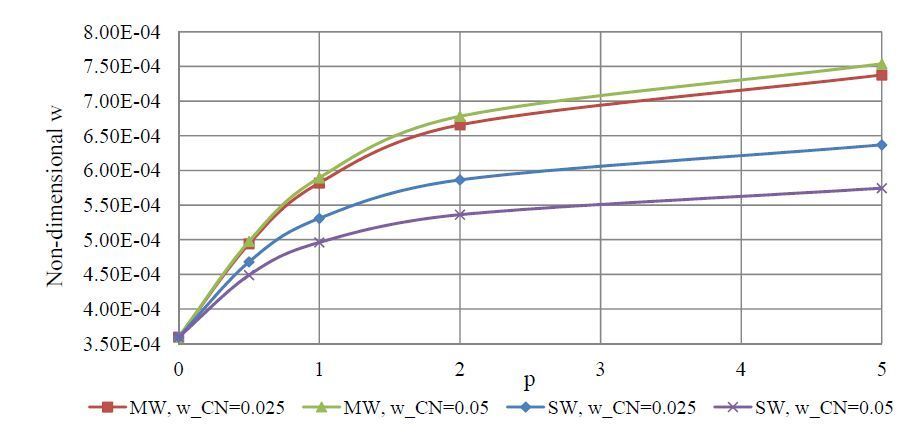 Figure 4. Non-dimensional maximum deflection ˉw versus exponent p
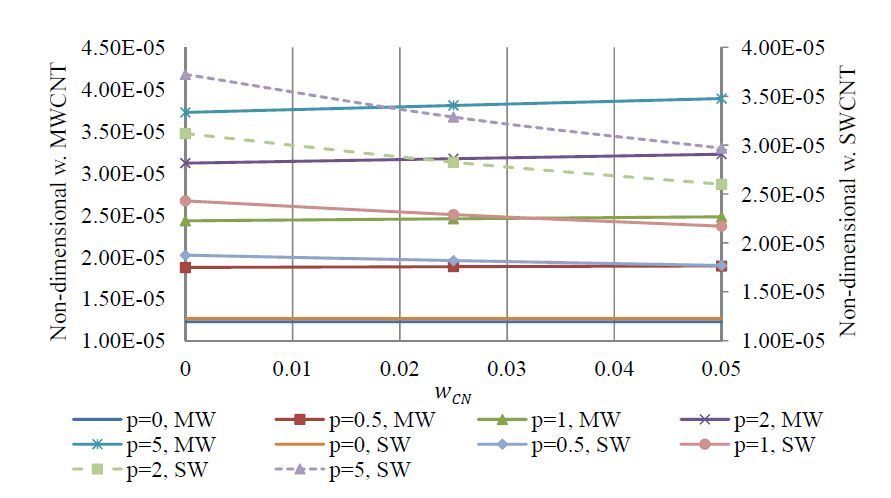 Figure 5. Non-dimensional maximum deflection ˉw versus wCN
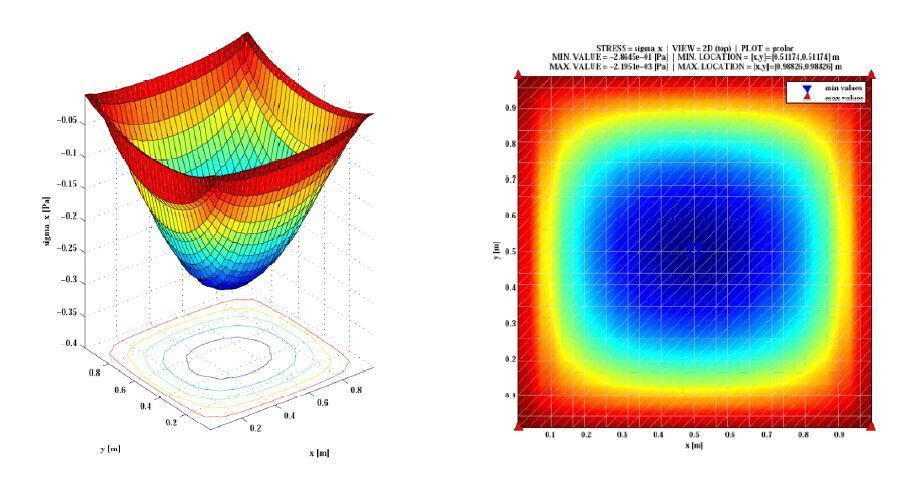 Figure 6. In-plane non-dimensional normal stress ¯σx (wCN= 0)
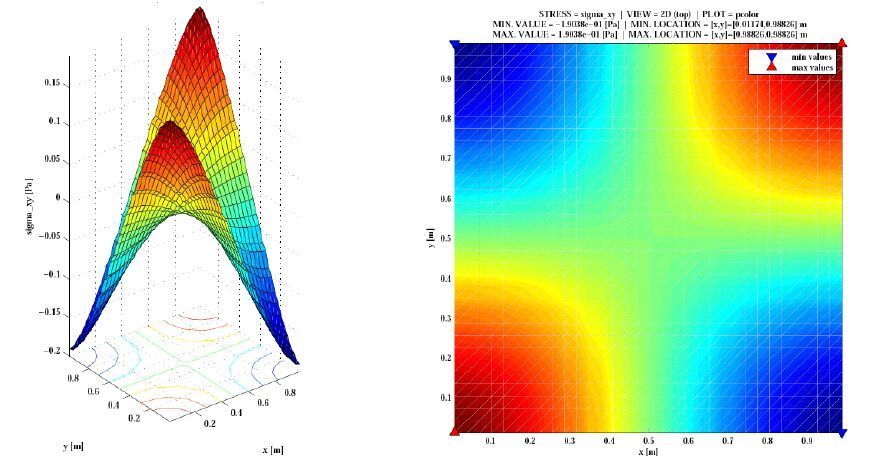 Figure 7. In-plane shear stress ¯σxy (wCN= 0)
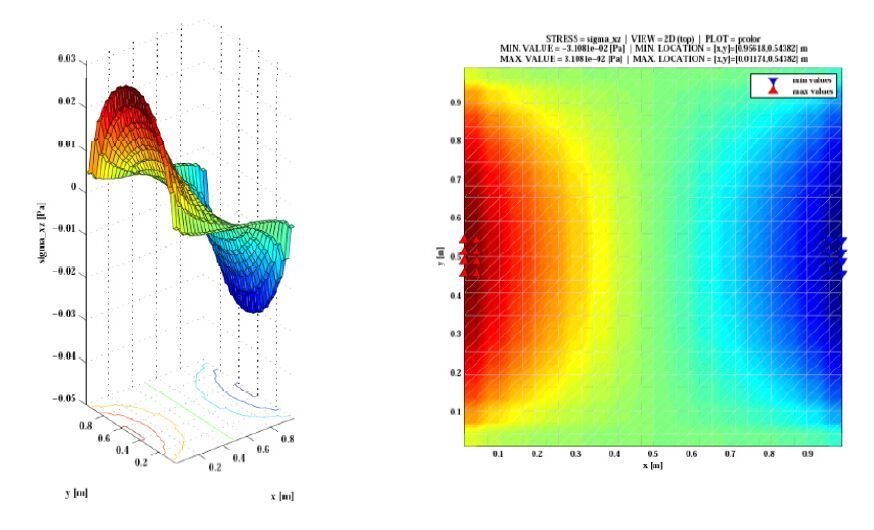 Figure 8. Interlaminar shear stress ¯σxz (wCN= 0)
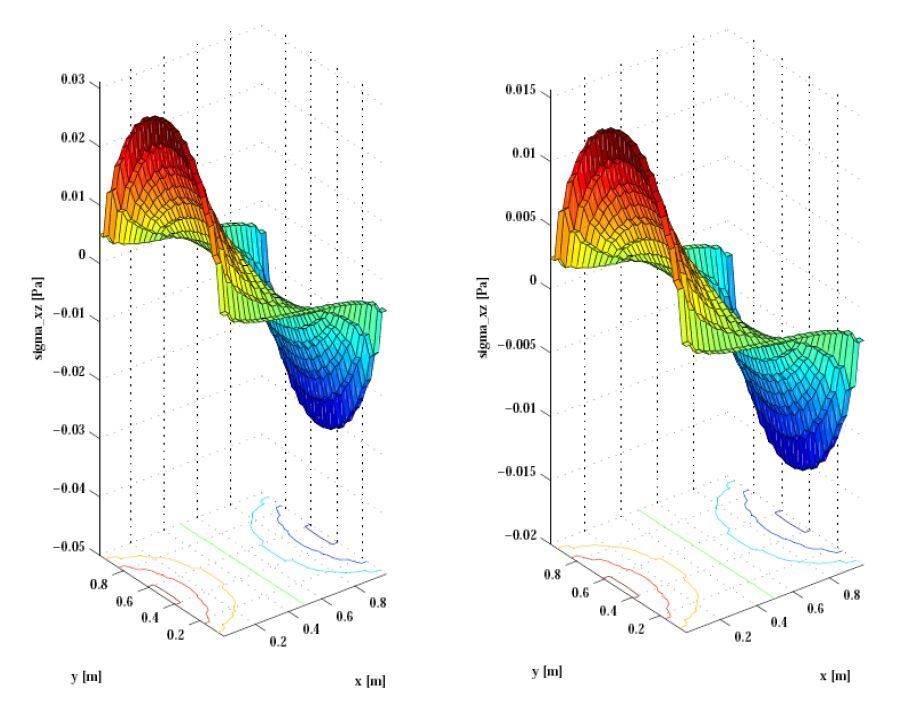 Figure 9. Interlaminar shear stress ¯σxz (a/h = 10, a/h = 20, wCN = 0%)


