The issuance of the 2022 White Paper on Smart Cities has brought the notion of smart cities to the forefront. This conceptual framework revolves around green and sustainable development, aligning seamlessly with China's mission to strengthen ecological civilization in the contemporary era. In this study, we delve into the implications of employees' perception of smart cities on their ecologically conscious behaviors, drawing upon the frameworks of self-determination theory. The empirical analysis encompasses 306 employee respondents hailing from diverse enterprises and backgrounds. The findings extracted from this investigation reveal several crucial insights: (1) A robust and positive correlation between the employees' perception of smart cities and their eco-friendly behaviors; (2) corporate environmental responsibility assumes a partially mediating role between the employees' perception of smart cities and eco-friendly behaviors; (3) environmental awareness emerges as a constructive moderator in the interplay between corporate environmental responsibility and employees' eco-friendly behaviors; (4) notably, the impact of employees' perception of smart cities on employees' eco-friendly behaviors assumes greater prominence when environmental awareness is high, signifying an intensified indirect relationship. This dynamic underscores that during periods of heightened environmental awareness, the influence of employees' perception of smart cities on eco-friendly behaviors becomes more pronounced, reinforced by a more substantial indirect influence channeled through corporate environmental responsibility. These findings enhance the theoretical underpinnings of self-determination theory. Enterprises are encouraged to underscore and incentivize employees' pro-environmental behaviors, integrate environmental preservation paradigms into corporate culture and enhance green management initiatives, synergistically advancing shared ecological objectives for both enterprises and employees.
Citation: Yin Jun, Youling Li, Zijun Xin. The Impact of Employees' Perception of Smart Cities on Employee Green Behavior: A Moderated Mediation Model[J]. AIMS Geosciences, 2023, 9(4): 810-832. doi: 10.3934/geosci.2023044
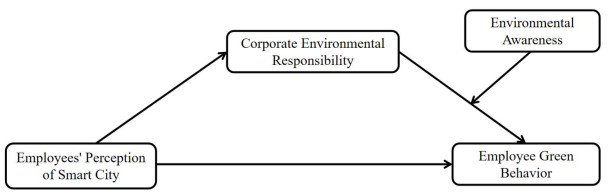
The issuance of the 2022 White Paper on Smart Cities has brought the notion of smart cities to the forefront. This conceptual framework revolves around green and sustainable development, aligning seamlessly with China's mission to strengthen ecological civilization in the contemporary era. In this study, we delve into the implications of employees' perception of smart cities on their ecologically conscious behaviors, drawing upon the frameworks of self-determination theory. The empirical analysis encompasses 306 employee respondents hailing from diverse enterprises and backgrounds. The findings extracted from this investigation reveal several crucial insights: (1) A robust and positive correlation between the employees' perception of smart cities and their eco-friendly behaviors; (2) corporate environmental responsibility assumes a partially mediating role between the employees' perception of smart cities and eco-friendly behaviors; (3) environmental awareness emerges as a constructive moderator in the interplay between corporate environmental responsibility and employees' eco-friendly behaviors; (4) notably, the impact of employees' perception of smart cities on employees' eco-friendly behaviors assumes greater prominence when environmental awareness is high, signifying an intensified indirect relationship. This dynamic underscores that during periods of heightened environmental awareness, the influence of employees' perception of smart cities on eco-friendly behaviors becomes more pronounced, reinforced by a more substantial indirect influence channeled through corporate environmental responsibility. These findings enhance the theoretical underpinnings of self-determination theory. Enterprises are encouraged to underscore and incentivize employees' pro-environmental behaviors, integrate environmental preservation paradigms into corporate culture and enhance green management initiatives, synergistically advancing shared ecological objectives for both enterprises and employees.

| [1] | Tao XD (2021) Global megacity social governance model and experience. Shanghai Academy of Social Sciences Press. |
| [2] |
Wu J, Xiang WN, Zhao J (2014) Urban ecology in China: Historical developments and future directions. Landscape Urban Plann 125: 222–233. https://doi.org/10.1016/j.landurbplan.2014.02.010 doi: 10.1016/j.landurbplan.2014.02.010

|
| [3] |
Lai L, Huang X, Yang H, et al. (2016) Carbon emissions from land-use change and management in China between 1990 and 2010. Sci Adv 2: e1601063. https://doi.org/10.1126/sciadv.160106 doi: 10.1126/sciadv.160106
|
| [4] |
Ng BJ, Zhou J, Giannis A, et al. (2014) Environmental life cycle assessment of different domestic wastewater streams: policy effectiveness in a tropical urban environment. J Environ Manage 140: 60–68. https://doi.org/10.1016/j.jenvman.2014.01.052 doi: 10.1016/j.jenvman.2014.01.052
|
| [5] |
Paskaleva KA (2011) The smart city: A nexus for open innovation? Intell Build Int 3: 153–171. https://doi.org/10.1080/17508975.2011.586672 doi: 10.1080/17508975.2011.586672
|
| [6] |
Anttiroiko AV, Valkama P, Bailey SJ (2014) Smart cities in the new service economy: building platforms for smart services. AI Soc 29: 323–334. https://doi.org/10.1007/s00146-013-0464-0 doi: 10.1007/s00146-013-0464-0
|
| [7] | Wang XY (2020) Research on the transformation of social governance model in the transformation of smart society. Doctoral dissertation, Xidian University. https://doi.org/10.27389/d.cnki.gxadu.2020.003394 |
| [8] |
Georgiadis A, Christodoulou P, Zinonos Z (2021) Citizens' Perception of Smart Cities: A Case Study. Appl Sci 11: 2517. https://doi.org/10.3390/app11062517 doi: 10.3390/app11062517
|
| [9] | Wang WY (2022) Experience inspiration and countermeasures for the construction of advanced smart cities. Master's thesis, Shenyang Jianzhu University. https://doi.org/10.27809/d.cnki.gsjgc.2022.000298 |
| [10] | Polzonetti A, Sagratella M (2018) Smart city and green development. In Challenges and Opportunities in the Digital Era: 17th IFIP WG 6.11 Conference on e-Business, e-Services, and e-Society, I3E 2018, Kuwait City, Kuwait, October 30–November 1, 2018, Proceedings 17,191–204. Springer International Publishing. https://doi.org/10.1007/978-3-030-02131-3_18 |
| [11] |
Trindade EP, Hinnig MPF, da Costa EM, et al. (2017) Sustainable development of smart cities: A systematic review of the literature. J Open Innovation 3: 1–14. https://doi.org/10.1186/s40852-017-0063-2 doi: 10.1186/s40852-017-0063-2
|
| [12] |
Marsal-Llacuna ML, Colomer-Llinàs J, Meléndez-Frigol J (2015) Lessons in urban monitoring taken from sustainable and livable cities to better address the Smart Cities initiative. Technol Forecast Soc Change 90: 611–622. https://doi.org/10.1016/j.techfore.2014.01.012 doi: 10.1016/j.techfore.2014.01.012
|
| [13] | Wang Q (2021) Nested Implementation of pilot low-carbon city policies in China and its effects. Doctoral dissertation, Huazhong University of Science and Technology. https://doi.org/10.27157/d.cnki.ghzku.2021.006630 |
| [14] | Zhang XW (2022) Study on green development and evaluation of Chinese characteristic towns. Doctoral dissertation, Nanchang University. https://doi.org/10.27232/d.cnki.gnchu.2022.004375 |
| [15] |
Xin D (2023) Status Perception of Private Entrepreneurs and Corporate Green Behavior——Evidence from China Private Enterprise Survey (CPES) Data. J China Univ Geosci 23: 64–80. https://doi.org/10.16493/j.cnki.42-1627/c.20230413.001 doi: 10.16493/j.cnki.42-1627/c.20230413.001
|
| [16] | Wang XY (2022) Study on the influence mechanism of environment-friendly leadership on employees' green behavior. Master's thesis, Guizhou University of Finance and Economics. https://doi.org/10.27731/d.cnki.ggzcj.2022.000332 |
| [17] |
Liu WL, Chen TP (2023) Research on the impact of smart city construction on enterprise green technology innovation: An analysis of regulatory effects based on digital transformation. Econ Vert Horizontal 1: 68–78. https://doi.org/10.16528/j.cnki.22-1054/f.202307068 doi: 10.16528/j.cnki.22-1054/f.202307068
|
| [18] |
Ryan RM, Deci EL (2000) Self-determination theory and the facilitation of intrinsic motivation, social development, and well-being. Am Psychol 55: 68–78. https://doi.org/10.1037/0003-066X.55.1.68 doi: 10.1037/0003-066X.55.1.68
|
| [19] |
Gillison FB, Rouse P, Standage M, et al. (2019) A meta-analysis of techniques to promote motivation for health behaviour change from a self-determination theory perspective. Health Psychol Rev 13: 110–130. https://doi.org/10.1080/17437199.2018.1534071 doi: 10.1080/17437199.2018.1534071
|
| [20] |
Chen CX, Zhang J, Gilal FG (2019) Composition of motivation profiles at work using latent analysis: theory and evidence. Psychol Res Behav Manage 12: 811–824. https://doi.org/10.2147/PRBM.S210830 doi: 10.2147/PRBM.S210830
|
| [21] | Jiao YF (2023) Research on the influence mechanism of corporate environmental responsibility perception on employees' green behavior. Master's thesis, Lanzhou University of Finance and Economics. https://doi.org/10.27732/d.cnki.gnzsx.2023.000023 |
| [22] |
Klauser F, Paasche T, Söderström O (2014) Michel Foucault and the smart city: Power dynamics inherent in contemporary governing through code. Environ Plann D Soc Space 32: 869–885. https://doi.org/10.1068/d13041p doi: 10.1068/d13041p
|
| [23] |
Martínez García de Leaniz P, Herrero Crespo Á, Gómez López R (2018) Customer responses to environmentally certified hotels: The moderating effect of environmental consciousness on the formation of behavioral intentions. J Sustainable Tourism 26: 1160–1177. https://doi.org/10.1080/09669582.2017.1349775 doi: 10.1080/09669582.2017.1349775
|
| [24] |
Cheng C, Ahmad SF, Irshad M, et al. (2023) Impact of green process innovation and productivity on sustainability: The moderating role of environmental awareness. Sustainability 15: 12945. https://doi.org/10.3390/su151712945 doi: 10.3390/su151712945
|
| [25] | Huang L, Guo Z (2023) How Can the Idea of Harmonious Coexistence between Human and Nature Be Put into Practice at the Employee Level Effectively? Impact Mechanism of Man-Nature Orientation on Employees' Green Behavior. J Bus Econ 8: 27–40. |
| [26] |
Harrison C, Eckman B, Hamilton R, et al. (2010) Foundations for smarter cities. IBM J Res Dev 54: 1–16. https://doi.org/10.1147/JRD.2010.2048257 doi: 10.1147/JRD.2010.2048257
|
| [27] |
Degbelo A, Granell C, Trilles S, et al. (2016) Opening up smart cities: citizen-centric challenges and opportunities from GIScience. ISPRS In J Geo-Inf 5: 16. https://doi.org/10.3390/ijgi5020016 doi: 10.3390/ijgi5020016
|
| [28] |
Visvizi A, Lytras MD, Damiani E, et al. (2018) Policy making for smart cities: Innovation and social inclusive economic growth for sustainability. J Sci Technol Policy Manage 9: 126–133. https://doi.org/10.1108/JSTPM-07-2018-079 doi: 10.1108/JSTPM-07-2018-079
|
| [29] |
Batty M, Axhausen KW, Giannotti F, et al. (2012) Smart cities of the future. Eur Phys J Spec Top 214: 481–518. https://doi.org/10.1140/epjst/e2012-01703-3 doi: 10.1140/epjst/e2012-01703-3
|
| [30] |
Santos PM, Rodrigues JG, Cruz SB, et al. (2018) PortoLivingLab: An IoT-based sensing platform for smart cities. IEEE Internet Things J 5: 523–532. https://doi.org/10.1109/JIOT.2018.2791522 doi: 10.1109/JIOT.2018.2791522
|
| [31] | Peng L (2021) Comparative study on international smart city security governance. Doctoral dissertation, Shanghai International Studies University. https://doi.org/10.27316/d.cnki.gswyu.2021.001210 |
| [32] |
Norton TA, Parker SL, Zacher H, et al. (2015). Employee Green Behavior: A Theoretical Framework, Multilevel Review, and Future Research Agenda. Organ Environ 28: 103–125. https://doi.org/10.1177/1086026615575773 doi: 10.1177/1086026615575773
|
| [33] | Schmit MJ, Fegley S, Esen E, et al. (2012) Human resource management efforts for environmental sustainability: A survey of organizations. Managing Hum Res Environ Sustainability 2012: 61–80. |
| [34] |
Schmitt MT, Aknin LB, Axsen J, et al. (2018) Unpacking the relationships between pro-environmental behavior, life satisfaction, and perceived ecological threat. Ecol Econ 143: 130–140. https://doi.org/10.1016/j.ecolecon.2017.07.007 doi: 10.1016/j.ecolecon.2017.07.007
|
| [35] |
Zhang RB, Zhong CB (2022) Smart city pilot projects, nearby pollution transfer, and green and low-carbon development: new evidence from Chinese counties. China Popul Res Environ 32: 91–104. https://doi.org/10.12062/cpre.20210622 doi: 10.12062/cpre.20210622
|
| [36] | Commission of the European Communities (2001) Green paper: Promoting a European framework for corporate social responsibility. Commission of the European Communities. |
| [37] |
De Bakker F, Nijhof A (2002) Responsible chain management: a capability assessment framework. Bus Strategy Environ 11: 63–75. https://doi.org/10.1002/bse.319 doi: 10.1002/bse.319
|
| [38] | Freeman RE (2010) Strategic management: A stakeholder approach. Cambridge university press. https://doi.org/10.1017/CBO9781139192675 |
| [39] |
Eesley C, Lenox MJ (2006) Firm responses to secondary stakeholder action. Strategic Manage J 27: 765–781. https://doi.org/10.1002/smj.536 doi: 10.1002/smj.536
|
| [40] |
Lee JW, Kim YM, Kim YE (2018) Antecedents of adopting corporate environmental responsibility and green practices. J Bus Ethics 148: 397–409. https://doi.org/10.1007/s10551-016-3024-y doi: 10.1007/s10551-016-3024-y
|
| [41] |
Gu F, Liu J (2022) Environmentally Specific Servant Leadership and Employee Workplace Green Behavior: Moderated Mediation Model of Green Role Modeling and Employees' Perceived CSR. Sustainability 14: 11965. https://doi.org/10.3390/su141911965 doi: 10.3390/su141911965
|
| [42] | Yuan RB (2019) Research on environmental facilities design based on the perspective of smart city. Master's thesis, Tianjin University. https://doi.org/10.27356/d.cnki.gtjdu.2019.001812 |
| [43] |
Collier J, Esteban R (2007) Corporate social responsibility and employee commitment. Bus Ethics 16: 19–33. https://doi.org/10.1111/j.1467-8608.2006.00466.x doi: 10.1111/j.1467-8608.2006.00466.x
|
| [44] |
Darvishmotevali M, Altinay L (2022) Green HRM, environmental awareness and green behaviors: The moderating role of servant leadership. Tourism Manage 88: 104401. https://doi.org/10.1016/j.tourman.2021.104401 doi: 10.1016/j.tourman.2021.104401
|
| [45] |
Tian Q, Robertson JL (2019) How and when does perceived CSR affect employees' engagement in voluntary pro-environmental behavior? J Bus Ethics 155: 399–412. https://doi.org/10.1007/s10551-017-3497-3 doi: 10.1007/s10551-017-3497-3
|
| [46] |
Paillé P (2021) "I don't owe you, but I am committed": Does felt obligation matter on the effect of green training on employee environmental commitment. Organ Environ 34: 123–144. https://doi.org/10.1177/1086026620921453 doi: 10.1177/1086026620921453
|
| [47] |
Hamzah MI, Tanwir NS (2021) Do pro-environmental factors lead to purchase intention of hybrid vehicles? The moderating effects of environmental knowledge. J Clean Prod 279: 123643. https://doi.org/10.1016/j.jclepro.2020.123643 doi: 10.1016/j.jclepro.2020.123643
|
| [48] |
Lindenberg S (2001) Intrinsic motivation in a new light. Kyklos 54: 317–342. https://doi.org/10.1111/1467-6435.00156 doi: 10.1111/1467-6435.00156
|
| [49] | Chen L (2018) Study on the effect mechanism of green human resource management on employees' green behavior. Master's thesis, Shandong University. https://doi.org/10.7666/d.Y3408629 |
| [50] | Iizuka M (2016) Role of environmental awareness in achieving sustainable development. |
| [51] |
Moran CM, Diefendorff JM, Kim TY, et al. (2012) A profile approach to self-determination theory motivations at work. J Vocational Behav 81: 354–363. https://doi.org/10.1016/j.jvb.2012.09.002 doi: 10.1016/j.jvb.2012.09.002
|
| [52] | Eggen B, Van Mensvoort K (2009) Making sense of what is going on 'around': designing environmental awareness information displays. In: Markopoulos P, De Ruyter B, Mackay W (eds), Awareness Systems. Human-Computer Interaction Series. Springer, London. https://doi.org/10.1007/978-1-84882-477-5_4 |
| [53] |
Abbas J, Dogan E (2022) The impacts of organizational green culture and corporate social responsibility on employees' responsible behaviour towards the society. Environ Sci Pollut R 29: 60024–60034. https://doi.org/10.1007/s11356-022-20072-w doi: 10.1007/s11356-022-20072-w
|
| [54] | Roman K (2018) Analysis and evaluation of the implementation level of the smart city concept in selected polish cities. Brain-Broad Res Arti 9: 138–145. |
| [55] | Sun LY (2022) Research on performance evaluation of new smart city construction from the perspective of public perception. Master's thesis, Qingdao University of Technology. https://doi.org/10.27263/d.cnki.gqudc.2022.000502 |
| [56] | Yuan JL (2022) Evaluation of urban governance capacity in the context of smart cities. Master's thesis, Nanchang University. https://doi.org/10.27232/d.cnki.gnchu.2022.001397 |
| [57] | Tian JH (2022) Study on the mechanism of corporate environmental responsibility to sustainable competitive advantage. Doctoral dissertation, Jilin University. https://doi.org/10.27162/d.cnki.gjlin.2022.007544 |
| [58] | Zheng HD, Ge SM, Xu M, et al. (2021) The impact of corporate environmental responsibility perception on employees' green behavior: A moderated mediation model. In Proceedings of the 16th. China Annual Management Conference, 477–487. https://doi.org/10.26914/c.cnkihy.2021.055114 |
| [59] | Ding J (2022) Research on the influence mechanism of corporate environmental responsibility perception on employees' green behavior in the context of dual carbon. Master's thesis, Shanxi University of Finance and Economics. https://doi.org/10.27283/d.cnki.gsxcc.2022.000390 |
| [60] | Zhang BJ (2022) Research on the influence of employee green behavior on employee happiness. Master's thesis, Fuyang Normal University. https://doi.org/10.27846/d.cnki.gfysf.2022.000136 |
| [61] |
Wen ZL, Ye BJ (2014) Analyses of Mediating Effects: The Development of Methods and Models. Adv Psychol Sci 22: 731–745. https://doi.org/10.3724/SP.J.1042.2014.00731 doi: 10.3724/SP.J.1042.2014.00731
|

Figures(2) / Tables(6)

Yin Jun, Youling Li, Zijun Xin. The Impact of Employees' Perception of Smart Cities on Employee Green Behavior: A Moderated Mediation Model[J]. AIMS Geosciences, 2023, 9(4): 810-832. doi: 10.3934/geosci.2023044


 DownLoad: