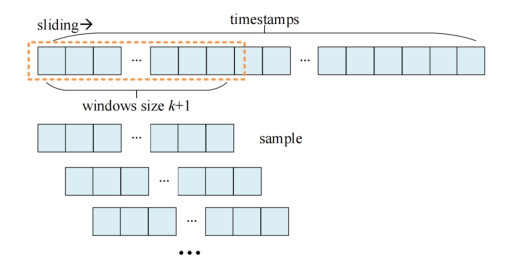
Predicting the future velocity of vehicles is essential for the safety of autonomous driving and the Intelligent Transport System. This study investigates how the surrounding vehicles influence a driving vehicle. Based on the HighD dataset, a scenario that considers the current lane and the neighboring lanes is selected while the drivers' visual angles and visual gap angles along with other parameters in the dataset are characterized as features. To predict the velocity of a driving vehicle and calibrate the influence of surrounding vehicles, a Transformer-based model integrating the features of multiple vehicles is proposed, and different features are added to the layers while constructing the model. Moreover, the information from previous timestamps of the vehicle state is integrated to estimate the duration of the influences, since the influence of an incident is not instantaneous. In our experiments, we find that the duration of the influence on the driving state perfectly fits the driver's reaction time when maneuvers occur in the surrounding vehicles. In addition, we further quantify the importance of the influence on the vehicle velocity prediction based on the Random Forest and obtain some practical conclusions, for instance, the velocity of a vehicle is more influenced by the front vehicle in the left lane than that in the right lane, but is still mainly influenced by the front vehicle in the current lane.
Citation: Mingxing Xu, Hongyi Lin, Yang Liu. A deep learning approach for vehicle velocity prediction considering the influence factors of multiple lanes[J]. Electronic Research Archive, 2023, 31(1): 401-420. doi: 10.3934/era.2023020
Predicting the future velocity of vehicles is essential for the safety of autonomous driving and the Intelligent Transport System. This study investigates how the surrounding vehicles influence a driving vehicle. Based on the HighD dataset, a scenario that considers the current lane and the neighboring lanes is selected while the drivers' visual angles and visual gap angles along with other parameters in the dataset are characterized as features. To predict the velocity of a driving vehicle and calibrate the influence of surrounding vehicles, a Transformer-based model integrating the features of multiple vehicles is proposed, and different features are added to the layers while constructing the model. Moreover, the information from previous timestamps of the vehicle state is integrated to estimate the duration of the influences, since the influence of an incident is not instantaneous. In our experiments, we find that the duration of the influence on the driving state perfectly fits the driver's reaction time when maneuvers occur in the surrounding vehicles. In addition, we further quantify the importance of the influence on the vehicle velocity prediction based on the Random Forest and obtain some practical conclusions, for instance, the velocity of a vehicle is more influenced by the front vehicle in the left lane than that in the right lane, but is still mainly influenced by the front vehicle in the current lane.

| [1] |
J. V. Brummelen, M. O'Brien, D. Gruyer, H. Najjaran, Autonomous vehicle perception: The technology of today and tomorrow, Transp. Res. Part C Emerging Technol., 89 (2018), 384–406. https://doi.org/10.1016/j.trc.2018.02.012 doi: 10.1016/j.trc.2018.02.012

|
| [2] |
K. F. Yuen, L. Cai, G. Qi, X. Wang, Factors influencing autonomous vehicle adoption: An application of the technology acceptance model and innovation diffusion theory, Technol. Anal. Strategic Manage., 33 (2021), 505–519. https://doi.org/10.1080/09537325.2020.1826423 doi: 10.1080/09537325.2020.1826423
|
| [3] |
A. Talebian, S. Mishra, Predicting the adoption of connected autonomous vehicles: A new approach based on the theory of diffusion of innovations, Transp. Res. Part C Emerging Technol., 95 (2018), 363–380. https://doi.org/10.1016/j.trc.2018.06.005 doi: 10.1016/j.trc.2018.06.005
|
| [4] |
T. Morita, S. Managi, Autonomous vehicles: Willingness to pay and the social dilemma, Transp. Res. Part C Emerging Technol., 119 (2020), 102748. https://doi.org/10.1016/j.trc.2020.102748 doi: 10.1016/j.trc.2020.102748
|
| [5] |
X. Xu, C. K. Fan, Autonomous vehicles, risk perceptions and insurance demand: An individual survey in China, Transp. Res. Part A Policy Pract., 124 (2019), 549–556. https://doi.org/10.1016/j.tra.2018.04.009 doi: 10.1016/j.tra.2018.04.009
|
| [6] |
T. Stoiber, I. Schubert, R. Hoerler, P. Burger, Will consumers prefer shared and pooled-use autonomous vehicles? A stated choice experiment with Swiss households, Transp. Res. Part D Transp. Environ., 71 (2019), 265–282. https://doi.org/10.1016/j.trd.2018.12.019 doi: 10.1016/j.trd.2018.12.019
|
| [7] |
J. D. Ortúzar, Future transportation: Sustainability, complexity and individualization of choices, Commun. Transp. Res., 1 (2021), 100010. https://doi.org/10.1016/j.commtr.2021.100010 doi: 10.1016/j.commtr.2021.100010
|
| [8] |
A. Vahidi, A. Sciarretta, Energy saving potentials of connected and automated vehicles, Transp. Res. Part C Emerging Technol., 95 (2018), 822–843. https://doi.org/10.1016/j.trc.2018.09.001 doi: 10.1016/j.trc.2018.09.001
|
| [9] |
K. M. Gurumurthy, K. M. Kockelman, Analyzing the dynamic ride-sharing potential for shared autonomous vehicle fleets using cellphone data from Orlando, Florida, Comput. Environ. Urban Syst., 71 (2018), 177–185. https://doi.org/10.1016/j.compenvurbsys.2018.05.008 doi: 10.1016/j.compenvurbsys.2018.05.008
|
| [10] |
M. A. Moore, P. S. Lavieri, F. F. Dias, C. R. Bhat, On investigating the potential effects of private autonomous vehicle use on home/work relocations and commute times, Transp. Res. Part C Emerging Technol., 110 (2020), 166–185. https://doi.org/10.1016/j.trc.2019.11.013 doi: 10.1016/j.trc.2019.11.013
|
| [11] |
Y. Xu, Z. Ye, C. Wang, Modeling commercial vehicle drivers' acceptance of advanced driving assistance system (ADAS), J. Intell. Connected Veh., 2021. https://doi.org/10.1108/JICV-07-2021-0011 doi: 10.1108/JICV-07-2021-0011
|
| [12] |
C. Lu, C. Liu, Ecological control strategy for cooperative autonomous vehicle in mixed traffic considering linear stability, J. Intell. Connected Veh., 2021. https://doi.org/10.1108/JICV-08-2021-0012 doi: 10.1108/JICV-08-2021-0012
|
| [13] |
W. Xue, R. Zheng, B. Yang, et al., An adaptive model predictive approach for automated vehicle control in fallback procedure based on virtual vehicle scheme, J. Intell. Connected Veh., 2 (2019), 67–77. https://doi.org/10.1108/JICV-06-2019-0007 doi: 10.1108/JICV-06-2019-0007
|
| [14] |
L. Lin, W. Li, H. Bi, L. Qin, Vehicle trajectory prediction using lstms with spatial-temporal attention mechanisms, IEEE Intell. Transp. Syst. Mag., 14 (2021), 197–208. https://doi.org/10.1109/MITS.2021.3049404 doi: 10.1109/MITS.2021.3049404
|
| [15] |
S. Rezaei, R. Sengupta, H. Krishnan, X. Guan, R. Bhatia, Tracking the position of neighboring vehicles using wireless communications, Transp. Res. Part C Emerging Technol., 18 (2010), 335–350. https://doi.org/10.1016/j.trc.2009.05.010 doi: 10.1016/j.trc.2009.05.010
|
| [16] | A. Gupta, J. Johnson, L. Fei-Fei, S. Savarese, A. Alahi, Social gan: Socially acceptable trajectories with generative adversarial networks, in Proceedings of the IEEE Conference on Computer Vision and Pattern Recognition, (2018), 2255–2264. https://doi.org/10.48550/arXiv.1803.10892 |
| [17] |
Q. Cheng, Z. Liu, Y. Lin, X. S. Zhou, An s-shaped three-parameter (S3) traffic stream model with consistent car following relationship, Transp. Res. Part B Methodol., 153 (2021), 246–271. https://doi.org/10.1016/j.trb.2021.09.004 doi: 10.1016/j.trb.2021.09.004
|
| [18] |
Q. Cheng, Z. Liu, J. Guo, X. Wu, R. Pendyala, B. Belezamo, et al., Estimating key traffic state parameters through parsimonious spatial queue models, Transp. Res. Part C Emerging Technol., 137 (2022), 103596. https://doi.org/10.1016/j.trc.2022.103596 doi: 10.1016/j.trc.2022.103596
|
| [19] |
X. S. Zhou, Q. Cheng, X. Wu, P. Li, B. Belezamo, J. Lu, et al., A meso-to-macro cross-resolution performance approach for connecting polynomial arrival queue model to volume-delay function with inflow demand-to-capacity ratio, Multimodal Transp., 1 (2022), 100017. https://doi.org/10.1016/j.multra.2022.100017 doi: 10.1016/j.multra.2022.100017
|
| [20] |
P. G. Gipps, A behavioural car-following model for computer simulation, Transp. Res. Part B Methodol., 15 (1981), 105–111. https://doi.org/10.1016/0191-2615(81)90037-0 doi: 10.1016/0191-2615(81)90037-0
|
| [21] |
A. Dabiri, B. Kulcsár, Incident indicators for freeway traffic flow models, Commun. Transp. Res., 2 (2022), 100060. https://doi.org/10.1016/j.commtr.2022.100060 doi: 10.1016/j.commtr.2022.100060
|
| [22] |
V. Punzo, B. Ciuffo, M. Montanino, Can results of car-following model calibration based on trajectory data be trusted?, Transp. Res. Rec., 2315 (2012), 11–24. https://doi.org/10.3141/2315-02 doi: 10.3141/2315-02
|
| [23] |
V. Papathanasopoulou, C. Antoniou, Towards data-driven car-following models, Transp. Res. Part C Emerging Technol., 55 (2015), 496–509. https://doi.org/10.1016/j.trc.2015.02.016 doi: 10.1016/j.trc.2015.02.016
|
| [24] |
T. B. Shahi, C. Xu, A. Neupane, W. Guo, Machine learning methods for precision agriculture with UAV imagery: a review, Electron. Res. Arch., 30 (2022), 4277–4317. https://doi.org/10.3934/era.2022218 doi: 10.3934/era.2022218
|
| [25] |
I. Ahmed, S. Din, G. Jeon, F. Piccialli, G. Fortino, Towards collaborative robotics in top view surveillance: A framework for multiple object tracking by detection using deep learning, IEEE/CAA J. Autom. Sin., 8 (2021), 1253–1270. https://doi.org/10.1109/JAS.2020.1003453 doi: 10.1109/JAS.2020.1003453
|
| [26] |
D. G. Hong, W. H. Han, C. H. Yim, Tapping stream tracking model using computer vision and deep learning to minimize slag carry-over in basic oxygen furnace, Electron. Res. Arch., 30 (2022), 4015–4037. https://doi.org/10.3934/era.2022204 doi: 10.3934/era.2022204
|
| [27] |
T. Lintonen, T. Räty, Self-learning of multivariate time series using perceptually important points, IEEE/CAA J. Autom. Sin., 6 (2019), 1318–1331. https://doi.org/10.1109/JAS.2019.1911777 doi: 10.1109/JAS.2019.1911777
|
| [28] |
Y. Liu, C. Lyu, Y. Zhang, Z. Liu, W. Yu, X. Qu, DeepTSP: Deep traffic state prediction model based on large-scale empirical data, Commun. Transp. Res., 1 (2021), 100012. https://doi.org/10.1016/j.commtr.2021.100012 doi: 10.1016/j.commtr.2021.100012
|
| [29] |
P. M. Kebria, A. Khosravi, S. M. Salaken, S. Nahavandi, Deep imitation learning for autonomous vehicles based on convolutional neural networks, IEEE/CAA J. Autom. Sin., 7 (2019), 82–95. https://doi.org/10.1109/JAS.2019.1911825 doi: 10.1109/JAS.2019.1911825
|
| [30] |
Y. Liu, F. Wu, C. Lyu, S. Li, J. Ye, X. Qu, Deep dispatching: A deep reinforcement learning approach for vehicle dispatching on online ride-hailing platform, Transp. Res. Part E Logist. Transp. Rev., 161 (2022), 102694. https://doi.org/10.1016/j.tre.2022.102694 doi: 10.1016/j.tre.2022.102694
|
| [31] |
S. Li, Y. Liu, X. Qu, Model controlled prediction: A reciprocal alternative of model predictive control, IEEE/CAA J. Autom. Sin., 9 (2022), 1107–1110. https://doi.org/10.1109/JAS.2022.105611 doi: 10.1109/JAS.2022.105611
|
| [32] |
H. Wang, W. Yi, Y. Liu, An innovative approach of determining the sample data size for machine learning models: a case study on health and safety management for infrastructure workers, Electron. Res. Arch., 30 (2022), 3452–3462. https://doi.org/10.3934/era.2022176 doi: 10.3934/era.2022176
|
| [33] |
F. C. Pereira, F. Rodrigues, M. Ben-Akiva, Using data from the web to predict public transport arrivals under special events scenarios, J. Intell. Transp. Syst., 19 (2015), 273–288. https://doi.org/10.1080/15472450.2013.868284 doi: 10.1080/15472450.2013.868284
|
| [34] |
Y. Liu, R. Jia, J. Ye, X. Qu, How machine learning informs ride-hailing services: A survey, Commun. Transp. Res., 2 (2022), 100075. https://doi.org/10.1016/j.commtr.2022.100075 doi: 10.1016/j.commtr.2022.100075
|
| [35] |
H. Wang, W. Yi, Y. Liu, An innovative approach of determining the sample data size for machine learning models: a case study on health and safety management for infrastructure workers, Electron. Res. Arch., 30 (2022), 3452–3462. https://doi.org/10.3934/era.2022176 doi: 10.3934/era.2022176
|
| [36] | B. D. Kim, C. M. Kang, J. Kim, S. H. Lee, C. C. Chung, J. W. Choi, Probabilistic vehicle trajectory prediction over occupancy grid map via recurrent neural network, in 2017 IEEE 20th International Conference on Intelligent Transportation Systems (ITSC), IEEE, (2017), 399–404. https://doi.org/10.1109/ITSC.2017.8317943 |
| [37] | F. Altché, A. L. Fortelle, An LSTM network for highway trajectory prediction, in 2017 IEEE 20th international conference on intelligent transportation systems (ITSC), IEEE, (2017), 353–359. https://doi.org/10.1109/ITSC.2017.8317913 |
| [38] |
S. Jin, D. Wang, C. Xu, Z. Huang, Staggered car-following induced by lateral separation effects in traffic flow, Phys. Lett. A, 376 (2012), 153–157. https://doi.org/10.1016/j.physleta.2011.11.005 doi: 10.1016/j.physleta.2011.11.005
|
| [39] | T. Gindele, S. Brechtel, R. Dillmann, A probabilistic model for estimating driver behaviors and vehicle trajectories in traffic environments, in 13th International IEEE Conference on Intelligent Transportation Systems, IEEE, (2010), 1625–1631. https://doi.org/10.1109/ITSC.2010.5625262 |
| [40] |
H. Li, J. Zhang, Z. Zhang, Z Huang, Active lane management for intelligent connected vehicles in weaving areas of urban expressway, J. Intell. Connected Veh., 2021. https://doi.org/10.1108/JICV-08-2020-0009 doi: 10.1108/JICV-08-2020-0009
|
| [41] |
L. Yue, M. Abdel-Aty, Z. Wang, Effects of connected and autonomous vehicle merging behavior on mainline human-driven vehicle, J. Intell. Connected Veh., 2021. https://doi.org/10.1108/JICV-08-2021-0013 doi: 10.1108/JICV-08-2021-0013
|
| [42] | A. Vaswani, N. Shazeer, N. Parmar, J. Uszkoreit, L. Jones, A. N. Gomez, et al., Attention is all you need, Adv. Neural Inf. Process. Syst., 30 (2017). |
| [43] | A. Zeyer, P. Bahar, K. Irie, R. Schlüter; H. Ney, A comparison of transformer and lstm encoder decoder models for asr, in 2019 IEEE Automatic Speech Recognition and Understanding Workshop (ASRU), IEEE, (2019), 8–15. https://doi.org/10.1109/ASRU46091.2019.9004025 |
| [44] | J. Devlin, M. W. Chang, K. Lee, K. Toutanova, BERT: Pre-training of deep bidirectional transformers for language understanding, preprint, arXiv: 1810.04805. https://doi.org/10.48550/arXiv.1810.04805 |
| [45] |
L. Zhao, Y. Song, C. Zhang, Y. Liu, P. Wang, T. Lin, et al., T-gcn: A temporal graph convolutional network for traffic prediction, IEEE Trans. Intell. Transp. Syst., 21 (2019), 3848–3858. https://doi.org/10.1109/TITS.2019.2935152 doi: 10.1109/TITS.2019.2935152
|
| [46] | S. J. Brunson, E. M. Kyle, N. C. Phamdo, G. R. Preziotti, Alert algorithm development program: NHTSA rear-end collision alert algorithm, (2002), No. HS-809526. |
| [47] |
Y. Liu, F. Wu, C. Lyu, X. Liu, Z. Liu, Behavior2vector: Embedding users' personalized travel behavior to vector, IEEE Trans. Intell. Transp. Syst., 23 (2021), 8346–8355. DOI:10.1109/TITS.2021.3078229 doi: 10.1109/TITS.2021.3078229
|


Figures(12) / Tables(7)
Mingxing Xu, Hongyi Lin, Yang Liu. A deep learning approach for vehicle velocity prediction considering the influence factors of multiple lanes[J]. Electronic Research Archive, 2023, 31(1): 401-420. doi: 10.3934/era.2023020


 DownLoad: