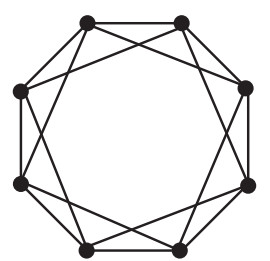
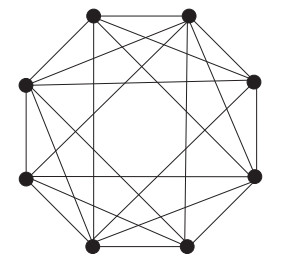
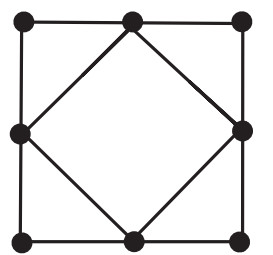
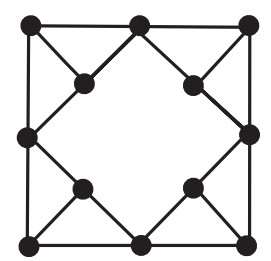
In this note, we approximate the von Neumann and Rényi entropies of high-dimensional graphs using the Euler-Maclaurin summation formula. The obtained estimations have a considerable degree of accuracy. The performed experiments suggest some entropy problems concerning graphs whose Laplacians are $ g $-circulant matrices, i.e., circulant matrices with $ g $-periodic diagonals, or quasi-Toeplitz matrices. Quasi means that in a Toeplitz matrix the first two elements in the main diagonal, and the last two, differ from the remaining diagonal entries by a perturbation.
Citation: Natália Bebiano, João da Providência, Wei-Ru Xu. Approximations for the von Neumann and Rényi entropies of graphs with circulant type Laplacians[J]. Electronic Research Archive, 2022, 30(5): 1864-1880. doi: 10.3934/era.2022094
In this note, we approximate the von Neumann and Rényi entropies of high-dimensional graphs using the Euler-Maclaurin summation formula. The obtained estimations have a considerable degree of accuracy. The performed experiments suggest some entropy problems concerning graphs whose Laplacians are $ g $-circulant matrices, i.e., circulant matrices with $ g $-periodic diagonals, or quasi-Toeplitz matrices. Quasi means that in a Toeplitz matrix the first two elements in the main diagonal, and the last two, differ from the remaining diagonal entries by a perturbation.

| [1] |
N. Bebiano, S. Furtado, J. da Providência, W. R. Xu, J. P. da Providência, Approximations for the von Neumann and Renyi entropies of graphs using the Euler-Maclaurin formula, Electron. Trans. Numer. Anal., 48 (2018), 227–242. https://doi.org/10.1553/etna_vol48s227 doi: 10.1553/etna_vol48s227

|
| [2] |
M. Dairyko, L. Hogben, J. C. H. Lin, J. Lockhart, D. Roberson, S. Severini, et al., Note on von Neumann and Rényi entropies of a graph, Linear Algebra Appl., 521 (2017), 240–253. https://doi.org/10.1016/j.laa.2017.01.037 doi: 10.1016/j.laa.2017.01.037
|
| [3] | V. Giovannetti, S. Severini, The Kirchhoff's matrix tree theorem revisited: counting spanning trees with the quantum relative entropy, preprint, arXiv: 1102.2398. https://doi.org/10.48550/arXiv.1102.2398 |
| [4] |
H. Lin, B. Zhou, On the von Neumann entropy of a graph, Discrete Appl. Math., 247 (2018), 448–455. https://doi.org/10.1016/j.dam.2018.04.004 doi: 10.1016/j.dam.2018.04.004
|
| [5] |
G. Minello, L. Rossi, A. Torsello, On the von Neumann entropy of graphs, J. Complex Networks, 7 (2019), 491–514. https://doi.org/10.1093/comnet/cny028 doi: 10.1093/comnet/cny028
|
| [6] |
D. E. Simmons, J. P. Coon, A. Datta, Symmetric Laplacians, quantum density matrices and their von Neumann entropy, Linear Algebra Appl., 521 (2017), 240–253. https://doi.org/10.1016/j.laa.2017.06.038 doi: 10.1016/j.laa.2017.06.038
|
| [7] |
D. E. Simmons, J. P. Coon, A. Datta, The von Neumann Theil index: characterizing graph centralization using the von Neumann index, J. Complex Networks, 6 (2018), 859–876. https://doi.org/10.1093/comnet/cnx061 doi: 10.1093/comnet/cnx061
|
| [8] |
C. Ye, R. C. Wilson, C. H. Comin, L. F. Costa, E. R. Hancock, Approximate von Neumann entropy for direct graphs, Phys. Rev. E, 89 (2014), 052804. https://doi.org/10.1103/PhysRevE.89.052804 doi: 10.1103/PhysRevE.89.052804
|
| [9] |
R. Grone, R. Merris, V. S. Sunder, The Laplacian spectrum of a graph, SIAM J. Matrix Anal. Appl., 11 (1990), 218–238. https://doi.org/10.1137/0611016 doi: 10.1137/0611016
|
| [10] | R. A. Horn, C. R. Johnson, Matrix Analysis, 2nd edition, Cambridge University Press, Cambridge, 2013. |
| [11] | J. V. Neumann, Mathematical Foundations of Quantum Mechanics, Number 2, Princeton University Press, Princeton, N.J., 1955. |
| [12] | L. D. Landau, E. M. Lifshitz, Statistical Physics, Pergamon Press, Oxford-Edinburgh-New York, 1969. |
| [13] | A. Rényi, On measures of entropy and information, in Proceedings of the Fourth Berkeley Symposium on Mathematical Statistics and Probability, Volume 1: Contributions to the Theory of Statistics, 4 (1961), 547–562. |
| [14] |
T. M. Apostol, An elementary view of Euler's summation formula, Amer. Math. Monthly, 106 (1999), 409–418. https://doi.org/10.1080/00029890.1999.12005063 doi: 10.1080/00029890.1999.12005063
|
| [15] |
V. Lampret, The Euler–Maclaurin and Taylor formulas: twin, elementary derivations, Math. Mag., 74 (2001), 109–122. https://doi.org/10.1080/0025570X.2001.11953046 doi: 10.1080/0025570X.2001.11953046
|
| [16] | V. Lampret, The Euler-Maclaurin Formula and Sums of Powers Revisited, Int. J. Contemp. Math. Sci., 5 (2010), 2401–2407. |
| [17] |
M. Z. Spivey, The Euler-Maclaurin formula and sums of powers, Math. Mag., 79 (2006), 61–65. https://doi.org/10.1080/0025570X.2006.11953378 doi: 10.1080/0025570X.2006.11953378
|
| [18] |
A. Greenbaum, R. C. Li, M. L. Overton, First-order perturbation theory for eigenvalues and eigenvectors, SIAM Rev., 62 (2020), 463–482. https://doi.org/10.1137/19M124784X doi: 10.1137/19M124784X
|

Figures(5) / Tables(1)
Natália Bebiano, João da Providência, Wei-Ru Xu. Approximations for the von Neumann and Rényi entropies of graphs with circulant type Laplacians[J]. Electronic Research Archive, 2022, 30(5): 1864-1880. doi: 10.3934/era.2022094


 DownLoad: