


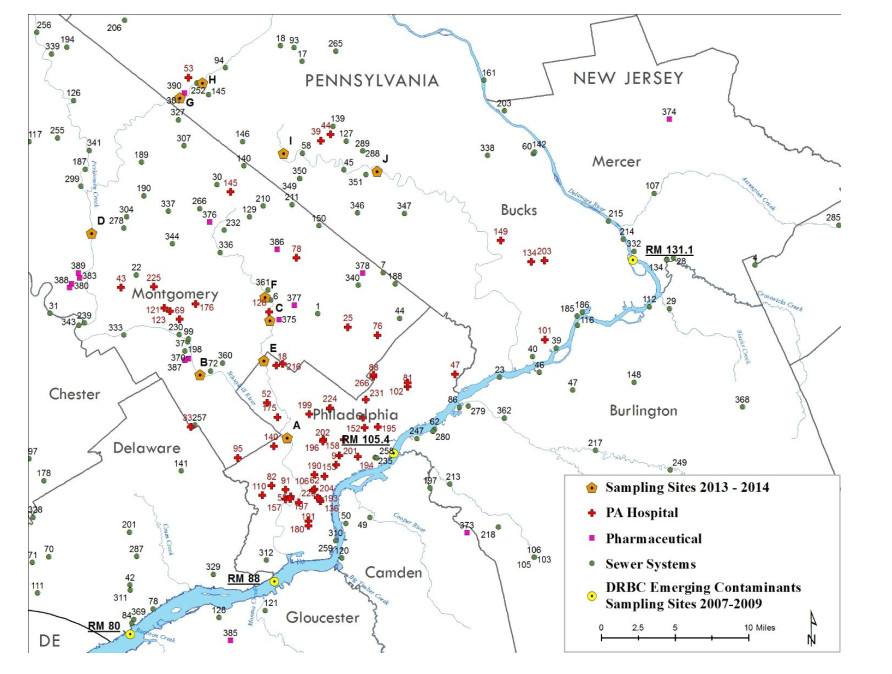
Figure 1.
Sampling sites with potential sources of PPCPs.
Citation: Majid Deldar, Afshin Izadian, Sohel Anwar. Analysis of a hydrostatic drive wind turbine for improved annual energy production[J]. AIMS Energy, 2018, 6(6): 908-925. doi: 10.3934/energy.2018.6.908
| [1] | Seif Bayoumi, Mohamed E.A. Ali, Islam Amin, Raneem El Torky, Selda Oterkus, Hosam Shawky, Erkan Oterkus . Environmentally-driven design of a floating desalination platform (Case study: reverse osmosis floating desalination platform of ras gharib, Egypt). AIMS Energy, 2021, 9(3): 623-650. doi: 10.3934/energy.2021030 |
| [2] | Abanda F.Henry, Nkeng G.Elambo, Tah J.H.M., Ohandja E.N.Fabrice, Manjia M.Blanche . Embodied Energy and CO2 Analyses of Mud-brick and Cement-block Houses. AIMS Energy, 2014, 2(1): 18-40. doi: 10.3934/energy.2014.1.18 |
| [3] | Sonia Longo, Maurizio Cellura, Francesco Guarino, Vincenzo La Rocca, Giuseppe Maniscalco, Massimo Morale . Embodied energy and environmental impacts of a biomass boiler: a life cycle approach. AIMS Energy, 2015, 3(2): 214-226. doi: 10.3934/energy.2015.2.214 |
| [4] | Hazrat Yousaf, Azka Amin, Waqar Ameer, Muhammad Akbar . Investigating the determinants of ecological and carbon footprints. Evidence from high-income countries. AIMS Energy, 2022, 10(4): 831-843. doi: 10.3934/energy.2022037 |
| [5] | Alex Borodin, Elena Streltsova, Zahid Mamedov, Irina Yakovenko, Irina Mityshina, Artem Streltsov . Fuzzy-Logical model for analysis of sustainable development of fuel and energy complex enterprises. AIMS Energy, 2023, 11(5): 974-990. doi: 10.3934/energy.2023046 |
| [6] | Armando L. Figueroa-Acevedo, Michael S. Czahor, David E. Jahn . A comparison of the technological, economic, public policy, and environmental factors of HVDC and HVAC interregional transmission. AIMS Energy, 2015, 3(1): 144-161. doi: 10.3934/energy.2015.1.144 |
| [7] | Debela Tadele, Poritosh Roy, Fantahun Defersha, Manjusri Misra, Amar K. Mohanty . Life Cycle Assessment of renewable filler material (biochar) produced from perennial grass (Miscanthus). AIMS Energy, 2019, 7(4): 430-440. doi: 10.3934/energy.2019.4.430 |
| [8] | Dimitrios Barkas, Anthoula Menti, Pavlos Pachos, Constantinos S. Psomopoulos . Experimental investigation of the impact of environmental parameters on the supraharmonic emissions of PV inverters. AIMS Energy, 2024, 12(4): 761-773. doi: 10.3934/energy.2024036 |
| [9] | Kokou Aménuvéla Toka, Yawovi Nougbléga, Komi Apélété Amou . Optimization of hybrid photovoltaic-thermal systems integrated into buildings: Impact of bi-fluid exchangers and filling gases on the thermal and electrical performances of solar cells. AIMS Energy, 2024, 12(5): 1075-1095. doi: 10.3934/energy.2024051 |
| [10] | Otto Andersen, Geoffrey Gilpin, Anders S.G. Andrae . Cradle-to-gate life cycle assessment of the dry etching step in the manufacturing of photovoltaic cells. AIMS Energy, 2014, 2(4): 410-423. doi: 10.3934/energy.2014.4.410 |
CECs are typically unregulated substances that entered the environment through anthropogenic activities [1,2,3,4]. Many CECs are used regularly and end up in the local watershed through different point sources such as the municipal wastewater treatment plants (WWTPs) [5]. Persistent or “pseudo-persistent” CECs are generally detected at high frequencies in the aquatic environment. Pseudo-persistent are defined as CECs that have high removal rates but are used in such large quantities by the population that leads to a significant concentration in the aquatic environment. Many such CECs are pharmaceuticals and personal care products (PPCPs).
Substantial research has been conducted on the occurrence of PPCPs in surface waters and they are frequently observed at concentration ranges of low to high nanogram per liters (ng/L) [2,3,6,7,8,9,10,11]. The conventional risk assessment, utilized by several studies and the European Environmental Agency, quantifies aquatic risk with a risk quotient (RQ) or relative risk (RR). RR is calculated by dividing the occurrence data or measured enviromental concentrations (MEC) by predicted no-effect concentration (PNEC) [12,13,14,15,16]. The aquatic environment is a highly variable mixture due to changes in type, mixture and concentrations of various contaminants that can affect different species at different developmental stages over an extended period of exposure. These conditions make the laboratory derived PNEC sometimes an unsuitable parameter for an accurate risk assessment. It may be argued that quantifying a hazard of a single compound in an aquatic environment may be practically impossible, especially when the primary concern is long-term and low-dose exposure. Daughton and Ternes (1999) observed that multigenerational exposure to PPCPs could result in unrecognized effects on the aquatic organisms. To address the lack of accuracy of conventional risk assessment approach, additional criteria such as levels of concern (LOC) may be considered. LOC is a qualitative assessment complimentary to RR and used for further examination of the availability and quality of MEC and PNEC data.
High population density increases the chances of PPCPs occurrence in a watershed, hence an urban watershed or basin would be a priority location [5]. Today 8.3 million people live in the area of the Delaware River basin, over 13.3 million people rely on it as drinking water and it is project that by 2030 the basin population will increase by 8% [18]. Delaware River Basin Commission (DRBC) conducted a multi-year survey of CECs in the main stem of the tidal Delaware River. DRBC sampled and analyzed surface waters in 2007, 2008 and 2009 where 54 compounds were detected at nanograms per liter concentrations [19]. The objective of this study was to examine the impacts of Pennsylvania tributaries to the main stem of the Delaware River and to assess the risk to a mixed use watershed from its contributing sources. Fifteen target compounds were selected for analysis based on frequency of usage and high frequency of detection from a multiyear study. Target compounds have published analytical methods therefore elimnating time consuming and expensive method development. The following compounds were investigated: carbamazepine, clarithromycin, dehydronifedipine, diltiazem, diphenhydramine, erythromycin, gemfibrozil, guanylurea, ibuprofen, metformin, ranitidine, sulfamethoxazole, thiabendazole, triclocarban and trimethoprim.
The following CECs (with purity) were purchased from Santa Cruz Biotechnology Inc (USA): dehydronifedipine (≥97%), ranitidine hydrochloride (≥95%), triclocarban-13c6 (≥98%), metformin-d6 hydrochloride (≥98%), gemfibrozil-d6 (≥98%), diphenhydramine-d6 hydrochloride (≥98%), triclocarban (≥98%), ranitidine-d6 (≥95%). Clarithromycin (≥98%), diphenhydramine hydrochloride (≥98%), gemfibrozil (≥98%), ibuprofen (≥98%), guanylurea (≥97%), thiabendazole (≥99%) and trimethoprim (≥98%) were purchased from Sigma Aldrich Inc. (USA). Sulfamethoxazole (≥98%) was purchased from Thomas Scientific (USA). Trimethoprim-d3 (≥98%), thiabendazole-d4 (≥98%), sulfamethoxazole-d4 (≥98%), erythromycin-13d3 (≥98%), dehydronifedipine-d6 (≥98%), and ethylenediaminetetraacetic acid tetrasodium salt dihydrate (EDTA) (99–102%) were purchased from United States Biological Corporation (USA). All solvents (HPLC grade) and other chemicals were obtained from Sigma-Aldrich Inc. (USA). Millipore nitrocellulose filters (0.45 μm) and 2.5 L amber glass bottles were obtained from Fisher Scientific (USA). Deionized water was produced by Barnstead NANOpure (Iowa, USA). Solid-phase extraction (SPE) was performed with Oasis Wax SPE columns 6 cc cartridges, 150 mg, 30 μg purchased from Waters Corporation (Milford, MA, USA).
Stock solutions were prepared by dissolving the analytes powder in methanol. Sample processing, extraction, and instrument optimization was performed according to the EPA method 1694 (USEPA 2007). Samples were filtered with 0.45 µm filters and separated into two 1 L media bottles for acid and base extracts. Acid extracts were pH adjusted to pH 2.0 ± 0.5 with hydrochloric acid and had 500 mg of tetrasodium-EDTA added to the solution. Base samples were pH adjusted to pH 10.0 ± 0.5 with ammonium hydroxide. SPE cartridges were conditioned with 20 mL of water, 20 mL of methanol and then again rinsed with 20 mL of water. After conditioning the cartridges were loaded with conditioned samples from media bottles. Cartridges were then washed with 10 mL of water and dried for 5 minutes. Acid samples were eluted with 12 mL of methanol and 6 mL of 1:1, acetone:methanol mixture. Base samples were eluted with 6 mL of methanol and 9 mL of 2 % formic acid in methanol. Eluted samples were dried on the Genevac EZ-2 vacuum evaporator (Pacific Laboratory Products, Melbourne, Australia). After drying, the samples were reconstituted with 3 mL of methanol and 1 mL of 0.1% formic. Working solutions and internal standard solutions were processed with the same procedure as the extracted field samples. The solutions were evaporated and then reconstituted with 3 mL of methanol and 1 mL of 0.1 % formic acid. Analysis was performed on an Acquity H-Class Xevo TQ Waters LC-MS/MS (Waters Corporation, Milford, MA). Compounds were analyzed in three different groups based on acidity and ion mode of the electrospray ionization (ESI). Group 1 and 2 were acidic extractions, where group 1 had positive and group 2 had a negative ESI mode. Chromatographic separation for group 1 and 2 was performed with a reversed-phase Waters Xterra C18, 10.0 cm, 2.1 mm i.d., 3.5 μm particle size column, Group 3 had basic extractions with positive ESI mode analysis. Chromatographic separations for group 3 were performed with a reversed-phase Waters Atlantis HILIC, 10 cm, 2.1 mm i.d., 3.0 μm particle size column. Multiple reaction monitoring (MRM) was used to detect and quantify the analytes. Table S1 in supplemental material lists the LC retention times and MRM parameters.
The locations of sampling sites were determined based on survey data of emerging contaminants in the surface waters of the Delaware River Basin conducted by MacGillivray (2013) and the identification of potential sources of CECs to surface water from municipal and industrial discharges listed in the National Pollutant Discharge Elimination System Permit Compliance System (NPDES/PCS) linked to pharmaceutical manufacturing Standard Industrial Classification (SIC) codes. Five tributaries of the Delaware River (East Branch of Perkiomen Creek, Perkiomen Creek, Wissahickon Creek, Schuylkill River, and Neshaminy Creek), located in southeast Pennsylvania within the Delaware River watershed, were selected for sampling because these streams receive numerous direct discharges from municipal wastewater treatment plants and pharmaceutical manufacturers. In addition, several hospitals and pharmaceutical facilities indirectly discharge through publicly owned treatment works (POTW) to these streams. There could be non-point sources of CECs as well. One sampling site was chosen because it had previously been sampled for PPCPs by the US Geological Survey (USGS). Nine other sampling sites were selected above and below discharge and at locations outside the immediate influence of the discharges and with convenient access for sampling. Based on the U.S. Census Bureau (2010), the sampling locations are located in areas classified as urban areas or urban clusters. Sample locations with potential sources are shown in Figure 1. Sampling sites were named with letters A through J. In some cases site names were used with prefix EC indicating emerging contaminants in order to distinguish them from the previous DRBC survey that utilized a prefix “RM” (river mile) followed by the distance in miles from the river mouth [19] Tables S2 and S3 (supplemental information).
Samples were collected in duplicates at low flow conditions during spring, summer, and fall seasons. The samples were collected from ten locations in Pennsylvania tributaries of the Delaware River. Subsurface ambient water was sampled into 2.5 L amber glass bottles for analysis. Field blanks were used during sampling. The samples were placed on ice in coolers to maintain a temperature of 4 ± 2 ℃ and transported to Temple University laboratory for analyses. In-field measurements of specific conductivity, water temperature, dissolved oxygen, turbidity, and pH were performed at all sites and are listed in Table S3 (supplemental information).
The compounds were selected from the list of compounds used by the DRBC (MacGillivray, 2013). Guanylurea was the only compound not on the DRBC list but was added due to being a commonly occurring metabolite of metformin, which has frequently been detected in high concentrations in surface waters [22,23,24]. Compound selection was further refined based on different therapeutic categories, such as anti-epileptic drugs, antibiotics, a non-steroidal anti-inflammatory, anti-diabetic, antihypertensives, antihistamine, lipid regulator, fungicide/parasiticide, antibacterials and included some of their metabolites and degradants. A complete list of analytes, with their therapeutic category, are listed in Table 1.
| Analyte | Therapeutic category | Description | |
| Carbamazepine | Anti-epileptic drugs | Prescription drug, anticonvulsant, mood-stabilizer, treatment of attention deficit hyperactivity disorder (ADHD) | |
| Clarithromycin | Antibiotic | Prescription drug, a macrolide antibiotic | |
| Dehydronifedipine | A metabolite of a nifedipine | An inactive metabolite of prescription cardiac drug nifedipine | |
| Diltiazem | Antihypertensive | Prescription drug, anticonvulsant, mood-stabilizer, treatment of ADHD | |
| Diphenhydramine | Antihistamine | Prescription and over-the-counter drug, an antihistamine used to treat allergies | |
| Erythromycin | Antibiotic | Prescription drug, a macrolide antibiotic | |
| Gemfibrozil | Lipid regulator | Prescription drug, lipid-lowering agent | |
| Guanylurea | Degradant of metformin | Metformin biodegradation | |
| Ibuprofen | Non-steroidal anti-inflammatory | Prescription and over-the-counter drug, a non-steroidal anti-inflammatory drug used for pain | |
| Metformin | Anti-diabetic | A prescription drug for diabetes treatment | |
| Ranitidine | Antihistamine | Prescription and over-the-counter drug for peptic ulcer and gastroesophageal reflux disease treatment | |
| Sulfamethoxazole | Antibiotic | Prescription drug, a bacteriostatic antibiotic frequently used in combination with trimethoprim | |
| Thiabendazole | Fungicide/ parasiticide | Prescription and veterinary drug as a parasiticide also used as an agricultural fungicide | |
| Triclocarban | Personal care product | Antibacterial, antifungal agent | |
| Trimethoprim | Antibacterial | Prescription drug, a bacteriostatic antibiotic frequently used in combination with sulfamethoxazole | |
 DownLoad:
CSV
DownLoad:
CSV
Comparing different drug categories and their observed concentrations, many of the compounds within the same therapeutic category fall in a similar concentration range. Analyzed sample data for the compounds of interest are listed in Table 2 with their detection frequency, concentration range, median concentration, maximum concentration, PNEC and RR. Antihistamines diphenhydramine and ranitidine both fall in the range of 0.1–106 ng/L with medians being 8.0 and 7.4 ng/L respectively. Antibiotics such as clarithromycin, erythromycin, sulfamethoxazole, and trimethoprim had a median concentration of 4.6, 7.5, 5.8, and 7.9 ng/L, respectively. Anti-diabetic drug metformin and its biodegradation product guanylurea stand out with the highest concentrations. Administered at a large average dose of 2 g/day and due to its high water solubility, metformin is frequently detected at what is considered very high environmental concentrations (micrograms per liter, µg/L) in urban watersheds [24,25]. WWTPs receive large amounts of metformin where it undergoes an incomplete degradation and transforms into guanylurea [26]. Table S4 in supplemental material includes additional occurrence data.
| Analyte | Number of analysis | Detection Frequency (%) | Concentration Range (ng/L) | Median concentration, (ng/L) | Maximum Concentration (ng/L) | PNEC, (ng/L) | RR |
| Triclocarban | 60 | 100 | 6.3–265 | 36.7 | 265 | 190a | 1.395 |
| Diphenhydramine | 60 | 88 | 0.6–101 | 8.0 | 101 | 100b | 1.010 |
| Carbamazepine | 60 | 97 | 2.3–243 | 80.6 | 243 | 500c | 0.486 |
| Erythromycin | 60 | 32 | 0.2–58 | 7.5 | 58 | 300d | 0.193 |
| Ibuprofen | 60 | 97 | 3.7–152 | 19.8 | 152 | 1000b | 0.152 |
| Clarithromycin | 60 | 92 | 0.1–16 | 4.6 | 16 | 120d | 0.133 |
| Sulfamethoxazole | 20 | 90 | 1.0–24 | 5.8 | 24 | 200b | 0.120 |
| Ranitidine | 58 | 91 | 0.1–106 | 7.6 | 106 | 6200e | 0.017 |
| Gemfibrozil | 60 | 95 | 0.2–93 | 7.4 | 93 | 7800f | 0.012 |
| Metformin | 50 | 100 | 933–9258 | 3563 | 9258 | 1030000b | 0.009 |
| Guanylurea | 39 | 85 | 2.9–620 | 45.7 | 620 | 160000g | 0.004 |
| Thiabendazole | 60 | 97 | 0.1–191 | 6.1 | 191 | 74000h | 0.003 |
| Diltiazem | 60 | 75 | 0.4–8.2 | 1.8 | 8.2 | 8200i | 0.001 |
| Trimethoprim | 60 | 88 | 0.1–63 | 7.9 | 63 | 120700i | 0.001 |
| Dehydronifedipine | 60 | 90 | 0.3–8.6 | 2.4 | 8.6 | 2899000h | 0.001 < |
| Notes: a[27]; b[28]; c[29]; d[30]; e[31]; f[32]; g[33]; h[34]; i[35]. | |||||||
DownLoad:
CSV
To assess the effects of CECs on aquatic organisms, the RR values were calculated using the ratio of the MEC to the PNEC (MEC/PNEC). A RR value greater than one indicates that the environmental concentration is above the no-effects concentration and is generally considered a cause of concern [36]. RR < 0.1 indicates minimal risk and the 1.0 > RR ≥ 0.1 indicates moderate concern. Calculation and assessment of the PNECs followed standard set by the European Chemical Agencies (ECHA) guidance on determination of aquatic toxicity [37]. The most sensitive species and toxicity endpoints were used with assessment factors (AF). For example, an AF of 1,000 was used if only acute data was available and an AF of 10 was used if chronic data for three trophic levels were available. Sufficient ecotoxicity data was not available for assessment using other approaches such as species sensitivity distribution estimates of PNECs or integration of river monitoring data in fate and transport models to estimate distribution and effects of CECs [38]. Listed in Table 2, two compounds had high, seven analytes had moderate and six had minimal RR concern.
Looking at the compounds with the highest RR, diphenhydramine and triclocarban had a RR of concern (>1.0). The PNEC for triclocarban was derived from a study by Tamura et al. 2013, where the lowest NOEC for Ceriodaphnia dubia was 1.9 µg/L. Using the ECHA guidelines and applying the assessment factor of 10, the derived PNEC was 190 ng/L. Triclocarban is widely used as a topical antiseptic and is a persistent pollutant [39]. Triclocarban concentrations in our study (tributary samples) were between 6.3 to 265 ng/L (Table 2). In samples from less urbanized main stem segments of the Delaware River conducted by MacGillivray 2013, triclocarban was below the estimated detection limit of 0.6 ng/L while it was measured between 3.7 to 10.7 ng/L in the upstream segments of the main stem. While being a persistent pollutant, the lack of detection downstream can be attributed to dilution coming from tributaries that do not have high urban impact. Triclocarban had been reported in concentrations of 19 to 1425 ng/L in other surface waters [40]. Triclocarban is a substance of concern in the Delaware River Basin. Risk reduction of triclocarban through regulation in the United States has been recommended and in 2016 the US Food and Drug Administration (FDA) banned the use of triclosan and triclocarban in over-the-counter antimicrobial soaps [41,42]. Despite being banned in antibacterial soaps, triclosan and triclocarban can still be found in high concentrations in products such as toothpaste, mouthwash, and soaps [43].
Examining the second most concerning RR from the list, diphenhydramine had MECs of 1.0 to 176.9 ng/L. The concentrations of diphenhydramine detected in some of our samples were higher than those found in other surface waters receiving municipal effluent where diphenhydramine has been reported in the range of 10 to 100 ng/L [44]. With a PNEC of 100 ng/L reported by the WET Center 2016, diphenhydramine had hazard quotients of (>1.0) in 10 out of 18 tributary sites in the first round of sampling, 1 out of 10 tributary sites in the second round of sampling, and less than (<0.1) for the third round of sampling. The first sampling round occurred early September and high MECs can be attributed to the high use of the antihistamine due to allergy season. The antihistamine diphenhydramine has poorly understood consequences on exposed aquatic organisms and the potential to accumulate in fish [45]. It is a substance of concern in the Delaware River Basin which needs further investigation.
Carbamazepine is not only widely used as anticonvulsant but has also been one of the most widely reported persistent environmental pollutant [14,46]. With the third highest RR of 0.486, categorized as medium risk. Carbamazepine’s persistence in the aquatic environment could have long term consequences and would require further investigation of the long term effects [35]. Ibuprofen was detected in the range of 3.7–152 ng/L with the RR of 0.152 (Table 2). Ibuprofen is a highly used pharmaceutical that shows continual presence in the surface waters and there is a need for secondary toxicity clarification.
Metformin is used in treatment of high blood sugar levels and has a high daily dose [47]. With vast and continued use coupled with high water solubility, metformin and its biodegrading guanylurea are frequently detected at high concentrations in surface waters [22,24]. Metformin was detected in concentrations over 9258 ng/L, guanylurea following the trend as a degradant and detected at peak concentrations of 620 ng/L. Low RRs are noted for both compounds due to their high PNECs. Like carbamezpine and ibuprofen, metformin and guanylurea are frequently detected in the aquatic environment. Their long-term presence raises concern of multigenerational exposure on aquatic species. This type of environmental impact will be difficult to assess and quantify and will require further research and monitoring.
Three antibiotics analyzed: clarithromycin, erythromycin and sulfamethoxazole had medium concern with RR (1.0 > RR > 0.1). Reported as a chronic water quality standard by Ecotox Centre Eawag-EPFL 2017, clarithromycin had the lowest PNEC of 120 ng/L of the three antibiotics. Isidori et al. 2005 found the three macrolides, based on their MECs in Europe, have the highest impact on the aquatic environment. Antibiotics in the environment can cause bacteria to develop resistance and have other affects such as disruption of natural food webs [50].
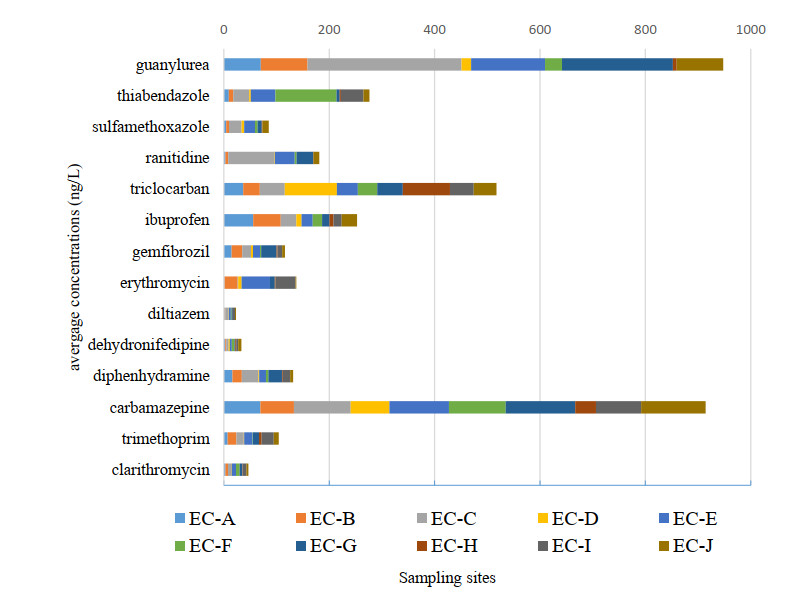
Due to seasonal and flow variations of the surface water samples, no major statistical analysis can be performed on grab samples. However, compound concentrations from different sampling events and sites can be examined with simple statistical evaluation such as the average, the median and relative standard deviation. Figure 2 shows the overall environmental loading of CECs by summing the average of all measured concentrations by site. No major concentration spikes indicate a uniform impact to the tributaries from a mixed use urban watershed. Metformin is not shown in Figure 2 because of its very high relative concentrations. Metformin, guanylurea, carbamazepine, triclocarban, thiabendazole and ibuprofen have the highest relative loading. Thiabendazole, ranitidine, triclocarban, guanylurea and ibuprofen show variable average concentrations by site. This could indicate the influence of intermittent point source contributions. Guanylurea, as a WWTP biodegradation product of metformin, is a useful indicator of relative WWTP effluent impacts to receiving waters although biodegradation of metformin would also occur in the streams [22]. Thiabendazole and ranitidine concentrations are highest in the Wissahickon Creek samples indicating potential localized point sources.
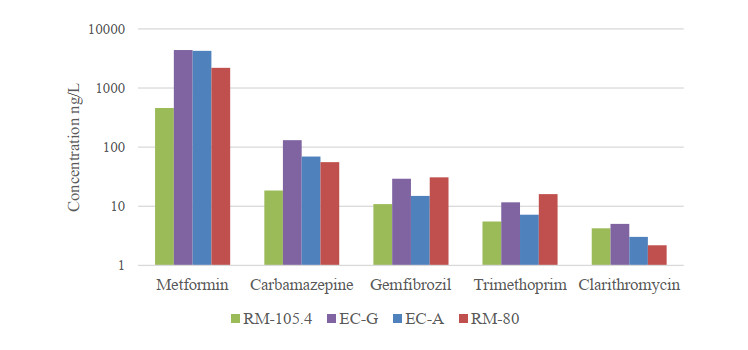
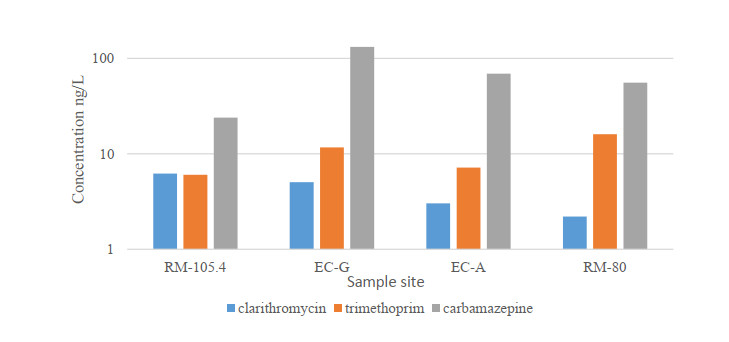
Distribution patterns and concentrations of compounds can be observed before and after the two rivers merge. Depicted in Figure 3. the compound fingerprint is shown in downstream sequence. EC-G is upstream from EC-A and both are located on the Schuylkill River before it enters the main stem of the Delaware River. RM-103.5 and RM-80 are sampling points before and after Schuylkill River enters the Delaware River, respectively [19]. Note that the sampling events in the MacGillivray (2013) study were conducted over a three year span. Data in Figure 3 indicates that the distribution of the compounds per river mile and impact of the tributaries to the Delaware River main stem is consistent. Figure 4 shows a downstream sequence of four selected compounds. Trimethoprim and carbamazepine are recognized as persistent compound and exhibit a similar pattern in the downstream sequence [51]. Clarithromycin does not exhibit the same persistence but is observed frequently in the aquatic environment [52]. Concentrations of PPCPs in the East Branch Perkiomen Creek (EC-G) and the Schuylkill River (EC-A) are generally higher than the concentrations of PPCPs in the both the upstream location of the Delaware River (RM-105.4) as well as the downstream location of the Delaware River (RM-80). The concentration of PPCPs also increases between Delaware River sample locations RM-105.4 and RM-80, upstream and downstream from Schuylkill River, respectively [19]. The much larger flow of the Delaware River and the concentration increase in the Delaware River is an indicator of a substantial mass input of PPCPs coming from the tributaries.
Complementary to the RR, levels of concern (LOCs) further evaluate the exposure and hazard data. LOCs have been used as an additional assessment for regulating pesticides in the environment [53]. If a compound is detected in high frequency, the probability of organism being exposed to it would be high. This is prevalent with compounds that are recalcitrant or show pseudo–persistence through high volume of use (large per capita use). Characteristics of aquatic effects are general ecotox data availability, effects for long term exposure and the taxonomy of organisms. Effects observed are considered in order of significance or longevity of the studies (from more to less important) and are: lifecycle, life stage, chronic (reproductive) and acute effects. To determine the most sensitive organism, all trophic levels should be examined. For example, a chronic exposure to three species from different trophic levels would be an adequate characterization. Inadequate characterization would consider only single species toxicity with less significant effects (example, only acute effects). Very little to no data availability is indicated as “lacking”. Exposure and hazard data listed previously was further examined. Exposure probability is determined on the detection frequency of the compound. Very high probability is assigned to a detection frequency of 100%, high to medium range of 80–99%, medium for 60–79%, and low for detection frequency of 59% or less. Based on the availability and comprehensiveness of the toxicity data along with the exposure probability, we interpreted LOCs as high (H), medium (M) or low (L). Listed in Table 3 are levels of concern for each analyte along with a brief description of the frequently occurring issues associated with the substance. As shown in Table 3, only one compound, triclocarban has high LOC. Ten compounds had medium LOC and they are clarithromycin, dehydronifedipine, diltiazem, diphenhydramine, erythromycin, gemfibrozil, guanylurea, ibuprofen, sulfamethoxazole and thiabendazole. Four had low LOC which are carbamazepine, metformin, ranitidine, and trimethoprim. The last row lists the issues associated with lack of toxicity data on the compound. Triclocarban is used as an antiseptic in a variety of products from soap bars, shampoos, and shaving creams. Due to its multiuse, triclocarban is frequently detected in surface waters [40]. High toxicity with a low PNEC and high detection frequency yield triclocarban as a compound of high LOC.
| Analyte | Exposure Probability | Aquatic Effects Characterization | Issues coming from or lack of literature data | LOC |
| Triclocarban | very high | adequate | Multiuse; high toxicity a | H |
| Ibuprofen | high | adequate | Lack of secondary toxicity data | M |
| Clarithromycin | high | adequate | Low water quality standard threshold (low PNEC) b | M |
| Diphenhydramine | high | adequate | High volume usage c | M |
| Erythromycin | low | adequate | Low water quality standard threshold b | M |
| Thiabendazole | high | adequate | Multiuse; toxic mode of action d | M |
| Gemfibrozil | high | inadequate | Chronic and more trophic level data required e | M |
| Sulfamethoxazole | high | adequate | Antibiotic resistance f | M |
| Guanylurea | high | lacking | Lack of effects data | M |
| Dehydronifedipine | high | lacking | Lack of effects data | M |
| Diltiazem | medium | inadequate | Lacks chronic data | M |
| Carbamazepine | high | adequate | Persistence g | L |
| Metformin | very high | adequate | Lack of chronic effect data | L |
| Ranitidine | high | adequate | Pseudo–persistence h | L |
| Trimethoprim | medium | adequate | Antibiotic resistance f | L |
| Note: a[28,60]; b[48]; c[61]; d[62,63]; e[32]; f[64,65]; g[4,66]; h[31] | ||||
DownLoad:
CSV
Multiple factors are expected to contribute to the future rise of pharmaceuticals in the environment, predominantly population and climate changes. With a larger and aging basin population, an increase use of prescription and over the counter pharmaceuticals is expected to increase the pharmaceuticals in the environment [54,55,56]. According to the State of the Basin 2019 report by DRBC, temperatures and precipitation in the Delaware River Basin appear to be increasing. The report further indicates anticipation of extreme weather events, such as tropical storms, flooding, short-duration dry periods and a sea level rise which will impact the salinity of the bay. Drought events will result in low flow that can lead to a greater concentration of PPCPs in surface waters [57]. This is prevalent for smaller rivers and tributaries where the flow is dominated by the WWTP discharge. The large flooding scenarios have the potential where WWTPs bypass the plant raw influent directly into the basin due to operational safety of the plant, thus increasing the amount of untreated PPCPs. Such events are not uncommon in the Greater Philadelphia area and the nearby city of Camden, NJ where plants can be overwhelmed by the flow coming from the combined sewer outfall (CSO) [58,59]. Considering these outcomes inevitably escalates the future concern of PPCPs in surface waters.
In regard to potential public health concerns for these compounds, all sites in the tributaries and two sites in the main stem of the Schuylkill River are within designated areas for use as public water supplies after reasonable treatment. All sites are within areas designated for fish ingestion and are used for recreational purposes [67,68]. Numerous studies have concluded that healthy adults are unlikely to be adversely affected at the levels of exposure currently reported for PPCP in water [69,70,71,72]. However, potential concerns have been identified for sensitive populations such as pregnant women and children from pharmaceutical contaminants in potable water [73]. Potential human health effects have also been incorporated in recent risk assessment and prioritization schemes with identified concerns including carcinogenicity, mutagenicity, reproductive and developmental effects, immunotoxicity, allergic reactions, microbial resistance to antibiotics and interactions among drugs when exposed to multiple contaminants [41,74,75,76,77]. Human health risk assessment methodologies differ from ecological assessments and may identify other pharmaceuticals from those prioritized in this article that may need consideration [75]. It is also important to note that the data presented in this report are from surface water that will receive additional treatment prior to use as drinking water.
Based on an index of concern ranking system applied to the sample locations by comparing measured environmental concentrations, existing target compound water quality criteria or predicted no effects levels we saw that the compounds such as ibuprofen, triclocarban and dehydronifedipine can be compounds of concern. By characterizing CECs concentration profiles by time and location, this study has expanded and advanced our understanding of the prevalence of emerging contaminants from different sources discharging into tributaries of the Delaware River watershed and complements previous studies on the occurrence of emerging contaminants in ambient waters of Pennsylvania. Obtaining this research data will facilitate and inform initiatives aimed at assessing the occurrence of these emerging contaminants in order to begin to determine their fate, transport and any potential adverse effect implications within the Delaware River watershed. This information may provide environmental managers and other members of the environmental community and stakeholders with increased awareness of the presence of emerging contaminants of concern in surface waters.
Funded by the PA SEA Grant, DRBC, NSF IUCRC WET Center and Temple University. The opinions expressed in this article are of the authors and do not necessarily reflect the views of the study sponsors.
All authors declare no conflicts of interest in this paper.
| [1] |
Izadian A, Girrens N, Khayyer P (2013) Renewable energy policies, A brief review of the latest U.S. and E.U. policies. IEEE Ind Electron Mag 7: 21–34. doi: 10.1109/MIE.2013.2269701

|
| [2] | Tegen S, Hand M, Maples B, et al. (2012) 2010 cost of wind energy review. No. NREL/TP-5000-52920. National Renewable Energy Lab. (NREL), Golden, CO, United States. |
| [3] | Sheng S (2013) Report on wind turbine subsystem reliability-a survey of various databases. NREL/PR-5000-59111. Golden, CO: National Renewable Energy Laboratory, Report. |
| [4] | Thul B, Dutta R, Stelson KA (2011) Hydrostatic transmission for mid-size wind turbines, In: Proceedings of 52nd National Conference on Fluid Power, Las Vegas, NV, Conference Proceedings. |
| [5] | Schmitz J, Vatheuer N, Murrenhoff H (2011) Hydrostatic drive train in wind energy plants. RWTH Aachen University, IFAS Aachen, Germany. |
| [6] | Dutta R, Wang F, Bohlmann BF, et al. (2014) Analysis of short-term energy storage for midsize hydrostatic wind turbine. J Dyn Syst Meas Control 136: 011007. |
| [7] | Merritt HE (1967) Hydraulic control systems. John Wiley & Sons. |
| [8] | Fitch EC (2004) Hydraulic component design and selection. Bardyne, Incorporated. |
| [9] | Manring N (2005) Hydraulic control systems. John Wiley and Sons Incorporated. |
| [10] | Bianchi FD, Battista HD, Mantz RJ (2006) Wind turbine control systems: Principles, modelling and gain scheduling design. Springer. |
| [11] | Bhadra SN, Kastha D, Banerjee S (2005) Wind electrical systems. Oxford University Press. |
| [12] | Burton T, Jenkins N, Sharpe D, et al. (2011) Wind energy handbook. John Wiley and Sons. |
| [13] |
Carrillo C, Montano AO, Cidras J, et al. (2013) Review of power curve modelling for wind turbines. Renew Sust Energ Rev 21: 572–581. doi: 10.1016/j.rser.2013.01.012
|
| [14] | Jonkman J, Butterfield S, Musial W, et al. (2009) Definition of a 5-MW reference wind turbine for offshore system development. CO: National Renewable Energy Laboratory Golden. |
| [15] | Manwell JF, Mcgowan JG, Rogers AL (2010) Wind energy explained: Theory, design and application. John Wiley & Sons. |
| [16] | Nielsen P, Sorsen T (2006) Windpro software user manual. Alborg, Denmark, EMD International AS, vol. 181. |
| [17] | Johnson GL (2006) Wind energy systems. Gary L. Johnson. |
| [18] | Mon´e C, Stehly T, Maples B, et al. (2015) 2014 cost of wind energy review. In: Lawrence Berkeley National Laboratory Paper LBNL-6A20-64281. |
| [19] | West M (2005) Microsoft Excel Wind Analysis Software Program: Instructions and Walkthrough. Available from: https://www.scribd.com/presentation/98726382/Excel-Wind-Analysis-Present. |
| [20] | Bryson AE (1975) Applied optimal control: Optimization, estimation and control. CRC Press. |
| [21] | Bertsekas DP (2005) Dynamic programming and optimal control. Athena scientific, vol. 1, no. 3. Belmont, MA. |
| [22] | Lewis FL, Syrmos VL (1995) Optimal control. John Wiley and Sons. |
| [23] | Deldar M (2016) Decentralized multivariable modeling and control of wind turbine with hydrostatic drivetrain. Dissertation, Purdue University. |
| [24] | Deldar M, Izadian A, Anwar S (2015) Reconfiguration of a wind turbine with hydrostatic drivetrain to maximize annual energy production. IEEE Energ Convers Congr Expo 2015: 6660–6666. |
| [25] | Available from: http://mstudioblackboard.tudelft.nl/duwind/Wind%20energy%20online%20 reader/Static_pages/Cp_lamda_curve.htm. |
| 1. | Anabela Botelho, Lígia M.C. Pinto, Lina Lourenço-Gomes, Marieta Valente, Sara Sousa, Social sustainability of renewable energy sources in electricity production: An application of the contingent valuation method, 2016, 26, 22106707, 429, 10.1016/j.scs.2016.05.011 | |
| 2. | Sara Sousa, Anabela Botelho, Lígia M. Costa Pinto, Marieta Valente, How Relevant Are Non-Use Values and Perceptions in Economic Valuations? The Case of Hydropower Plants, 2019, 12, 1996-1073, 2986, 10.3390/en12152986 | |
| 3. | Anabela Botelho, Paula Ferreira, Fátima Lima, Lígia M. Costa Pinto, Sara Sousa, Assessment of the environmental impacts associated with hydropower, 2017, 70, 13640321, 896, 10.1016/j.rser.2016.11.271 | |
| 4. | Anabela Botelho, Lina Lourenço-Gomes, Lígia M. Costa Pinto, Sara Sousa, Marieta Valente, Discrete-choice experiments valuing local environmental impacts of renewables: two approaches to a case study in Portugal, 2018, 20, 1387-585X, 145, 10.1007/s10668-018-0169-0 | |
| 5. | Andréia de C. Santos, Débora L. R. do Carmo, Tarik G. D. Plaza, Bruno A. Arrua, Vivian A. F. Nacagawa, Rafaela A. M. Fernades, Felipe T. N. Pontes, Danilo B. Ribeiro, Active Sampling and Understory Traps Can Cost-Effectively Detect Changes in Butterfly Communities after Hydroelectric Dam Construction, 2022, 14, 1424-2818, 873, 10.3390/d14100873 | |
| 6. | Terese E. Venus, Johannes Sauer, Certainty pays off: The public's value of environmental monitoring, 2022, 191, 09218009, 107220, 10.1016/j.ecolecon.2021.107220 | |
| 7. | Daniel Hernandez, Pascal da Costa, The economic value of ecosystem conservation: a discrete-choice experiment at the Taravo Wild River in Corsica, France, 2022, 1961-9502, 16, 10.1051/kmae/2022008 | |
| 8. | Enni Ruokamo, Artti Juutinen, Faisal Bin Ashraf, Ali Torabi Haghighi, Seppo Hellsten, Hannu Huuki, Santtu Karhinen, Maria Kopsakangas-Savolainen, Hannu Marttila, Eva Pongracz, Atso Romakkaniemi, Jan E. Vermaat, Estimating the economic value of hydropeaking externalities in regulated rivers, 2024, 353, 03062619, 122055, 10.1016/j.apenergy.2023.122055 | |
| 9. | Sumit Rawat, Bishnu Kant Shukla, Parveen Sihag, Yuvraj Srivastav, Hans Kumar Singh, 2024, 3050, 0094-243X, 040008, 10.1063/5.0193662 |

Figures(16) / Tables(3)

Majid Deldar, Afshin Izadian, Sohel Anwar. Analysis of a hydrostatic drive wind turbine for improved annual energy production[J]. AIMS Energy, 2018, 6(6): 908-925. doi: 10.3934/energy.2018.6.908

| Analyte | Therapeutic category | Description | |
| Carbamazepine | Anti-epileptic drugs | Prescription drug, anticonvulsant, mood-stabilizer, treatment of attention deficit hyperactivity disorder (ADHD) | |
| Clarithromycin | Antibiotic | Prescription drug, a macrolide antibiotic | |
| Dehydronifedipine | A metabolite of a nifedipine | An inactive metabolite of prescription cardiac drug nifedipine | |
| Diltiazem | Antihypertensive | Prescription drug, anticonvulsant, mood-stabilizer, treatment of ADHD | |
| Diphenhydramine | Antihistamine | Prescription and over-the-counter drug, an antihistamine used to treat allergies | |
| Erythromycin | Antibiotic | Prescription drug, a macrolide antibiotic | |
| Gemfibrozil | Lipid regulator | Prescription drug, lipid-lowering agent | |
| Guanylurea | Degradant of metformin | Metformin biodegradation | |
| Ibuprofen | Non-steroidal anti-inflammatory | Prescription and over-the-counter drug, a non-steroidal anti-inflammatory drug used for pain | |
| Metformin | Anti-diabetic | A prescription drug for diabetes treatment | |
| Ranitidine | Antihistamine | Prescription and over-the-counter drug for peptic ulcer and gastroesophageal reflux disease treatment | |
| Sulfamethoxazole | Antibiotic | Prescription drug, a bacteriostatic antibiotic frequently used in combination with trimethoprim | |
| Thiabendazole | Fungicide/ parasiticide | Prescription and veterinary drug as a parasiticide also used as an agricultural fungicide | |
| Triclocarban | Personal care product | Antibacterial, antifungal agent | |
| Trimethoprim | Antibacterial | Prescription drug, a bacteriostatic antibiotic frequently used in combination with sulfamethoxazole | |
DownLoad:
CSV
| Analyte | Number of analysis | Detection Frequency (%) | Concentration Range (ng/L) | Median concentration, (ng/L) | Maximum Concentration (ng/L) | PNEC, (ng/L) | RR |
| Triclocarban | 60 | 100 | 6.3–265 | 36.7 | 265 | 190a | 1.395 |
| Diphenhydramine | 60 | 88 | 0.6–101 | 8.0 | 101 | 100b | 1.010 |
| Carbamazepine | 60 | 97 | 2.3–243 | 80.6 | 243 | 500c | 0.486 |
| Erythromycin | 60 | 32 | 0.2–58 | 7.5 | 58 | 300d | 0.193 |
| Ibuprofen | 60 | 97 | 3.7–152 | 19.8 | 152 | 1000b | 0.152 |
| Clarithromycin | 60 | 92 | 0.1–16 | 4.6 | 16 | 120d | 0.133 |
| Sulfamethoxazole | 20 | 90 | 1.0–24 | 5.8 | 24 | 200b | 0.120 |
| Ranitidine | 58 | 91 | 0.1–106 | 7.6 | 106 | 6200e | 0.017 |
| Gemfibrozil | 60 | 95 | 0.2–93 | 7.4 | 93 | 7800f | 0.012 |
| Metformin | 50 | 100 | 933–9258 | 3563 | 9258 | 1030000b | 0.009 |
| Guanylurea | 39 | 85 | 2.9–620 | 45.7 | 620 | 160000g | 0.004 |
| Thiabendazole | 60 | 97 | 0.1–191 | 6.1 | 191 | 74000h | 0.003 |
| Diltiazem | 60 | 75 | 0.4–8.2 | 1.8 | 8.2 | 8200i | 0.001 |
| Trimethoprim | 60 | 88 | 0.1–63 | 7.9 | 63 | 120700i | 0.001 |
| Dehydronifedipine | 60 | 90 | 0.3–8.6 | 2.4 | 8.6 | 2899000h | 0.001 < |
| Notes: a[27]; b[28]; c[29]; d[30]; e[31]; f[32]; g[33]; h[34]; i[35]. | |||||||
DownLoad:
CSV
| Analyte | Exposure Probability | Aquatic Effects Characterization | Issues coming from or lack of literature data | LOC |
| Triclocarban | very high | adequate | Multiuse; high toxicity a | H |
| Ibuprofen | high | adequate | Lack of secondary toxicity data | M |
| Clarithromycin | high | adequate | Low water quality standard threshold (low PNEC) b | M |
| Diphenhydramine | high | adequate | High volume usage c | M |
| Erythromycin | low | adequate | Low water quality standard threshold b | M |
| Thiabendazole | high | adequate | Multiuse; toxic mode of action d | M |
| Gemfibrozil | high | inadequate | Chronic and more trophic level data required e | M |
| Sulfamethoxazole | high | adequate | Antibiotic resistance f | M |
| Guanylurea | high | lacking | Lack of effects data | M |
| Dehydronifedipine | high | lacking | Lack of effects data | M |
| Diltiazem | medium | inadequate | Lacks chronic data | M |
| Carbamazepine | high | adequate | Persistence g | L |
| Metformin | very high | adequate | Lack of chronic effect data | L |
| Ranitidine | high | adequate | Pseudo–persistence h | L |
| Trimethoprim | medium | adequate | Antibiotic resistance f | L |
| Note: a[28,60]; b[48]; c[61]; d[62,63]; e[32]; f[64,65]; g[4,66]; h[31] | ||||
DownLoad:
CSV
| Analyte | Therapeutic category | Description | |
| Carbamazepine | Anti-epileptic drugs | Prescription drug, anticonvulsant, mood-stabilizer, treatment of attention deficit hyperactivity disorder (ADHD) | |
| Clarithromycin | Antibiotic | Prescription drug, a macrolide antibiotic | |
| Dehydronifedipine | A metabolite of a nifedipine | An inactive metabolite of prescription cardiac drug nifedipine | |
| Diltiazem | Antihypertensive | Prescription drug, anticonvulsant, mood-stabilizer, treatment of ADHD | |
| Diphenhydramine | Antihistamine | Prescription and over-the-counter drug, an antihistamine used to treat allergies | |
| Erythromycin | Antibiotic | Prescription drug, a macrolide antibiotic | |
| Gemfibrozil | Lipid regulator | Prescription drug, lipid-lowering agent | |
| Guanylurea | Degradant of metformin | Metformin biodegradation | |
| Ibuprofen | Non-steroidal anti-inflammatory | Prescription and over-the-counter drug, a non-steroidal anti-inflammatory drug used for pain | |
| Metformin | Anti-diabetic | A prescription drug for diabetes treatment | |
| Ranitidine | Antihistamine | Prescription and over-the-counter drug for peptic ulcer and gastroesophageal reflux disease treatment | |
| Sulfamethoxazole | Antibiotic | Prescription drug, a bacteriostatic antibiotic frequently used in combination with trimethoprim | |
| Thiabendazole | Fungicide/ parasiticide | Prescription and veterinary drug as a parasiticide also used as an agricultural fungicide | |
| Triclocarban | Personal care product | Antibacterial, antifungal agent | |
| Trimethoprim | Antibacterial | Prescription drug, a bacteriostatic antibiotic frequently used in combination with sulfamethoxazole | |
| Analyte | Number of analysis | Detection Frequency (%) | Concentration Range (ng/L) | Median concentration, (ng/L) | Maximum Concentration (ng/L) | PNEC, (ng/L) | RR |
| Triclocarban | 60 | 100 | 6.3–265 | 36.7 | 265 | 190a | 1.395 |
| Diphenhydramine | 60 | 88 | 0.6–101 | 8.0 | 101 | 100b | 1.010 |
| Carbamazepine | 60 | 97 | 2.3–243 | 80.6 | 243 | 500c | 0.486 |
| Erythromycin | 60 | 32 | 0.2–58 | 7.5 | 58 | 300d | 0.193 |
| Ibuprofen | 60 | 97 | 3.7–152 | 19.8 | 152 | 1000b | 0.152 |
| Clarithromycin | 60 | 92 | 0.1–16 | 4.6 | 16 | 120d | 0.133 |
| Sulfamethoxazole | 20 | 90 | 1.0–24 | 5.8 | 24 | 200b | 0.120 |
| Ranitidine | 58 | 91 | 0.1–106 | 7.6 | 106 | 6200e | 0.017 |
| Gemfibrozil | 60 | 95 | 0.2–93 | 7.4 | 93 | 7800f | 0.012 |
| Metformin | 50 | 100 | 933–9258 | 3563 | 9258 | 1030000b | 0.009 |
| Guanylurea | 39 | 85 | 2.9–620 | 45.7 | 620 | 160000g | 0.004 |
| Thiabendazole | 60 | 97 | 0.1–191 | 6.1 | 191 | 74000h | 0.003 |
| Diltiazem | 60 | 75 | 0.4–8.2 | 1.8 | 8.2 | 8200i | 0.001 |
| Trimethoprim | 60 | 88 | 0.1–63 | 7.9 | 63 | 120700i | 0.001 |
| Dehydronifedipine | 60 | 90 | 0.3–8.6 | 2.4 | 8.6 | 2899000h | 0.001 < |
| Notes: a[27]; b[28]; c[29]; d[30]; e[31]; f[32]; g[33]; h[34]; i[35]. | |||||||
| Analyte | Exposure Probability | Aquatic Effects Characterization | Issues coming from or lack of literature data | LOC |
| Triclocarban | very high | adequate | Multiuse; high toxicity a | H |
| Ibuprofen | high | adequate | Lack of secondary toxicity data | M |
| Clarithromycin | high | adequate | Low water quality standard threshold (low PNEC) b | M |
| Diphenhydramine | high | adequate | High volume usage c | M |
| Erythromycin | low | adequate | Low water quality standard threshold b | M |
| Thiabendazole | high | adequate | Multiuse; toxic mode of action d | M |
| Gemfibrozil | high | inadequate | Chronic and more trophic level data required e | M |
| Sulfamethoxazole | high | adequate | Antibiotic resistance f | M |
| Guanylurea | high | lacking | Lack of effects data | M |
| Dehydronifedipine | high | lacking | Lack of effects data | M |
| Diltiazem | medium | inadequate | Lacks chronic data | M |
| Carbamazepine | high | adequate | Persistence g | L |
| Metformin | very high | adequate | Lack of chronic effect data | L |
| Ranitidine | high | adequate | Pseudo–persistence h | L |
| Trimethoprim | medium | adequate | Antibiotic resistance f | L |
| Note: a[28,60]; b[48]; c[61]; d[62,63]; e[32]; f[64,65]; g[4,66]; h[31] | ||||
