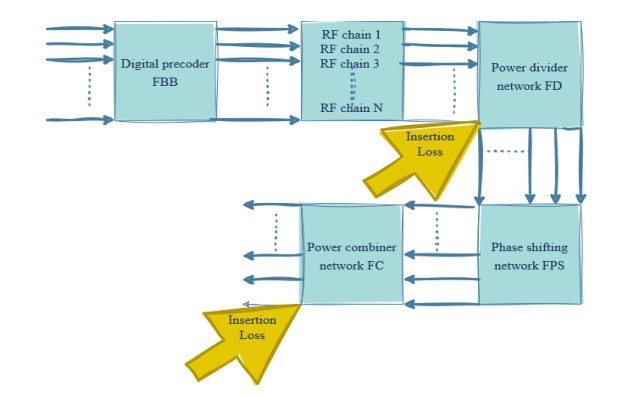
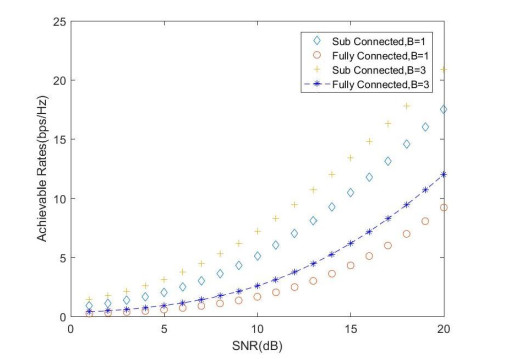
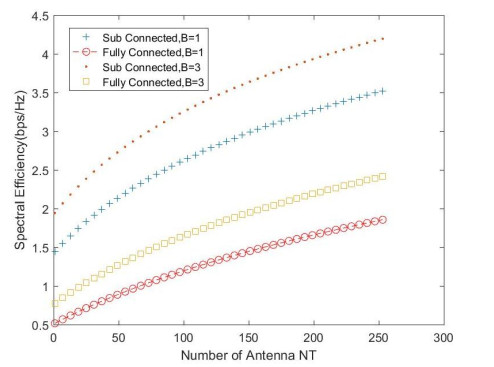
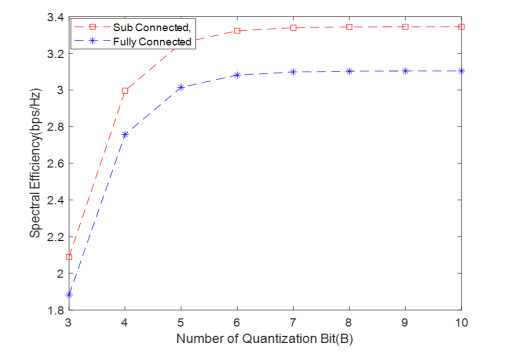
1.
Introduction
Tequila is an alcoholic beverage obtained from Agave tequilana Weber blue variety; its production is protected under a well-established region in Mexico by the Official Mexican Norm for Tequila [1]. The production process of Tequila features five stages: cooking, grinding, fermentation, distillation and aging or resting [2]. Usually, research about Tequila production is focused in each stage of the process, and also in how to increase the Tequila's yield and quality. Therefore, fast analytical techniques have been developed to ensure the authenticity and quality of Tequila to satisfy the Mexican regulation [3]. Commercial regulations enforce that the maximal permissible concentration of higher alcohols must be 500 mg per 100 ml of anhydrous alcohol. In addition, Tequila aroma is strongly related to these higher alcohols and volatile compounds. Among the 200 volatile compounds, only a few are essential in the quality and bouquet of Tequila [4]. Therefore, the milestone stage for the process of Tequila production relies in the fermentation stage; in this stage the sugars (principally fructose) are metabolized into ethanol, carbon dioxide (CO2), and also into a wide variety of secondary products such as the volatile compounds which are very important in the bouquet of the liquor of Tequila [5]. The composition of Tequila can be affected by a wide range of factors from which the fermented most and the yeast metabolism are the most important. For the production of higher alcohols, the composition of Tequila liquor can be affected by the nitrogen source (amount and type) and how the yeast will metabolize it [5,6,7].
Saccharomyces cerevisiae is a versatile microorganism commonly used to ferment agave juice in the production of Tequila and also employed in many different industrial applications. This microorganism has been investigated in metabolic studies which elucidate its gene functions, integration, and metabolism [8]. Moreover, key research areas are focused in the fermentation process by using novel strains such as Saccharomyces and non-Saccharomyces [9,10].
Genomic Scale Models (GSM) are used to estimate the metabolic fluxes distribution; these models contain a wide collection of stoichiometrically-branded biochemical reactions related to enzymes in the cell/tissue [11]. Applications of GSM go from topological networks analyses, phenotype behaviors until the simulation of metabolism under certain metabolic engineering strategies [8]. Thus, over 100 GSMs have been developed for a wide variety of microorganisms such as bacteria, eukaryotes and archea i.e., Haemophilus influenzae, Escherichia coli, Saccharomyces cerevisiae, Helicobacter pylori, Staphyloccocus aureus, Bacillus subtilis, Homo sapiens, Pseudomona aeruginosa and for the genus Synechocystis, among others [12,13,14]. By taking advantage of the capabilities described in the literature, it is possible to test novel hypotheses on metabolic functions for a set of organisms-of-interest [14].
In the last decade, GSMs for Saccharomyces cerevisiae have been reported, such as the models iFF708, iND750, iLL672, iIN800, iMM904, iTO977 and Yeast 6 [13,15,16,17,18,19,20]. These models have been developed gradually by adding open reading frames (ORF) reactions and compartments. The first version of the model iFF708 includes 708 ORF with 1175 biochemical reactions and 3 compartments. In contrast, the last version, Yeast 6, contains 900 ORF with 1888 biochemical reactions and 15 compartments [8]. As mentioned before, there are already models which their number in biochemical reactions is around one thousand, however, using these models in practical applications represents a challenge due to their complexity. Moreover, computational algorithms for FBA have been commonly used in different strain models [12,21]. The metabolic phenotype of the microorganism is usually analyzed based on the flux distributions in the metabolic network, for example, for S. cerevisiae, it was found that the global cellular functions under aerobic and anaerobic culture were consistent with the experimental data [22]. Pereira et. al. (2016) selected four GSMs to analyze S. cerevisiae; iFF708; IMM904; iTO977 and Yeast 6, however, a comparison among these models was performed in order to find the best approximation with regard to experimental fluxes in vivo resulting that iFF708 showed the best approximation in terms of the metabolic flux distribution for the central metabolism. To analyze the GSM, FBA is used to estimate the flux distribution in the metabolic network. This tool has demonstrated to be a key alternative to foresee the metabolic-networks capabilities especially when there is a scarcity of kinetic parameters [23,24]. However, for practical applications it is helpful to have more simple models that can help in the development of a robust control system for alcoholic fermentation. To our understand, there is no information available with regard to the metabolic flux estimation for S. cerevisiae in the flux distribution of higher alcohols in Tequila production which, traditionally, it is performed using a batch process. Usually, studies in this area focus on the fermentative capabilities of the microorganism and the yields of the synthesis of volatiles compounds [3,5,7,9,10,25,26].
Therefore, in this research a GSM is reconstructed and validated comparing FBA results with experimental data for the continuous fermentation process of Tequila [5,22] using Saccharomyces cerevisiae. This model is tested under aerobic and anaerobic conditions considering the central metabolism which features the catabolic and anabolic biochemical reactions involved in the synthesis of higher alcohols.
2.
Materials and methods: mathematical developments
2.1. Flux balance analysis, FBA
FBA is a methodology used to analyze GSM applying thermodynamic restrictions as well as network and transport capabilities [21,27]. The distribution of metabolic fluxes is found by optimizing an objective function which in the present research is the microorganism growth (μ) [1/s]. In addition, an optimal flux distribution is calculated using a linear programming technique under steady state conditions. According to the the optimal flux distributions under the set of considerations or restrictions, it is possible to generate a quantitative hypothesis in silico which can be tested experimentally [21].
2.1.1. Mathematical representation
According to the biochemical information, the mathematical representation of the GSM is obtained from a mass balance for each metabolite in the biological system and it is depicted as a matrix as shown in Eq (2.1)
where, x [mmol/g D.W.] is the concentration vector of all metabolites considered in the metabolic network, S is the stoichiometric matrix and v [mmol/g D.W. h−1] is the internal flux vector and the whole exchange fluxes considered between the organism and the culture medium. By considering steady-state, the above equation becomes
The system is solved by applying a linear programming technique that maximizes the microorganism growth function which has been experimentally corroborated [21]. The growth function z(xm) is defined by the microorganism biomass as shown by Eq (2.3)
where dm represents each metabolite proportion and xm is the metabolite in the biomass composition.
Applying thermodynamic restrictions as well as the whole interchange fluxes related to the transport capabilities as shown in Eqs (2.4) and (2.5), the flux distribution is obtained
where α and β represent the thermodynamic limits, low and superior, respectively, for each biochemical reaction of the GSM. Furthermore, bj is the estimated value by the FBA or a real value which could be specified as a restriction in the optimization problem.
2.1.2. Reconstruction of the genomic scale model
The reconstructed stoichiometric model took advantage of other models reported in the literature to analyze the metabolism of S. cerevisiae [8,22,28,29,30,31], and it is reported in Appendix A. The model considers the central metabolism for glycolysis (reactions 1-8), the pentose phosphate pathway (reactions 17-22), and the Krebs cycle (reactions 23-31), as well as the fermentative paths for acetate, glycerol and ethanol production (reactions 9-12, 15 and 16), under anaerobic conditions. For the metabolic production of acetate and ethanol, other two key reactions 13 and 14 are included. Therefore, the aim of our GSM model is that it can be used in practical applications as the Tequila production. Usually, there are simplified models which can be aerobic or anaerobic even though they do not include the metabolic and anabolic pathways related with the synthesis of characteristic volatile compounds like the higher alcohols in Tequila production. Therefore, this last characteristic as well as the small number of biochemical reactions to the complex process-production of Tequila are the main features with respect to other models that justify why the GSM is reconstructed. Additionally, our GSM model includes the catabolic pathway which is also called Erlych's pathway and the anabolic pathway that is result of the metabolization of amino acids like Val, Leu, Ileu, Thre and Phe.
2.1.3. Growth objective function
The objective function is defined as the biomass composition and it is considered in the biochemical reaction 65 (flux) for the macromolecules composition such as proteins, carbohydrates, lipids, deoxyribonucleic acid (DNA), and ribonucleic acid (RNA) using the cited values by Nissen et al. (1997) [30]. Under continuous culture fermentation, the cellular biomass composition varies according to the rate dilution (D) [h−1]. The main variation in biomass composition is found in proteins and RNA that increases linearly as a function of D and carbohydrates (see Table S1). In this research, the biomass composition at D = 0.1 h−1 was taken from the literature [30]. The model encompasses both the aerobic and anaerobic conditions where reactions 12, 14, 16, 26 and 33 take place in aerobic conditions while 13, 15 and 27 happen in anaerobic conditions. In order to synthesize different macromolecules present in S. cerevisiae, the polymerization energy reported by Stephanopolous (1998) [29] was considered for reaction 65.
2.1.4. Biochemical protein synthesis
Protein synthesis considers 20 amino acids (reaction 63), 15 of them feature only one amino acid reaction (reactions 36-49) [29]. In particular, the amino acid syntheses; leucine (LEU), valine (VAL), threonine (THR), isoleucine (ILEU) and phenylalanine (PHE), are considered in two reactions, reactions 81 and 91 [28]. The first one uses an amino acid as a precursor to the formation of α-keto acid and the second one from the α-keto acid produces the corresponding amino acid. Those amino acids are strongly related to the synthesis of higher alcohols, particularly, they are a nitrogen source which is presented in the complex mediums of agave juice used for Tequila production.
2.1.5. Higher-alcohol synthesis
The synthesis of higher alcohols is strongly related to amino acids through α-keto acids which are precursors of n-propanol, isoamyl and amyl alcohol, 2-phenyl-ethanol and isobutanol. Higher alcohols production reactions 70-79 can be portrayed by two main pathways as:
1) Catabolic pathway, also known as the Ehrlich pathway, considers the transamination and deamination of the amino acids in the medium culture in reactions 81-92.
2) Anabolic pathway allows the α-keto acid synthesis from the present sugar in the medium. Especially, from the α-keto acids, the higher alcohols are obtained with a similar mechanism as the catabolic pathway in reactions 71-80.
2.1.6. DNA and RNA synthesis
For the syntheses of RNA (reaction 65) and DNA (reaction 66) macromolecules, the formation of molecules for the nucleotides biosynthesis is considered. For RNA, adenosine-monophosphate (AMP), guanosine-monophosphate (GMP), cytidine-monophosphate (CMP) and uridine-monophosphate (UMP) are considered in reactions 50-53 while for DNA, deoxyadenosine monophosphate (dAMP), deoxyguanosine monophosphate (dGMP), deoxycytidine monophosphate (dCMP), and deoxyuracil monophosphate (dUMP) are contemplated in reactions 54-57 [29].
2.1.7. Carbohydrates synthesis
Carbohydrate composition for S. cerevisiae includes glycogen, trehalose, mannose, and other carbohydrates as reported for reaction 64.
2.1.8. Lipids synthesis
The lipids for S. cerevisiae are mainly made of phospholipids, sterols and, triacylglycerols which their composition is 3, 54 and 20%, respectively. The main blocks for lipid synthesis consider fatty acids where the palmitic, oleic and linoleic fatty acids are 75% of the total [29]. With regard to the phospholipid composition for S. cerevisiae, it is well known that phosphatidylcholine, phosphatidylethanolamine, and phosphatidylinositol represent more than 90%. For sterols composition in S. cerevisiae, ergosterol represents the most abundant sterol with a porcentage of 90%. Therefore, the lipid synthesis in reaction 67 is presented [29].
2.1.9. Oxidative phosphorylation
For aerobic conditions, the oxidative phosphorylation is included (reactions 32 to 34). Furthermore, in other models that use S. cerevisiae, the stoichiometric oxidative ratio for phosphorylation is P/O = 1.0.
2.1.10. Cellular maintenance
The cellular maintenance in reaction 69 considers the Adenosine Triphosphate (ATP) consumption as for cell-pair functions. The value of S. cerevisiae cellular maintenance is 0.7 mmol ATP/ h g Dry Weight (DW) as it is reported in [29].
2.1.11. Model description
We propose a stoichiometric model that encompasses 117 biochemical reactions and 94 metabolites. From the 117 biochemical reactions, 93 are focused in internal fluxes and 24 to either transport or exchange fluxes between the external environment and the cell. The exchange fluxes analyzed are: glucose, fructose, ammonium, GLN, LEU, ILEU, VAL, THR, PHE, oxygen, sulphate, carbon dioxide, propanol, isobutanol, isoamylic alcohol, amylic alcohol, phenylethanol, ethyl acetate, ethanol, glycerol, acetate, acetaldehyde, succinate and biomass.
2.1.12. Compartmentalization
The compartmentalization was performed by the compounds OAA, ACCOA, NADH and NADPH which participate in reactions in the mitochondria as well as in the cytosol [30].
3.
Results
3.1. Stoichiometric model validation
The proposed stoichiometric model is validated under both conditions, fermentation (anaerobic) and growth (aerobic), which are evaluated with other models reported in the literature [15,30]. For a simulation in silico, the cellular maintenance (m) is considered to be m=0.7 mmol ATP/h g Dry Weight as well as a molecular weight (MW) for the biomass defined as 28 g/C-mol [30].
3.1.1. Stoichimetric model validation under anaerobic conditions
To validate the model under anaerobic conditions, the flux for the consumption of glucose at D = 0.1 h−1 was calculated using the Pirt maintenance model [32]. The glucose flux was 5.917 mmol/g DW h and it was established as an experimental reaction according to Eq (2.5). For oxygen, the flux was zero for anaerobic conditions. Moreover, ammonium was considered as a unique nitrogen source without any restriction (see Table S2). The results showed that large fermentation products (ethanol, biomass and CO2) presented a minimal deviation of 2.41, 0.9 and 2.6%, respectively, while glicerol had a deviation of 21% with respect to the values predicted in silico by Nissen et al. (1997), Table 1. The algorithm estimates only optimal solutions therefore non production of acetate is reported [22].
3.1.2. Stoichiometric model validation under aerobic conditions
For aerobic conditions, our model was tested against iFF708 which was conformed with 1035 reactions and had been validated experimentally under three conditions: microaerobic fermentation, oxide-fermentative growth, and aerobic growth featuring different oxygen consumptions [15].
1) Microaerobic fermentation
For microaerobic fermentation, the performed restrictions by the simulation were: glucose consumption flux = 14 mmol/g DW h and, oxygen consumption flux = 1 mmol/g DW h. However, ammonium was considered only as a nitrogen source without restrictions for either transport or consumption (see Table S3). The shown analysis of microaerobic fermentation in Table 2 predicted a growth specific velocity of μ=0.322 mmol/g DW h. For this value, deviations of 2.42 and 3.87% with respect to the values in silico and experimental were calculated, respectively. Moreover, the value of ethanol flux = 21.01 mmol/g DW h showed deviations of 1.31 and 4.63% with respect to the in silico and experimental values [15].
2) Oxide-fermentative growth
The oxide-fermentative growth was modelled by considering the following fluxes restrictions: glucose consumption of 12 mmol/g DW h, maximal oxygen consumption of 9 mmol/g DW h and ammonium source with a flux of 1 mmol/g DW h (see Table S4). For this simulation, a growth specific velocity of μ = 0.51 h−1 was obtained which represented a minor value of 3.77% compared with the value in silico, μ = 0.53 h−1, this value is shown in Table 3 and it was similar to the experimental value, both reported by Duarte (2004) [15]. With regard to the ethanol flux (14.03 mmol/g DW h), this represented a variation of 17.11% with respect to the value in silico and 21.10% with respect to the experimental value. Nevertheless, for acetate, our proposed model was not able to predict its production as it also had been reported for larger metabolic models [22]. Furthermore, this behavior could be attributed to the fact that the optimization was focused on maximizing the biomass production.
3) Aerobic growth glucose limited
To analyze this physiological state, a set of restrictions in the fluxes were performed: the flux of glucose consumption was 2.5 mmol/g DW h, the maximal flux consumption for oxygen was 8 mmol/g DW h and ammonium was the nitrogen source without any restriction (see Table S5). Table 4 shows the numerical result of μ = 0.20 h−1 which is 9.09% lower than the value calculated in silico, and it is similar to the experimental value reported by Duarte (2004) [15]. It is observed that our model and the one reported by Duarte (2004) [15] do not predict the production of ethanol and acetate, fluxes equal to zero, this behavior could be attributed to the fact that the objective function is the maximization of growth (μ) in aerobic conditions.
In particular, our model showed good results once it was tested with all the above conditions, therefore, it was useful to analyze the effects of dilution rate for the Tequila fermentation process using S. cerevisiae in agave juice.
3.2. Simulation of agave-juice fermentation under continuous culture for tequila production: Dilution rate effect
Fluxes for fructose consumption, ethanol production and the specific growth rate were calculated (see Table S6), with base on the experimental data reported by Moran (2011) [5]. Additionally, the fluxes of volatile compounds were also estimated (see Table S7). These estimated fluxes were specified in our model for performing simulations in silico and for estimating the metabolic fluxes distribution (see Figures 1-3). The optimization process was performed under anaerobic conditions, restricting the oxygen consumption flux in the optimization problem and considering the ammonium phosphate consumption as the unique source of nitrogen. The higher-alcohols production fluxes were specified in the optimization problem as experimental restrictions to obtain a physiological state of the microorganism. The simulation showed that the model predicted an ethanol flux of 5.8 mmol/g DW h (see Table 5), which represented a deviation of -13% with respect to the calculated value from the experimental data of 6.654 mmol/g DW h. The specific growth velocity (μ) was established as the fermentor's continuous dilution rate of μ=D=0.04 h−1. Moreover, the considered cellular maintenance was m=0.7 mmol ATP/g DW h as the value reported for S. cerevisiae by Stephanopolous (1998) [29].
The performed in silico optimizations through FBA were analyzed for the dilution rates of D = 0.04 h−1, D = 0.08 h−1 and D = 0.12 h−1 obtaining a good adjustment regarding ethanol flux (see Table S8). However, the adjustment was reduced as the dilution rate was increased. In addition, for the dilution rate of D=0.16 h−1, and a sugar flux of 12.569 mmol glucose/g DW h, it was not possible to obtain a flux map distribution.
4.
Discussion
Observing the flux distribution map under continuous culture, it is possible to identify the activation of different metabolism paths for Saccharomyces cerevisiae such as glycolysis, pentoses phosphate, fermentative pathways, Krebs cycle, oxidative, phosphorylation, and the consume fluxes for the production of metabolites (see Figures 1-3). Particularly, when the dilution rate increases within the range D = 0.04 to 0.08 h−1 there is an increment in the fluxes of glycerol, acetaldehyde and ammonium as well as in the higher alcohols production (see Figures 1 and 2).
This phenomenon occurs due to a direct relationship between ammonium and the production of higher alcohols. In some fermentation processes, the consumption of ammonium in high levels is correlated with high glycerol, acetate and acetaldehyde syntheses resulting in a reduction of the higher alcohols synthesis [32]. If the dilution rate increases, the microorganism requires higher ammonium concentration but due to the fact that it is limited, the pathway regulation reduces the anabolic pathways of amino acids biosynthesis and then the higher alcohol synthesis increases due to the anabolic pathway from amino acids (LEU, ILEU, VAL, THR and PHE) present in the agave juice [7]. The three physiological states for Saccharomyces cerevisiae are shown in the Figures 1-3 according to the experimental restrictions used in the FBA tool.
● a) Map one represents the metabolic flux distribution for (D = 0.04 h−1) (Figure 1) (see Table S6). This physiological state had the highest fermentative capacity of the four states explored by Moran et. al. [5]. Moreover, the highest ethanol concentration was 43.92 g/L and the highest biomass concentration (5.83 g/L) has attained the minimum-residual sugar concentration in the fermentation media (3.94 g/L) by consuming the whole sugar. Additionally, the alcohol productivity reached the second place (1.76 g/L h) in comparison with the other three dilution rates.
● b) Map two represents the metabolic flux distribution for (D = 0.08 h−1) (Figure 2) (see Table S6). The physiological state features one of the two states that had the largest alcohol productivity (2.37 g/L h) similar to the dilution rate D = 0.12 h−1, in comparison with the other two dilution rates. This physiological state had the maximum sugar consumption (5.08 g/L h), the second highest ethanol concentration (29.63 g/L), a residual sugar concentration of 35.34 g/L and a biomass concentration of 3.38 g/L.
● c) Map three represents the metabolic flux distribution for (D = 0.12 h−1) (Figure 3) (see Table S6). It was one of two states that had the highest alcohol productivity (2.37 g/L h), similar to the dilution rate D = 0.08 h−1. Furthermore, it had the second highest value in the sugar consumption rate (4.69 g/L h) and the third highest value in ethanol concentration (19.76 g/L), the second highest value of the residual sugar in the media (59.75 g/L) and also including the third highest value in the biomass concentration (3.04 g/L).
The range of dilution rate (D = 0.08 to 0.12 h−1) showed a low fermentative capacity (biomass concentration) which could be due to a low content of nutrients in agave juice [25] (see Table S6). While the dilution rate increased over the range of D = 0.04 to 0.12 h−1, the concentrations for higher alcohols (n-propanol, iso-butanol, isobutyl alcohol, amyl and isoamyl alcohol and 2-Phenyl-ethanol) also increased.
5.
Conclusions
A metabolic model to analyze Saccharomyces cerevisiae in a continuous fermentation process to obtain agave juice for Tequila production was proposed and implemented. The metabolic model encompassed 94 metabolites and 117 reactions in contrast with far more complex models featuring up to 1035 biochemical reactions such as iFF708. From the 117 reactions, 93 of those were linked to biochemical internal reactions and 24 to transport fluxes between the medium and the microorganism. The developed model was validated under anaerobic and aerobic conditions and it predicted the flux values of the principal metabolites associated with Tequila fermentation. The model allowed us to obtain an estimate of the metabolic flux-map distribution of the strain Saccharomyces cerevisiae and the physiological states of the yeast during the continuous agave-juice fermentation for Tequila production. The estimated fluxes by the model were similar to experimental results reported in literature in which it was possible to visualize the central metabolism and the synthesis pathways of the higher alcohols. The importance of the present genomic model is that it is a simple model which allows the estimation of the metabolic fluxes and determines the cellular physiology state of Saccharomyces cerevisiae.
Acknowledgments
To Consejo Nacional de Ciencia y Tecnología (CONACYT) for the fellowship granted (fellowship number: 174828 and registry number: 165004) and to CIATEJ and UdeG for the facilities and support during the development of the present work.
Conflicts of interest
The authors declare no conflicts of interest.
Appendix
Appendix A. Reaction's list considered in the stoichiometric model.
Glucolysis.
1. GLC + ATP → G6P + ADP
2. FRUC + ATP → F6P + ADP
3. G6P ↔ F6P
4. F6P + ATP → DHAP + G3P + ADP
5. DHAP → G3P
6. G3P + NAD + ADP + Pi → PG3 + ATP + NADH
7. PG3 ↔ PEP
8. PEP + ADP → PYR + ATP
Fermentative pathways.
9. DHAP + NADH → GL3P + NAD
10. GL3P → GL + Pi
11. PYR → ACD + CO2
12. ACD + NADH ↔ ETH + NAD
13. ACD + NADHm ↔ ETH + NADm
14. ACD + NAD → AC + NADH
15. ACD + NADP → AC + NADPH
16. COAm + NADm + PYR → ACCOAm + CO2 + NADHm
17. AC + ATP + COA → ACCOA + ADP + Pi
Pentose phosphate pathway.
18. G6P + 2 NADP → CO2 + 2 NADPH + RL5P
19. RL5P ↔ X5P
20. RL5P ↔ R5P
21. R5P + X5P ↔ G3P + S7P
22. E4P + X5P ↔ F6P + G3P
23. G3P + S7P ↔ E4P + F6P
Citric acid cycle.
24. ATP + OAA → ADP + OAAm + Pi
25. ATP + CO2 + PYR → ADP + OAA + Pi
26. ACCOAm + OAAm → COAm + ICIT
27. ACCOA + OAAm → COA + ICIT
28. ICIT + NADm ↔ AKG + CO2 + NADHm
29. ICIT + NADPm ↔ AKG + CO2 + NADPHm
30. ADP + AKG + NADm + Pi ↔ ATP + CO2 + NADHm + SUCC
31. FADH + SUCC ↔ FADH2 + MAL
32. MAL + NADm ↔ NADHm + OAAm
Oxidative phosphorylation: P/O = 1.09
33. 2 P/O ADP + 2 NADHm + 1 O2 + 2 P/O Pi → 2 P/O ATP + 2 NADm
34. 2 P/O ADP + 2 NADH + 1 O2 + 2 P/O Pi → 2 P/O ATP + 2 NAD
35. 2 P/O ADP + 2 FADH2 + 1 O2 + 2 P/O Pi → 2 P/O ATP + 2 FADH
Biosynthesis of amino acids.
36. NADPH + NH4int + PYR → ALA
37. AKG + 7 ATP + 4 NADPH + 4 NH4int → ARG + NADH
38. 3 ATP + NADPH + 2 NH4int + OAA → ASN
39. NADPH + NH4int + OAA → ASP
40. 4 ATP + METHF + 5 NADPH + NH4int + PG3 + SO4 → CYS + THF
41. AKG + NADPH + NH4int → GLU
42. AKG + ATP + NADPH + 2 NH4int →GLN
43. NADPH + NH4int + PG3 + THF → GLY + METHF + NADH
44. 6 ATP + METHF + NADPH + 3 NH4int + R5P → HIS + 3 NADH + THF
45. ACCOA + AKG + 2 ATP + 4 NADPH + 2 NH4int → LYS + 2 NADH
46. 7 ATP + METHF + 8 NADPH + NH4int + OAA + SO4 → MET + THF
47. AKG + ATP + 3 NADPH + NH4int → PRO
48. NADPH + NH4int + PG3 → NADH + SER
49. 5 ATP + E4P + 3 NADPH + 2 NH4int + PEP + R5P → 2 NADH + TRYP
50. ATP + E4P + 2 NADPH + NH4int + 2 PEP → NADH + TYR
Biosynthesis of Nucleotides.
51. 9 ATP + METHF + NADPH + 5 NH4int + PG3 + R5P → AMP + 3 NADH
52. 11 ATP + METHF + 5 NH4int + PG3 + R5P → GMP + 3 NADH
53. 5 ATP + NADPH + 2 NH4int + OAA + R5P → UMP
54. 7 ATP + NADPH + 3 NH4int + OAA + R5P → CMP
55. 9 ATP + METHF + 2 NADPH + 5 NH4int + PG3 + R5P → dAMP + 3 NADH
56. 11 ATP + METHF + NADPH + 5 NH4int + PG3 + R5P → dGMP + 3 NADH
57. 5 ATP + METHF + 3 NADPH + 2 NH4int + OAA + R5P → dTMP
58. 7 ATP + 2 NADPH + 3 NH4int + OAA + R5P → dCMP
59. CO2 + 2 NADH + THF → METHF + 2 NAD
Biosynthesis of fatty acids.
60. 8 ACCOA + 7 ATP + 14 NADPH → PALMITIC
61. 9 ACCOA + 8 ATP + 16 NADPH → NADH + OLEIC
62. 9 ACCOA + 8 ATP + 16 NADPH → LINOLEIC + 2*NADH
63. 0.0122 LINOLEIC + 0.0147 OLEIC + 0.0249 PALMITIC → FATTYACID
Biosynthesis of macromolecules (proteins, carbohydrates, rna, dna and lipids).
64. 0.4277 ALA + 0.5096 ARG + 0.231 ASN + 0.9247 ASP + 39.1 ATP + 0.081 CYS + 0.2439 GLN + 0.9755 GLU + 0.5096 GLY + 0.8281 HIS + 0.4732 ILEU + 0.7189 LEU + 0.2821 LYS + 0.4277 MET + 0.364 PHE + 0.31913 PRO + 0.4732 SER + 0.1274 THR + 0.364 TRYP + 0.5915 TYR + 0.1547 VAL → 39.1 ADP + 39.1 Pi + PROT
65. ATP + G6P → 39.1 ADP + 0.17892 CARBH + Pi
66. 0.79 AMP + 7.44 ATP + 0.61 CMP + 0.89 GMP + 0.81 UMP → 7.44 ADP + RNA
67. 11 ATP + 0.79 dAMP + 0.82 dCMP + 0.82 dGMP + 0.79 dTMP → 11 ADP + DNA
68. 0.4817 ACCOA + 0.0518 FATTYACID + 0.4298 ATP + 0.005 G6P + 0.0227 GL + 0.0179 METHF + 0.0552 NADH
+ 0.8194 NADPH + 0.011 NH4int + 0.011 PG3 → 0.4817 COA + 0.029 LIPID + 0.4298 Pi Objective function composition of biomass.
69. 0.4 CARBH + 0.004 DNA + 0.029 LIPID + 0.45 PROT + 0.063 RNA → BIOMASS Cellular maintenance
70. ATP → ADP + Pi
Pathways of catabolic and anabolic synthesis of higher alcohols and synthesis of Val, Leu, Ileu, Thr and Phe.
71. Alpha ketobutyrate ↔ CO2 + Propionaldehyde
72. H + NADH + Propionaldehyde ↔ NAD + Propanol
73. Alpha ketoisovalerate ↔ Alpha hydroxyvaleraldehyde + CO2
74. Alpha hydroxyvaleraldehyde + H + NADH ↔ Isobutanol + NAD
75. Alpha ketoisocaproate ↔ CO2 + isovaleraldehyde
76. H + isovaleraldehyde + NADH ↔ Isoamylic + NAD
77. Alpha ketomethylvaleric ↔ Alpha hydroxyisocapraldehyde + CO2
78. Alpha hydroxyisocapraldehyde + H + NADH ↔ Amylic + NAD
79. Phenylpyruvate ↔ CO2 + Phenylacetaldehyde
80. Phenylacetaldehyde + H + H2O + NADH ↔ Phenylethanol + NAD
Biosynthesis of the amino acids ILEU, THR, LEU, VAL and PHE.
81. THR ↔ Alpha-ketobutyrate + NH4int
82. Alpha ketobutyrate + PYR ↔ Alpha hydroxybutyrate + CO2
83. Alpha ketomethylvaleric + H2O + NADP ↔ Alpha hydroxybutyrate + H + NADPH
84. Alpha ketomethylvaleric + GLU ↔ AKG + ILEU
85. 2 ATP + GLU + H + H2O + 2 NADPH + OAA ↔ 2 ADP + AKG + 2 NADP + Pi + THR
86. ACCOA + Alpha ketoisovalerate + H2O + NAD ↔ Alpha ketoisocaproate + CO2 + COA + H + NADH
87. Alpha ketoisocaproate + GLU ↔ AKG + LEU
88. H + NADPH + 2 PYR ↔ Alpha ketoisovalerate + CO2 + H2O + NADP
89. Alpha ketoisovalerate + GLU ↔ AKG + VAL
90. AKG + PHE ↔ Phenylpyruvate + GLU
91. ATP + Phenylpyruvate + GLU + NADPH → ADP + AKG + NADP + PHE
92. ATP + E4P + NADPH + 2 PEP → ADP + CO2 + Phenylpyruvate + H2O + NADP + 4 Pi
93. AC + ETH → Ethyl acetate
Flows of transport or exchange inside and outside the cell.
94. GLC_ext → GLC
95. FRUC_ext → FRUC
96. ATP + NH4ext → ADP + NH4int + Pi
97. GLN_ext + ATP → GLN + ADP + Pi
98. VAL_ext + ATP → VAL + ADP + Pi
99. LEU_ext + ATP → LEU + ADP + Pi
100. ILEU + ATP → ILEU + ADP + Pi
101. THR_ext + ATP → THR + ADP + Pi
102. PHE_ext + ATP → PHE +ADP + Pi
103. O2ext → O2
104. CO2 → CO2ext
105. Propanol → Propanol_ext
106. Isobutanol → Isobutanol_ext
107. Isoamylic → Isoamylic_ext
108. Amylic → Amylic_ext
109. Phenyletanol → Phenyletanol_ext
110. Ethyl acetate → Ethyl acetate_ext
111. ETH →Etanol
112. GL → GL_ext
113. AC → AC_ext
114. ACD → ACD_ext
115. SUCC → SUCC_ext
116. BIOMASS → BIOMASS_ext
Appendix B. Metabolites list considered in the stoichiometric model
Nomenclature: Metabolite's name
PG3: 3-Phosphoglycerate
AC: Acetate
AC_ext: Acetate extern
ACCOA: AcetylCoA
ACCOAm: Mitochondrial acetylCoA
ACD: Acetaldehyde
ACD_ext: Acetaldehyde extern
AKG: 2-Oxoglutarate
ALA: L-Alanine
AMP: Adenosine monophosphate
ARG: L-Arginine
ASN: L-Asparagine
ASP: L-Aspartate
ATP: Adenosine Triphosphate
Alpha ketobutyrate: Alpha-ketobutyrate
Alpha hydroxybutyrate: Alpha hydroxybutyrate
Alpha ketoisocaproate: Alpha ketoisocaproate
Alpha ketoisovalerate: Alpha ketoisovalerate
Alpha ketomethylvaleric: Alpha ketomethylvaleric
Alpha hydroxyisocapraldehyde:
Alphahydroxyisocapraldehyde
Alpha hydroxyvaleraldehyde: Alpha
hydroxyvaleraldehyde
Amylic alcohol: Amylic alcohol
BIOMASS: Biomass
BIOMASS_ext: Biomass extern
CARBH: Carbohydrate
CMP: Cytidine monophosphate
CO2: Carbon dioxide
CO2_ext:Carbon dioxide extern
CYS: L-Cystein
DHAP; Dihydroxyacetone phosphate
DNA: Desoxirribunocleic acid
E4P: Erythrosa-4-Phosphate
ETH: Ethanol
ETH_ext: Ethanol extern
Ethyl acetate: Ethyl acetate
Ethyl acetate_ext: Ethyl acetate_extern
F6P: Fructose-6-Phosphate
FAD: Flavin adenine dinucleotide
FRUC: Fructose
FRUC_ext: Fructose extern
Phenylacetaldehyde: Phenylacetaldehyde
Phenylethanol: Phenylethanol
Phenylpyruvate: Phenylpyruvate
G3P: Glyceraldehyde-3-Phosphate
G6P: Glucose-6-Phosphate
GL: Glycerol
GL_ext: Glycerol ext
GL3P: Glyceraldehyde-3-Phosphate
GLC: Glucose
GLC_ext: Glucose extern
GLN: L-Glutamine
GLN_ext: L-Glutamine extern
GLU: L-Glutamate
GLY: L-Glycine
GMP: Guanosine monophosphate
HIS: L-Histidine
ICIT: Isocitrate
ILEU: L-Isoleucine
ILEU_ext: L-Isoleucine extern
Isoamylic: Isoamilic alcohol
Isoamylic_ext: Isoamilic alcohol extern
Isobutanol: Isobutanol
Isobutanol extern: Isobutanol
Isovaleraldehyde: isovaleraldehyde
LEU: L-Leucine
LEU_ext: L-Leucine extern
LIPID: Lipid
LYS: L-Lysine
MAL: L-Malate
MET: Methionine
METHF: 5, 10-Methylentetrahydrofolate
NADH: Nicotinamide adenine dinucleotide
NADHm: Nicotinamide adenine dinucleotide cytosolic
NADPH: Nicotinamide adenine dinucleotide phosphate
NADPHm: Nicotinamide adenine dinucleotide
phosphate mitochondrial
NH4ext: Extracellular ammonium
NH4int: Intracellular ammonium
O2: Oxygen
O2ext: Oxygen externo
OAA: Cytosol Oxaloacetate
OAAm: Mitochondrial oxaloacetate
PEP: Phosphoenolpyruvate
PHE: L-Phenylalanine
PHE_ext: L-Phenylalanine extern
Phenyl etanol: Phenyl etanol
Phenyl etanol_ext: Phenyl etanol_extern
PRO: Proline
PROT: Protein
PYR: Pyruvate
Propanol: Propanol
Propanol_ext: Propanol extern
Propionaldehyde: Propionaldehyde
R5P: Ribosa-5-phosphate
RL5P: Ribulose-5-phosphate
RNA: Ribonucleic acid
S7P: Heptulose-7-phosphate
SER: L-Serine
SO4: Sulphate
SUCC: Succinate
SUCC_ext: Succinate extern
THR: L-Threonine
THR_ext: L-Threonine extern
TRYP: L-Tryptophan
TYR: L-Tyrosine
UMP: Uracyl monophosphate
VAL: L-Valine
VAL_ext: L-Valine extern
X5P: Xylulose-5-phosphate
dAMP: Desoxy adenosine monophosphate
dCMP: Desoxy Citosine monophosphate
dGMP: Desoxy Guanosine monophosphate
dTMP: deoxythymidine monophosphate