Review Topical Sections

Oral microbiome and health

  • Received: 27 October 2017 Accepted: 03 January 2018 Published: 12 January 2018
  • The oral microbiome is diverse in its composition due to continuous contact of oral cavity with the external environment. Temperatures, diet, pH, feeding habits are important factors that contribute in the establishment of oral microbiome. Both culture dependent and culture independent approaches have been employed in the analysis of oral microbiome. Gene-based methods like PCR amplification techniques, random amplicon cloning, PCR-RELP, T-RELP, DGGE and DNA microarray analysis have been applied to increase oral microbiome related knowledge. Studies revealed that microbes from the phyla Firmicutes, Proteobacteria, Bacteroidetes, Actinobacteria, Fusobacteria, Neisseria, TM7 predominately inhabits the oral cavity. Culture-independent molecular techniques revealed the presence of genera Megasphaera, Parvimonas and Desulfobulbus in periodontal disease. Bacteria, fungi and protozoa colonize themselves on various surfaces in oral cavity. Microbial biofilms are formed on the buccal mucosa, dorsum of the tongue, tooth surfaces and gingival sulcus. Various studies demonstrate relationship between unbalanced microflora and development of diseases like tooth caries, periodontal diseases, type 2 diabetes, circulatory system related diseases etc. Transcriptome-based remodelling of microbial metabolism in health and disease associated states has been well reported. Human diets and habitat can trigger virus activation and influence phage members of oral microbiome. As it is said, “Mouth, is the gateway to the total body wellness, thus oral microbiome influences overall health of an individual”.

    Citation: Neetu Sharma, Sonu Bhatia, Abhinashi Singh Sodhi, Navneet Batra. Oral microbiome and health[J]. AIMS Microbiology, 2018, 4(1): 42-66. doi: 10.3934/microbiol.2018.1.42

    Related Papers:

    [1] Yuri M. Moshkin . Chromatin—a global buffer for eukaryotic gene control. AIMS Biophysics, 2015, 2(4): 531-554. doi: 10.3934/biophy.2015.4.531
    [2] Audrey Lejart, Gilles Salbert, Sébastien Huet . Cytosine hydroxymethylation by TET enzymes: From the control of gene expression to the regulation of DNA repair mechanisms, and back. AIMS Biophysics, 2018, 5(3): 182-193. doi: 10.3934/biophy.2018.3.182
    [3] Théo Lebeaupin, Hafida Sellou, Gyula Timinszky, Sébastien Huet . Chromatin dynamics at DNA breaks: what, how and why?. AIMS Biophysics, 2015, 2(4): 458-475. doi: 10.3934/biophy.2015.4.458
    [4] Edward N Trifonov . Columnar structure of SV40 minichromosome. AIMS Biophysics, 2015, 2(3): 274-283. doi: 10.3934/biophy.2015.3.274
    [5] Raghvendra P Singh, Guillaume Brysbaert, Marc F Lensink, Fabrizio Cleri, Ralf Blossey . Kinetic proofreading of chromatin remodeling: from gene activation to gene repression and back. AIMS Biophysics, 2015, 2(4): 398-411. doi: 10.3934/biophy.2015.4.398
    [6] Michael-Christian Mörl, Tilo Zülske, Robert Schöpflin, Gero Wedemann . Data formats for modelling the spatial structure of chromatin based on experimental positions of nucleosomes. AIMS Biophysics, 2019, 6(3): 83-98. doi: 10.3934/biophy.2019.3.83
    [7] Larisa A. Krasnobaeva, Ludmila V. Yakushevich . On the dimensionless model of the transcription bubble dynamics. AIMS Biophysics, 2023, 10(2): 205-219. doi: 10.3934/biophy.2023013
    [8] Michael J. Hamilton, Matthew D. Young, Silvia Sauer, Ernest Martinez . The interplay of long non-coding RNAs and MYC in cancer. AIMS Biophysics, 2015, 2(4): 794-809. doi: 10.3934/biophy.2015.4.794
    [9] Larisa I. Fedoreyeva, Boris F. Vanyushin, Ekaterina N. Baranova . Peptide AEDL alters chromatin conformation via histone binding. AIMS Biophysics, 2020, 7(1): 1-16. doi: 10.3934/biophy.2020001
    [10] Klemen Bohinc, Leo Lue . On the electrostatics of DNA in chromatin. AIMS Biophysics, 2016, 3(1): 75-87. doi: 10.3934/biophy.2016.1.75
  • The oral microbiome is diverse in its composition due to continuous contact of oral cavity with the external environment. Temperatures, diet, pH, feeding habits are important factors that contribute in the establishment of oral microbiome. Both culture dependent and culture independent approaches have been employed in the analysis of oral microbiome. Gene-based methods like PCR amplification techniques, random amplicon cloning, PCR-RELP, T-RELP, DGGE and DNA microarray analysis have been applied to increase oral microbiome related knowledge. Studies revealed that microbes from the phyla Firmicutes, Proteobacteria, Bacteroidetes, Actinobacteria, Fusobacteria, Neisseria, TM7 predominately inhabits the oral cavity. Culture-independent molecular techniques revealed the presence of genera Megasphaera, Parvimonas and Desulfobulbus in periodontal disease. Bacteria, fungi and protozoa colonize themselves on various surfaces in oral cavity. Microbial biofilms are formed on the buccal mucosa, dorsum of the tongue, tooth surfaces and gingival sulcus. Various studies demonstrate relationship between unbalanced microflora and development of diseases like tooth caries, periodontal diseases, type 2 diabetes, circulatory system related diseases etc. Transcriptome-based remodelling of microbial metabolism in health and disease associated states has been well reported. Human diets and habitat can trigger virus activation and influence phage members of oral microbiome. As it is said, “Mouth, is the gateway to the total body wellness, thus oral microbiome influences overall health of an individual”.


    1. Introduction

    Eukaryotic DNA is spatially organized in a hierarchical manner, the first level being the chain of nucleosomes connected by DNA linkers (“beads on a string”). Stereochemical details of the second level of DNA organization, the so-called 30-nm fiber, still remain a subject of debate [1,2,3,4], despite the fact that the structure of the nucleosome was determined at a high resolution more than 10 years ago [5].

    During the past decade there has been a significant progress in the structural studies of chromatin, starting with the seminal studies of Richmond and co-authors, who first observed the two-start fibers (Dorigo et al. [6] and Schalch et al. [7]). Their results, together with the high-resolution Cryo-EM data obtained by Song et al. [8] strongly support the two-start organization of chromatin fibers for relatively short linkers L = 20, 30 and 40 bp. However, the electron microscopy (EM) images presented by Rhodes and co-authors [9,10] suggest that for L = 50 bp and longer, the one-start solenoid (or interdigitaded structure) is more stable, especially in the presence of linker histones.

    All these structures were obtained for arrays of strongly positioned “601” nucleosomes [11], with the nucleosome repeat length (NRL) varying from 167 to 237 bp in increments of 10 bp. Assuming that the nucleosome core is 147 bp [5], this means that the linker length varies from 20 to 90 bp—that is, L belongs to the {10n} series. On the other hand, it is known that in vivo, the linker sizes are close to {10n + 5} values, at least for yeast and mouse [12,13]; in particular, L = 15 bp is predominant in the baker’s yeast chromatin [12,14,15]. Thus, the structural data mentioned above correspond to linker lengths with occurrences in vivo that are relatively small.

    Only recently, Grigoryev and co-authors analyzed nucleosomal arrays with linker lengths belonging both to the series {10n} and {10n + 5} (Correll et al. [16]). Using sedimentation and EM visualization, they demonstrated that fibers with L = 25 bp (NRL = 172 bp) have less propensity to fold in a compact state compared to L = 20 or 30 bp. The increased fiber “plasticity” observed for L = 10n + 5 may be functionally significant because the {10n + 5} values are frequently found in vivo.

    The distinct folding pathways observed for fibers with L = 10n and L = 10n + 5 [16] indicate that these fibers may have different configurations, and in particular, different spatial arrangements of DNA linkers. This polymorphism may be related to the early studies by Worcel et al. [17], Woodcock et al. [18] and Williams et al. [19] whose space-filling models of the chromatin fiber were presented with the DNA linking number ΔLk varying from −1 to −2 per nucleosome, depending on the DNA trajectory. (At that time, the ΔLk values were not calculated precisely, but rather were estimated qualitatively.)

    Generally speaking, this variability of ΔLk can be attributed to the existence of different fiber topoisomers corresponding to different levels of DNA supecoiling, which may have far-reaching biological implications, from local protein-DNA interactions [20] to large-scale regulation of transcription [21]. However, the topological properties have not been analyzed in computational studies of regular chromatin fibers published recently [22,23]. Therefore, in this study, we performed a thorough computational analysis of regular two-start fibers, focusing on their topology.

    Earlier, we presented results of computations for relatively short linkers L < 40 bp [24]. Here, we analyze chromatin fibers with the linker lengths varying from 10 to 70 bp, and confirm the main conclusions made earlier. First, we describe two families of conformations—one (denoted T2) represents the structures visualized in the X-ray and Cryo-EM studies [7,8], and the other (denoted T1) comprises “novel” structures not observed experimentally so far. The fibers from the two families are characterized by different ΔLk values—that is, they are topologically different. Second, there is a strict relationship between the type of topoisomer and the linker length: for linkers L = 10n, the “old” topoisomer T2 is energetically optimal, whereas for linkers L = 10n + 5 the “novel”topoisomer T1 is more favorable. These features are valid for the whole interval of the linker lengths. There are certain differences between the “short” and “long” linkers, however. In particular, for linkers L > 50 bp the energy minima become more shallow and the energy barriers between the T1 and T2 minima less pronounced. This tendency is consistent with the experimental data mentioned above [9,10].

    Next, we analyze how the DNA linking number ΔLk depends on the finite size of chromatin fiber. The obtained results are critical for quantitative interpretation of the experimental results on the level of DNA supercoiling in circular closed DNA (ccDNA) with reconstructed nucleosomal arrays [25,26,27].

    Finally, we present convincing evidence that the NRL observed in vivo correlates with the level of gene expression in yeast. Since the NRL (and the inter-nucleosome linker L) define the DNA supercoiling density, we consider this particular result as a reflection of the more general interrelationship between the “local” topological polymorphism of chromatin fibers and the “global” topological changes in DNA occurring during transcription.

    2. Methods

    2.1. Geometry of chromatin fibers and energy calculation

    Positions of nucleosomes in a regular symmetrical fiber can be described by four parameters (Figure 1). (The chromatin fiber is called regular if all inter-nucleosome linkers have the same conformation and symmetrical if its structure does not change when it is turned upside down.) The three cylindricalcoordinates define positions of the nucleosome centers: radius r, rise h and polar angle φ. This angle determines the handedness of the fiber and number of stacks. For instance, the left-handed two-stack fibers correspond to φ between 150° and 180°. The fourth parameter, ρ, defines inclination of nucleosomes relative to the fiber axis. This corresponds to a rotation around the dyad axis X (Figure 1). This parameter plays a special role in our analysis because it determines the twist in linker DNA and the topological properties of the fiber in general [24].

    Figure 1. Definition of the four parameters describing the conformation of a regular symmetrical chromatin fiber [24]. These are three cylindrical parameters h (rise), r (radius) and polar angle φ, and the internal inclination angle ρ. Each nucleosome is associated with a right-handed coordinate frame in which axis Z represents the superhelical axis of the nucleosome (calculated as described earlier [62]), axis X points toward the nucleosome dyad, and axis Y is perpendicular to X and Z. The inclination angle ρ defines rotation of a nucleosome around the dyad axis X. The entry point of nucleosome ν1 is shown as a red ball. The image was prepared with the VMD software package [63].

    The nucleosome core particles (DNA and histones) are considered to be rigid in our computations, with the coordinates taken from the high-resolution crystal structure [5].

    To find the optimal conformation of the DNA linker connecting two nucleosomes (Figure 1) we use a “mesoscopic”approach [28] in which DNA is modeled at the level of dimeric steps, and its trajectory is described by the six base-pair step parameters Twist, Roll, Slide, etc. [29]. The elastic energy of the linker DNA deformation is calculated using the knowledge-based potential functions introduced by Olson et al. [30]. The stiffness constants, including the cross correlations (such as Twist-Roll) are taken as averages for all 16 dinucleotides. For rest-state values, we use the average helical parameters of B-DNA: Twist = 34.5° and Rise = 3.35 Å; the other rest-state values, such as Slide, are taken to be zero. The DNA linker minimization is nested in the outer cycle in which the total energy of the nucleosome fiber is minimized as a function of the four parameters defining the fiber configuration (Figure 1).

    Four energy terms are considered in our calculations: the elastic energy of linker DNA (see above), the repulsive and electrostatic interactions (calculated using the Coulomb potential with 30 Å distance cutoff), and the H3 tail—acidic patch interactions between the adjacent nucleosomes, which are modeled phenomenologically as described earlier [24].

    2.2. DNA topology

    The DNA topology is described by three parameters: ΔTw (the change in DNA twisting), DNA writhing, Wr, and the change in the linking number, ΔLk (compared to the relaxed state of DNA) [31,32,33]. They are related by the well-known equation: ΔLk = Wr + ΔTw. This equation is valid for closed circular DNA; therefore, we need to find an effective way to build the closed DNA trajectory. We add four extra points connecting the ends of DNA in a way that these points remain in one plane with the fiber axis and the closing chain does not pass through nucleosomes (Figure 2). In this case, the DNA fragments connecting these four points do not introduce additional writhing because they are in the same plane. Note that our approach is similar to that used by Fuller to close the ends of a ribbon wound in a regular superhelix (see Figure 4 in [31]).

    Figure 2. Closing the fiber ends to compute the DNA writhing, Wr. Two points are chosen on the fiber axis, 350 Å above and below the fiber periphery. The other two points are obtained by shifting the first two points by 500 Å in the plane defined by the fiber axis and the entry point shown as a red ball. The direction of shift is perpendicular to the fiber axis.

    To calculate the DNA writhing, we use the quadrangle method that was first derived by Levitt [34] for the description of protein folding and was later used for DNA by Klenin and Langowski [35]. The DNA trajectory is represented by a polygonal chain with the vertex points at the centers of base pairs. The DNA twisting is determined using the Euler angle formalism [36,37] implemented in CompDNA [38], 3DNA [39] and SCHNAaP [40] software.

    3. Results

    3.1. Energetically optimal conformations

    As mentioned above, the two series of linker length, L = 10n and 10n + 5, have been the focus of investigators, the former because chromatin fibers with L = 10n are more stable in vitro, and the latter because linkers L = 10n + 5 are observed in vivo. Therefore, we paid most attention to these values of L.

    Our computations demonstrate significant variability of two-start chromatin fibers (Figure 3), which is the result of interplay between the linker DNA twisting (naturally depending on the linker length) and the inclination of nucleosomal disks (Figure 1). For example, note the nearly two-fold increase in diameter of fibers accompanying a linker increase from 10-15 to 60-65 bp. This trend is to be expected because the linker length dictates the diameter. On the other hand, the fiber extension clearly visible for the short linkers, L = 10-20 bp, is apparently favorable, as it helps to avoid steric clashes between nucleosomes when their orientation is “almost horizontal”.

    Figure 3. Two-start chromatin fibers for variable linker sizes. Optimal structures are shown for the two series of linker lengths, i.e. for L = 10n (A) and L = 10n + 5 (B). For the {10n} series, the inclination angle ρ varies from −80°to −30°. For the {10n + 5} series, the angle ρ changes from 80° to 110°. In this case, the nucleosomes are “almost” parallel to the fiber axis. Note that the fiber dimensions vary significantly for both series, but overall the fibers for L = 10n are more extended than for L = 10n + 5. The most compact forms (with the smallest rise) occur for L = 40-45 bp. For the shorter linkers L = 10-25 bp, in order to avoid clashes between linkers and nucleosomes, the rise is higher. In both series the diameter increases linearly with the linker length. The structures for L = 20, 25 and 30 bp were presented earlier [24]. The fibers shown in (A) and in (B) belong to different topological families, denoted T2 and T1, respectively. As shown in Figure 5, the two series of structures are distinguished by the DNA linking number.

    Comparison of our calculated structures with those observed experimentally is possible only for L = 20 to 40 bp (Supplementary Figure S1). Our optimal structures are remarkably similar to those visualized by Cryo-EM [8] for L = 30 and 40 bp in terms of the super-helical parameters shown in Figure 1. For example, the parameter rise is 24 Å and 22.5 Å in the experimental structures, while our computations predict the values 25 Å and 20 Å (for L = 30 and 40 bp, respectively). In the case of L = 20 bp, we cannot directly compare our regular fiber with the irregular dinucleosome crystal structure solved by Schalch et al. [7]. The “direct” model built in that study had a low rise of 17 Å and several “steric overlaps” [7]. Therefore, we used EM images presented by Routh et al. [9] and Correll et al. [16] and estimated the rise to be ~ 25 Å, which is close to our predicted rise = 27 Å.

    For the L = 10n + 5 series, we predicted a family of novel structures that are clearly different from the fibers with L = 10n (Figure 3B). Note the “nearly vertical” orientation of nucleosomes in the novel structures—they are rotated by more than 90° compared to the known structures for L = 20-30 bp, so that the red balls indicating “entry points” are invisible in this projection. Since there are no experimentally observed high-resolution fiber structures for L = 10n + 5 (suitable for comparison with our models), we have only indirect evidence in support of their existence (see below).

    3.2. Energy landscape

    A more detailed presentation of our numeric results is given in a two-dimensional plot (ρ, L) with linker lengths varying continuously from ~ 10 to 70 bp, and the inclination angle r spanning the whole 360° interval (Figure 4). As in our earlier study with limited variation of the linker L [24], we observe two vertical rows of low energy regions (blue areas and white contour lines) arranged with 10-11 bp periodicity, which reflects the helical period of DNA duplex. The energy minima on the left side of the plot (−90° < ρ < −20°) correspond to the L = 10n values, whereas the minima on the right side (80° < ρ < 120° ) are observed for L = 10n + 5. In other words, for L = 10n, the “canonical” structures with negative angle ρ (similar to the fibers observed experimentally [7,8]; Figure 3A) are most favorable. They have the lowest energy values; thus, it is not surprising that they were stabilized and resolved by X-ray [7] and Cryo-EM [8] methods. By contrast, for L = 10n + 5, the “novel” configurations with positive angle ρ ≈ 90° are more preferable (see Figure 3B). Their energy is predicted to be less than that in the “canonical”structures, which is consistent with the observation that nucleosomal arrays with L = 10n + 5 are less prone to fold according to sedimentation measurements [16]. Accordingly, no experiment-based models of these structures are available to date.

    Figure 4. Total energy of the two-start fibers as a function of the inclination angle ρ and the linker length L. Optimization is made in the space of three remaining fiber parameters, i.e., the radius, rise, and polar angle φ (Figure 1). Dark blue regions represent stable structures, whereas dark brown areas are those with energies higher than 40 kT. Energies less than zero are highlighted by white contour lines. White circles show the positions of optimal structures separated by approximately a half pitch of B-DNA (5-6 bp). Note that for the relatively short linkers (up to 45 bp) there are two clearly visible energy minima (bimodality patterns described earlier [24]), which become “blurry” for the longer linkers. The two optimal regions of the inclination angle are marked by the white arrows and denoted T2 and T1 (see the bottom of the plot), corresponding to the two topological families of the fibers presented in Figure 3. Bottom: Different orientations of a nucleosome illustrating variation of the inclination angle ρ from −90°to +90°.

    The difference between the two types of fibers described above (“canonical” fibers for the {L = 10n} series and “novel” configurations for {L = 10n + 5}) is not limited to the inclination of nucleosomes. More importantly, the two families of structures are characterized by different DNA linking numbers (see the next section).

    Finally, note that the increase in the linker length is accompanied by a gradual decrease in fiber stability (Figure 4). In particular, all energy values are positive for L > 57 bp, which generally agrees with the fact that two-start fibers are not formed when linkers are 50 bp or longer [9,10,41]. It is quite possible that the interdigitated one-start helix [9] is more favorable in this case (especially in the presence of linker histones).

    3.3. DNA linking number in the chromatin fibers

    In an early study by Simpson et al. [26] it was found that the number of nucleosomes reconstituted on ccDNA is approximately proportional to the number of superhelical turns formed in DNA. These results allowed considering the linking number DLk normalized per nucleosome, as a topological parameter characterizing spatial organization of the chromatin fiber independent of its length. However, a systematic analysis of the ΔLk value as a function of the fiber length was never published (to the best of our knowledge). Below, we present the results of such an analysis for the two series of linker length, L = 10n and 10n + 5.

    Figure 5A demonstrates the asymptotic behavior of ΔLkdepending on the number of nucleosomes in the fiber, N. We see that the linking number decreases significantly when N increases from 3 to 10, but then it converges rather fast, and ΔLk remains practically the same for N > 30 (with the precision ~ 0.05). Note that this convergence is somewhat faster for the {10n + 5} series (L = 25 and 45 bp).

    Figure 5. Linking number per nucleosome, ΔLk, in regular fibers with various linker lengths. (A) Dependence of ΔLkon the number of nucleosomes for fibers with L = 10n = 20, 40, 60 bp, and L = 10n + 5 = 25, 45 bp. For every L, the energetically optimal fiber conformation was selected (Figure 4). (B) Schematic representation of the topological transition T2-T1 in the two-start fiber with L = 20 bp. Here ΔLk is plotted versus changes in the inclination angle. Note that the linking number remains nearly constant except for a transition point where it abruptly changes by ~ 1. The transition point (here, ρ = 60°) depends on the linker length, L. For details see [24].(C) The limiting ΔLk values (calculated for N = 100) are shown for the two series, L = {10n} (blue squares) and {10n+ 5} (red circles). The color code is the same as in (B): the T1 type is shown in red and T2 in blue. Note that among the optimal fibers, the smallest ΔLk = −1.7 is observed for L = 33 bp (not shown).

    The curves presented in Figure 5A are naturally divided into two groups: for L = 10n + 5 the linking number is higher than −1, but for L = 10n, it is less than −1.2. This is consistent with our earlier observation of the topological polymorphism of two-start fibers [24]. We found that for all linker lengths there are two stereochemically feasible topoisomers (denoted T1 and T2) which have different linking numbers. Importantly, the optimal configurations of the fibers belong to different topological families, depending on the linker size: for L = 10n + 5 this is the topoisomer T1 that is most favorable, and for L = 10n this is the topoisomer T2. The two families of structures differ mostly by the inclination angle ρ.

    The topological transition in the case of L = 20 bp is shown schematically in Figure 5B. This transition (associated with the change in inclination angle) is caused by an abrupt 360°change in the linker DNA twisting. The stereochemical details are presented elsewhere [24]; here we wish to emphasize that this T2-to-T1 transition (in the experimental system) requires the presence of nicking-closing enzyme such as topoisomerase I. (Naturally, this limitation is valid only for the DNA with closed ends.)

    The two topological types, T1 and T2, are clearly separated in Figure 5C,where the limiting ΔLk values (calculated for N = 100) are presented for the optimal configurations of the fibers with L = 10n and 10n + 5 bp. As in Figure 5A,the distinction between the T1 and T2 types is reflected in the linking number values, which are higher than −1.0 and lower than −1.2, respectively. An increase in the linker length is accompanied by a gradual decrease in the absolute value of DLk such that for the “long”linkers L = 60-70 bp, DLk is close to −1.2 (compared to −1.5 predicted for the “short” linkers L = 10-20 bp). At the same time, the difference ΔΔLk between the {10n} and {10n + 5} series remains approximately the same for the “long” and “short” linkers - that is, the difference between L = 20 and 25 bp, and between L = 60 and 65 bp, is expected to be ΔΔLk ≈ 0.5.

    Before proceeding to the next section, we summarize the main results presented above:

    (1) The finite size effect in calculating the DNA linking number proved to be significant if N < 10 (where N is number of nucleosomes in the fiber), but it can be practically neglected if N > 20. This is important for the quantitative interpretation of the topological gel assays used to estimate ΔLk in SV40 minichromosome (N ≈ 20) [25,42,43] and in ccDNA containing 5S DNA repeats (N = 18) [26].

    (2) Our classification of two-start chromatin fibers made for the relatively short linkers

    L < 40 bp [24] still holds for the linkers spanning the interval from ~ 10 to 70 bp. The energetically optimal fibers with L = 10n belong to the topological type T2, with ΔLk varying from −1.2 to −1.4, while the fibers with L = 10n + 5 belong to the family T1, with ΔLk varying from −1.0 to −0.8.

    3.4. Relationship between nucleosome repeat length and gene expression level

    Potentially, the topological polymorphism of chromatin fibers described above can be utilized in vivo for regulation of transcription. Indeed, according to the twin domain model of Liu and Wang [44] the positive torsional stress propagates downstream and the negative stress accumulates upstream of the transcription complex (Figure 6A). The DNA torsional stress modulates the level of negative supercoiling of DNA in vivo: the positive stress decreases absolute level of DNA supercoiling, and negative stress increases it. Initially, this model was suggested for bacteria but later it was confirmed for eukaryotes as well [21,45].

    Figure 6. Chromatin fiber topology may be related to the level of gene expression in yeast. A graphical illustration of the mechanism of transcription based on the twin domain model by Liu and Wang [44]. Top: The RNA polymerase (RNAP) is moving along DNA to the right, increasing the local DNA twisting ahead of the transcription complex and leaving undertwisted DNA behind. Bottom: The DNA torsional stress modulates the level of supercoiling, so that in the DNA regions upstream of RNAP, the DNA linking number becomes less (on average) than downstream from RNAP. The two fiber topoisomers, T1 and T2, are positioned in accord with this ΔLk distribution. This model predicts that the T2 type fibers with the linker length L = 10n are stabilized upstream of RNAP, while the T1 fibers with L = 10n+5 are formed downstream from RNAP.

    Our observation of the two types of fibers (T1 and T2) having different linking numbers may be related to the transient DNA topological changes occurring during transcription. We suggest that the T1 topoisomer with ΔLk −1 is formed predominantly downstream from RNA polymerase (Figure 6A), as opposed to the T2 topoisomer with ΔLk −1.5, which is stabilized in the upstream regions (and more generally, in the regions with a low level of transcription). In this regard, it is important that the T1 and T2 topoisomers are characterized by distinct linker lengths (see above). Therefore, we expect that there might be a difference in the distribution of sizes of inter-nucleosome linkers in highly and lowly expressed genes.

    To test this hypothesis, we analyzed the nucleosome positions [46] in ~ 3,500 baker’s yeast genes that are at least 1,000 bp long [47]. We selected 25% of genes that are highly expressed (with transcription rates from 4 to 200 [48]) and the 25% of genes that are lowly expressed (transcription rates 0.1-0.9). For brevity, we refer to these genes as UP- and DOWN-genes, respectively.

    Distribution of nucleosome occurrences for UP- and DOWN-regulated genes reflects the difference in nucleosome repeat length (NRL) between these two sets of genes (Figure 6B). The peaks in the nucleosome distribution for UP-genes lag behind those for DOWN-genes, especially those that are far from the TSS—e.g., peaks at 841 bp (UP) and 884 bp (DOWN). Moreover, the peaks in the distribution of the nucleosome occupancies for DOWN-genes are higher than those for UP-genes. This result is expected, because the higher number of nucleosomes slows transcription.

    However, the following result is less trivial and thus more interesting: NRL ≈ 161 bp for the highly expressed genes and NRL ≈ 167 bp for the lowly expressed genes. In terms of the linker length, this means that L ≈ 14 bp for the UP-genes and L ≈ 20 bp for the DOWN-genes. Note that the genome-wide average for yeast is NRL = 162 bp, or L = 15 bp [12,14,15]; thus, the UP-regulated genes are more “typical” for yeast. This assessment agrees with the RNA-seq data [48] indicating that overall, the level of transcription in yeast is much more active than in higher eukaryotes. By contrast, DOWN-regulated genes can be considered as an exception in the case of yeast.

    In summary, our results are consistent with the above hypothesis that nucleosomal arrays with L ≈ 10n + 5, which are characterized by a less negative superhelical density, are transcriptionally competent. Note also that the fibers with L ≈ 10n + 5 reveal a greater plasticity [16,24], which may facilitate formation of gene loops [49,50], thereby inducing transcription of the corresponding genes. Accordingly, in the silent (repressed) genes the predominant linker length is L ≈ 10n, which corresponds to a higher superhelical density and a higher stability of the chromatin fiber.

    Figure 7. Nucleosome occurrences for two groups of yeast S. cerevisiae genes. Positions of nucleosome dyads relative to the transcription start site (TSS) are calculated for nucleosome fragments 147-152 bp in length [15,46]. Note the nucleosome-depleted region upstream from TSS [64]. The red curve represents the 25% of genes that are highly expressed (UP-genes) and the blue curve shows the 25% of genes that are lowly expressed (DOWN-genes). The nucleosome occurrences are normalized by the number of genes in each set (i.e., 860 genes). The running averages of 51 bp are shown. Averaging the distances between the peaks, we obtained NRL = 161.2 (±3.5) for UP-genes and NRL = 167.2 (±2.9) for DOWN-genes.

    Naturally, this correlation between gene expression level and NRL raises many questions about the cellular mechanisms responsible for transient stabilization of one of the two fiber topoisomers. In particular, it would be interesting to see if there are any DNA sequence patterns distinguishing the two groups of genes (and the two types of nucleosome packaging). If the tendency observed for baker’s yeast also holds for other species, these intriguing questions should be the subject of a separate investigation.

    4. Conclusion

    We have expanded our earlier analysis of two-start chromatin fibers [24] to those with long linkers, up to L = 70 bp (NRL = 217 bp). The new results corroborate the main conclusion made earlier that fiber topology depends on the linker length L. For the series {L = 10n}, the energetically optimal topoisomers belong to the family T2, with the DNA linking number about −1.5, whereas for {L = 10n + 5}, the T1 topoisomers are more favorable, with ΔLk ≈ −1.0 (Figure 3).

    The calculated T2 forms closely match experimentally observed structures for L = 20, 30 and 40 bp. The energy map (Figure 4) suggests that the two-start fibers for “long” linkers L = 50, 60 and 70 bp are relatively unstable (compared to L = 20-40 bp). This is consistent with Routh et al. [9] data indicating that for L = 50 bp, the chromatin fibers are not formed without linker histone. (When the histone H5 is added, an alternative structure is formed, probably an interdigitized one-start superhelix, computational analysis of which goes beyond the limits of this study.)

    By contrast, the predicted T1 topoisomers are drastically different from the known fiber structures [7,8]. Locally, the T1 and T2 forms are characterized by different inclination of the nucleosomal disks (Figure 3). In terms of “global” organization of DNA, these forms comprise two distinct topological families with different DNA linking numbers (Figure 5). Conformational transition between the T1 and T2 topoisomers is possible only in the presence of nicking-closing enzymes (provided that the DNA ends are restrained). Note that our computations agree with the finding of Correll et al. [16] that the fibers with L = 10n + 5 = 25 bp are less stable than the fibers with L = 10n = 20 and 30 bp. This may be one of the reasons why the “new” topoisomer T1 (with L = 10n + 5) was not observed earlier.

    In addition, we tested our prediction [24] concerning the topological difference between the two types of fibers with L = 20 and 25 bp. Our approach is similar to that described by Simpson et al. [26]; the main difference is that in our case these are tandem arrays of the “601” sequences [11] instead of the 5S DNA repeats used earlier [26]. Our preliminary results support the predicted difference of ΔΔLk ≈0.5 between the two topoisomers (T. Nikitina, D.N., S.A. Grigoryev and V.B.Z., unpublished observation). We consider this as a proof of principle and anticipate that using topological gel assays will allow us to make a detailed quantitative comparison between the two types of chromatin fiber organization.

    For the first time, we have systematically analyzed how the finite size of chromatin fibers affects the calculated DNA linking number. Our results are important for numerical interpretation of the topological gel assays made for strongly positioned nucleosomes such as “601” [11] or 5S DNA [26]. In particular, if the array contains N ≈ 5 positioned nucleosomes, the DNA linking number differs from its “ideal” limiting value by 0.1 or even by 0.2, depending on the linker length (Figure 5A). Therefore, appropriate adjustments are necessary to account for the size of the nucleosomal array.

    The same reasoning is applicable to the nucleosome positioning in vivo. In yeast, a typical nucleosomal organization is represented by relatively short clusters of N £ 5 nucleosomes, separated by gaps [15,51,52]. Therefore, instead of using the “ideal” ΔLk values which are correct only for “long” arrays, one has to consider the finite size effect described in Figure 5A.

    Earlier, we hypothesized [24] that the different topology and flexibility of the two types of fibers (T2 with L = 10n and T1 with L = 10n + 5 bp) may be utilized by cells in functionally distinct parts of the genome. In particular, we suggested that highly and lowly expressed genes may have different L values (on average). Here, we present data for yeast supporting this hypothesis (Figure 6B). It would be interesting to see whether this topological mechanism of transcription regulation is applicable to higher eukaryotes as well. For example, the data on genome-wide nucleosome positioning provided by Teif et al. [53] for three murine cell lines suggests that the average NRL (and the linker length L) are changed upon cell differentiation. Note, however, that the higher eukaryotic chromatin contains significant amounts of linker histone H1, and the NRL strongly depends on this amount [54,55]. Therefore, analysis of a possible interplay between DNA topology and the level of transcription has to take into account the role played by histone H1 in electrostatic neutralization of the linker DNA and stabilization of chromatin fiber [56].

    We consider the topological mechanism accounting for distinct organization of transcriptionally active chromatin not instead of, but rather in addition to the alternative mechanisms proposed earlier, such as partial unwrapping of nucleosomal DNA due to the loss of histones H2A-H2B [57] or formation of “reverse nucleosomes” [58,59] in the course of transcription (see recent review by Teves and Henikoff [60]).

    Our results may reflect a more general tendency of chromosomal domains containing active or repressed genes to retain topologically distinct higher-order structures. Indeed, transcriptionally silent domains were shown to acquire a stable negative supercoiling [61], which agrees with our findings: (i) the computational prediction [24] that {10n} chromatin is more negatively supercoiled than {10n + 5} chromatin; and (ii) the predominant occurrence of linker L ≈ 10n in genes with a low level of expression (Figure 6B).

    In this regard, it is remarkable that histone acetylation reduces the absolute value of DNA linking number from 1.0 to 0.8 [27]. The histone acetylation is one of the epigenetic markers indicating the increased level of transcription. Therefore, the observation made by Norton et al. [27] fits nicely into our hypothesis that the reduced level of DNA supercoiling correlates with the high level of transcription.

    Acknowledgements

    We are grateful to Sergei Grigoryev and Fedor Kouzine for valuable discussions and to George Leiman for text editing. The research was supported by the Intramural Research Program of the National Institutes of Health (Center for Cancer Research, NCI) (V.B.Z.), the Start-Up Fund of the Rochester Institute of Technology and the National Institute of General Medical Sciences under Award Number R15GM116102 (F.C.).

    Conflict of Interest

    The authors declare no conflict of interest.

    [1] Berger G, Bitterman R, Azzam ZS (2015) The human microbiota: the rise of an "empire". Rambam Maimonides Med J 6: 1–5.
    [2] Peek RM, Blaser MJ (2002) Helicobacter pylori and gastrointestinal tract adenocarcinomas. Nat Rev Cancer 2: 28–37. doi: 10.1038/nrc703
    [3] Human Microbiome Project Consortium (2012) Structure, function and diversity of the healthy human microbiome. Nature 486: 207–214. doi: 10.1038/nature11234
    [4] Charlson ES, Chen J, Custers-Allen R, et al. (2010) Disordered microbial communities in the upper respiratory tract of cigarette smokers. PLoS One 5: e15216. doi: 10.1371/journal.pone.0015216
    [5] Blaser MJ, Atherton JC (2004) Helicobacter pylori persistence: biology and disease. J Clin Invest 113: 321–333. doi: 10.1172/JCI20925
    [6] Roberts AP, Kreth J (2014) The impact of horizontal gene transfer on the adaptive ability of the human oral microbiome. Front Cell Infect Mi 4: 124.
    [7] Kort R, Caspers M, Graff A, et al. (2014) Shaping the oral microbiota through intimate kissing. Microbiome 2: 41. doi: 10.1186/2049-2618-2-41
    [8] Willey JP (2008) Harley and Klein's Microbiology, In: Joanne MW, Linda MS, Christopher JW, 7 Eds., New York: McGraw-Hill Higher Education.
    [9] Wilson M (2008) The indigenous microbiota of the gastrointestinal tract, In: Wilson M, Author, Bacteriology of Humans: An Ecological Perspective, Oxford: Blackwell Publishing, 266–326.
    [10] Miller MB, Bassler BL (2001) Quorum sensing in bacteria. Ann Rev Microbiol 55: 165–199. doi: 10.1146/annurev.micro.55.1.165
    [11] Gerald PC (2013) Oral microbiome homeostasis: The new frontier in oral care therapies. J Dent Oral Disord Ther 1: 3.
    [12] Joshi HM, Toleti RS (2009) Nutrition induced pleomorphism and budding mode of reproduction in Deinococcus radiodurans. BMC Res Notes 2: 123. doi: 10.1186/1756-0500-2-123
    [13] Dewhirst FE, Chen T, Izard J (2010) The human oral microbiome. J Bacteriol 192: 5002–5017. doi: 10.1128/JB.00542-10
    [14] Beck JD, Offenbacher S (2005) Systemic effects of periodontitis: epidemiology of periodontal disease and cardiovascular disease. J Periodontol 76: 2089–2100. doi: 10.1902/jop.2005.76.11-S.2089
    [15] Munson MA, Banerjee A, Watson TF, et al. (2004) Molecular analysis of the microflora associated with dental caries. J Clin Microbiol 42: 3023–3029. doi: 10.1128/JCM.42.7.3023-3029.2004
    [16] Genco RJ, Grossi SG, Ho A, et al. (2005) A proposed model linking inflammation to obesity, diabetes, and periodontal infections. J Periodontol 76: 2075–2084. doi: 10.1902/jop.2005.76.11-S.2075
    [17] Joshipura KJ, Hung HC, Rimm EB, et al. (2003) Periodontal disease, tooth loss, and incidence of ischemic stroke. Stroke 34: 47–52. doi: 10.1161/01.STR.0000052974.79428.0C
    [18] Awano S, Ansai T, Takata Y, et al. (2008) Oral health and mortality risk from pneumonia in the elderly. J Dent Res 87: 334–339. doi: 10.1177/154405910808700418
    [19] Ford BJ, University of California Berkeley, Berkeley, 2008. Available from: http://www.ucmp.berkeley.eduhistoryleeuwenhoek.html.
    [20] Loesche WJ (1975) Chemotherapy of dental plaque infections. Oral Sci Rev 9: 65–107.
    [21] Wilson M (2005) Microbial inhabitants of humans: their ecology and role in health and disease, Cambridge: Cambridge University Press.
    [22] Alcaraz LD, Belda‐Ferre P, Cabrera‐Rubio R, et al. (2012) Identifying a healthy oral microbiome through metagenomics. Clin Microbiol Infec 18: 54–57.
    [23] Avila M, Ojcius DM, Yilmaz O (2009) The oral microbiota: living with a permanent guest. DNA Cell Biol 28: 405–411. doi: 10.1089/dna.2009.0874
    [24] Peterson J, Garges S, Giovanni M, et al. (2009) The NIH Human microbiome project. Gen Res 19: 2317–2323. doi: 10.1101/gr.096651.109
    [25] Mitreva M, Mardis ER (2009) Large-scale sequencing and analytical processing of ESTs, In: Parkinson J, Author, Expressed Sequence Tags (ESTs) Methods in Molecular Biology (Methods and Protocols), Humana Press, 153–187.
    [26] Qin J, Li R, Raes J, et al. (2010) A human gut microbial gene catalogue established by metagenomic sequencing. Nature 464: 59–65. doi: 10.1038/nature08821
    [27] Kreth J, Merritt J, Shi W, et al. (2005) Competition and coexistence between Streptococcus mutans and Streptococcus sanguinis in the dental biofilm. J Bacteriol 187: 7193–7203. doi: 10.1128/JB.187.21.7193-7203.2005
    [28] Jenkinson HF, Lamont RJ (2005) Oral microbial communities in sickness and in health. Trends Microbiol 13: 589–595. doi: 10.1016/j.tim.2005.09.006
    [29] Chalmers NI, Palmer RJ, Cisar JO, et al. (2008) Characterization of a Streptococcus sp.-Veillonella sp. community micromanipulated from dental plaque. J Bacteriol 190: 8145–8154.
    [30] Kleinberg I (2002) A mixed-bacteria ecological approach to understanding the role of the oral bacteria in dental caries causation: an alternative to Streptococcus mutans and the specific-plaque hypothesis. Crit Rev Oral Biol Med 13: 108–125. doi: 10.1177/154411130201300202
    [31] Davey M, Otoole GA (2000) Microbial biofilms: from ecology to molecular genetics. Microbiol Mol Biol Rev 64: 847–867. doi: 10.1128/MMBR.64.4.847-867.2000
    [32] Kreft JU (2004) Biofilms promote altruism. Microbiology 150: 2751–2760. doi: 10.1099/mic.0.26829-0
    [33] Irie Y, Parsek MR (2008) Quorum sensing and microbial biofilms. Curr Top Microbiol 322: 67–84.
    [34] Kolenbrander PE, Andersen RN, Blehert DS, et al. (2002) Communication among oral bacteria. Microbiol Mol Biol Rev 66: 486–505.
    [35] Kuramitsu HK, He X, Lux R, et al. (2007) Interspecies interactions within oral microbial communities. Microbiol Mol Biol Rev 71: 653–670. doi: 10.1128/MMBR.00024-07
    [36] Kolenbrander PE (2000) Oral microbial communities: biofilms, interactions, and genetic systems. Annu Rev Microbiol 54: 413–437. doi: 10.1146/annurev.micro.54.1.413
    [37] McNab R, Ford SK, El-Sabaeny A, et al. (2003) LuxS-based signaling in Streptococcus gordonii: autoinducer 2 controls carbohydrate metabolism and biofilm formation with Porphyromonas gingivalis. J Bacteriol 185: 274–284. doi: 10.1128/JB.185.1.274-284.2003
    [38] Kreth J, Merritt J, Shi W, et al. (2005) Coordinated bacteriocin production and competence development: a possible mechanism for taking up DNA from neighbouring species. Mol Microbiol 57: 392–404. doi: 10.1111/j.1365-2958.2005.04695.x
    [39] van der Ploeg JR (2005) Regulation of bacteriocin production in Streptococcus mutans by the quorum-sensing system required for development of genetic competence. J Bacteriol 187: 3980–3989. doi: 10.1128/JB.187.12.3980-3989.2005
    [40] Webb JS, Givskov M, Kjelleberg S (2003) Bacterial biofilms: prokaryotic adventures in multicellularity. Curr Opin Microbiol 6: 578–585.
    [41] Antunes LCM, Ferreira RB, Buckner MM, et al. (2010) Quorum sensing in bacterial virulence. Microbiology 156: 2271–2282. doi: 10.1099/mic.0.038794-0
    [42] Jakubovics NS, Gill SR, Vickerman MM, et al. (2008) Role of hydrogen peroxide in competition and cooperation between Streptococcus gordonii and Actinomyces naeslundii. FEMS Microbiol Ecol 66: 637–644. doi: 10.1111/j.1574-6941.2008.00585.x
    [43] Edwards AM, Grossman TJ, Rudney JD (2006) Fusobacterium nucleatum transports noninvasive Streptococcus cristatus into human epithelial cells. Infect Immun 74: 654–662. doi: 10.1128/IAI.74.1.654-662.2006
    [44] Zhang G, Chen R, Rudney JD (2008) Streptococcus cristatus attenuates Fusobacterium nucleatum‐induced interleukin‐8 expression in oral epithelial cells. J Periodontal Res 43: 408–416. doi: 10.1111/j.1600-0765.2007.01057.x
    [45] Yilmaz O (2008) The chronicles of Porphyromonas gingivalis: the microbium, the human oral epithelium and their interplay. Microbiology 154: 2897–2903.
    [46] Bik EM, Long CD, Armitage GC, et al. (2010) Bacterial diversity in the oral cavity of 10 healthy individuals. ISME J 4: 962–974. doi: 10.1038/ismej.2010.30
    [47] Trim RD, Skinner MA, Farone MB, et al. (2011) Use of PCR to detect Entamoeba gingivalis in diseased gingival pockets and demonstrate its absence in healthy gingival sites. Parasitol Res 109: 857–864. doi: 10.1007/s00436-011-2312-9
    [48] Bahrani-Mougeot FK, Paster BJ, Coleman S, et al. (2008) Diverse and novel oral bacterial species in blood following dental procedures. J Clin Microbiol 46: 2129–2132. doi: 10.1128/JCM.02004-07
    [49] Ghannoum MA, Jurevic RJ, Mukherjee PK, et al. (2010) Characterization of the oral fungal microbiome (mycobiome) in healthy individuals. PLoS Pathog 6: e1000713. doi: 10.1371/journal.ppat.1000713
    [50] Wang J, Gao Y, Zhao F (2016) Phage-bacteria interaction network in human oral microbiome. Environ Microbiol 18: 2143–2158. doi: 10.1111/1462-2920.12923
    [51] Baker JL, Bor B, Agnello M, et al. (2017) Ecology of the oral microbiome: beyond bacteria. Trends Microbiol 25: 362–374.
    [52] Wahida A, Ritter K, Horz HP (2016) The Janus-Face of bacteriophages across human body habitats. PLoS Pathog 12: e1005634. doi: 10.1371/journal.ppat.1005634
    [53] Pride DT, Salzman J, Haynes M, et al. (2012) Evidence of a robust resident bacteriophage population revealed through analysis of the human salivary virome. ISME J 6: 915–926. doi: 10.1038/ismej.2011.169
    [54] Ly M, Abeles SR, Boehm TK, et al. (2014) Altered oral viral ecology in association with periodontal disease. Mbio 5: e01133-14.
    [55] Arduino PG, Porter SR (2008) Herpes Simplex Virus Type 1 infection: overview on relevant clinic pathological features. J Oral Pathol Med 37: 107–121.
    [56] Wu YM, Yan J, Ojcius DM, et al. (2007) Correlation between infections with different genotypes of human cytomegalovirus and Epstein-Barr virus in subgingival samples and periodontal status of patients. J Clin Microbiol 45: 3665–3670.
    [57] Giacaman RA, Asrani AC, Gebhard KH, et al. (2008) Porphyromonas gingivalis induces CCR5-dependent transfer of infectious HIV-1 from oral keratinocytes to permissive cells. Retrovirology 5: 1. doi: 10.1186/1742-4690-5-1
    [58] Herzberg MC, Weinberg A, Wahl SM (2006) The oral epithelial cell and first encounters with HIV-1. Adv Dent Res 19: 158–166. doi: 10.1177/154407370601900128
    [59] Loning T, Ikenberg H, Becker J, et al. (1985) Analysis of oral papillomas, leukoplakias, and invasive carcinomas for human papillomavirus type related DNA. J Invest Dermatol 84: 417–420. doi: 10.1111/1523-1747.ep12265517
    [60] Kumaraswamy KL, Vidhya M (2011) Human papilloma virus and oral infections: an update. J Cancer Res 7: 120.
    [61] Pride DT, Salzman J, Relman DA (2012) Comparisons of clustered regularly interspaced short palindromic repeats and viromes in human saliva reveal bacterial adaptations to salivary viruses. Environ Microbiol 14: 2564–2576. doi: 10.1111/j.1462-2920.2012.02775.x
    [62] Abeles SR, Robles-Sikisaka R, Ly M, et al. (2014) Human oral viruses are personal, persistent and gender-consistent. ISME J 8: 1753–1767. doi: 10.1038/ismej.2014.31
    [63] Stevens RH, Porras OD, Delisle AL (2009) Bacteriophages induced from lysogenic root canal isolates of Enterococcus faecalis. Oral Microbial Immun 24: 278–284. doi: 10.1111/j.1399-302X.2009.00506.x
    [64] Pride DT, Salzman J, Haynes M, et al. (2012) Evidence of a robust resident bacteriophage population revealed through analysis of the human salivary virome. ISME J 6: 915–926. doi: 10.1038/ismej.2011.169
    [65] Lepp PW, Brinig MM, Ouverney CC, et al. (2004) Methanogenic Archaea and human periodontal disease. P Natl Acad Sci USA 101: 6176–6181. doi: 10.1073/pnas.0308766101
    [66] Matarazzo F, Ribeiro AC, Feres M, et al. (2011) Diversity and quantitative analysis of Archaea in aggressive periodontitis and periodontally healthy subjects. J Clin Periodontol 38: 621–627. doi: 10.1111/j.1600-051X.2011.01734.x
    [67] Diaz PI, Chalmers NI, Rickard AH, et al. (2006) Molecular characterization of subject-specific oral microflora during initial colonization of enamel. Appl Environ Microb 72: 2837–2848. doi: 10.1128/AEM.72.4.2837-2848.2006
    [68] Smillie CS, Smith MB, Friedman J, et al. (2011) Ecology drives a global network of gene exchange connecting the human microbiome. Nature 480: 241–244.
    [69] Yaron S, Kolling GL, Simon L, et al. (2000) Vesicle-mediated transfer of virulence genes from Escherichia coli O157: H7 to other enteric vacteria. Appl Environ Microb 66: 4414–4420. doi: 10.1128/AEM.66.10.4414-4420.2000
    [70] Mashburn-Warren LM, Whiteley M (2006) Special delivery: vesicle trafficking in prokaryotes. Mol Microbiol 61: 839–846. doi: 10.1111/j.1365-2958.2006.05272.x
    [71] Warburton PJ, Palmer RM, Munson MA, et al. (2007) Demonstration of in vivo transfer of doxycycline resistance mediated by a novel transposon. J Antimicrob Chemo 60: 973–980. doi: 10.1093/jac/dkm331
    [72] Seville LA, Patterson AJ, Scott KP, et al. (2009) Distribution of tetracycline and erythromycin resistance genes among human oral and fecal metagenomic DNA. Microb Drug Resist 15: 159–166. doi: 10.1089/mdr.2009.0916
    [73] Ciric L, Brouwer MS, Mullany P (2014) Minocycline resistance in an oral Streptococcus infantis isolate is encoded by tet (S) on a novel small, low copy number plasmid. FEMS Microbiol Lett 353: 106–115. doi: 10.1111/1574-6968.12410
    [74] Connell SR, Tracz DM, Nierhaus KH (2003) Ribosomal protection proteins and their mechanism of tetracycline resistance. Antimicrob Agents Ch 47: 3675–3681. doi: 10.1128/AAC.47.12.3675-3681.2003
    [75] Nasidze I, Li J, Quinque D, et al. (2009) Global diversity in the human salivary microbiome. Gen Res 19: 636–643. doi: 10.1101/gr.084616.108
    [76] Li Y, Ismail AI, Ge Y, et al. (2007) Similarity of bacterial populations in saliva from African-American mother-child dyads. J Clin Microbiol 45: 3082–3085.
    [77] Corby PM, Bretz WA, Hart TC (2007) Heritability of oral microbial species in caries-active and caries-free twins. Twin Res Hum Genet 10: 821–828. doi: 10.1375/twin.10.6.821
    [78] Edlund A, Santiago-Rodriguez TM, Boehm TK, et al. (2015) Bacteriophage and their potential roles in the human oral cavity. J Oral Microbial 7: 27423.
    [79] De Paepe M, Leclerc M, Tinsley CR, et al. (2014) Bacteriophages: an underestimated role in human and animal health? Front Cell Infect Mi 4: 39.
    [80] Dominguez-Bello MG, Costello EK, Contreras M, et al. (2010) Delivery mode shapes the acquisition and structure of the initial microbiota across multiple body habitats in newborns. P Natl Acad Sci USA 107: 11971–11975.
    [81] Holgerson PL, Harnevik L, Hernell O, et al. (2011) Mode of birth delivery affects oral microbiota in infants. J Dent Res 90: 1183–1188.
    [82] Holgerson PL, Vestman NR, Claesson R, et al. (2013) Oral microbial profile discriminates breastfed from formula-fed infants. J Pediatr Gastr Nutr 56: 127. doi: 10.1097/MPG.0b013e31826f2bc6
    [83] Vestman NR, Timby N, Holgerson PL, et al. (2013) Characterization and in vitro properties of oral lactobacilli in breastfed infants. BMC Microbiol 13: 1. doi: 10.1186/1471-2180-13-1
    [84] Baca P, Castillo AM, Liebana, MJ, et al. (2012) Horizontal transmission of Streptococcus mutans in school children. Med Oral Patol Oral 17: 495–500.
    [85] Stahringer SS, Clemente JC, Corley RP (2012) Nurture trumps nature in a longitudinal survey of salivary bacterial communities in twins from early adolescence to early adulthood. Genome Res 22: 2146–2152.
    [86] Brook I, Gober AE (2008) Recovery of potential pathogens in the nasopharynx of healthy and otitis media-prone children and their smoking and nonsmoking parents. Ann Otol Rhinol Laryngol 117: 727–730.
    [87] Arcavi L, Benowitz NL (2004) Cigarette smoking and infection. Arch Intern Med 164: 2206–2216.
    [88] Tamashiro E, Xiong G, Anselmo-Lima WT, et al. (2009) Cigarette smoke exposure impairs respiratory epithelial ciliogenesis. Am J Rhinol Allergy 23: 117–122.
    [89] El Ahmer OR, Essery SD, Saadi AT, et al. (1999) The effect of cigarette smoke on adherence of respiratory pathogens to buccal epithelial cells. FEMS Immuno Med Microbiol 23: 27–36. doi: 10.1111/j.1574-695X.1999.tb01713.x
    [90] Sapkota AR, Berger S, Vogel TM (2010) Human pathogens abundant in the bacterial metagenome of cigarettes. Environ Health Perspect 118: 351–356.
    [91] Brook I, Gober AE (2005) Recovery of potential pathogens and interfering bacteria in the nasopharynx of smokers and nonsmokers. CHEST J 127: 2072–2075. doi: 10.1378/chest.127.6.2072
    [92] Winkelhoff AV, Bosch-Tijhof CJ, Winkel EG, et al. (2001) Smoking affects the subgingival microflora in periodontitis. J Periodontol 72: 666–671.
    [93] Fullmer SC, Preshaw PM, Heasman PA (2009) Smoking cessation alters subgingival microbial recolonization. J Dent Res 88: 524–528. doi: 10.1177/0022034509338676
    [94] Madhi SA, Adrian P, Kuwanda L, et al. (2007) Long-term effect of pneumococcal conjugate vaccine on nasopharyngeal colonization by Streptococcus pneumonia and associated interactions with Staphylococcus aureus and Haemophilus influenzae colonization in HIV-infected and HIV-uninfected children. J Infect Dis 196: 1662–1666. doi: 10.1086/522164
    [95] Regev-Yochay G, Trzciński K, Thompson CM, et al. (2006) Interference between Streptococcus pneumoniae and Staphylococcus aureus: in vitro hydrogen peroxide-mediated killing by Streptococcus pneumoniae. J Bacteriol 188: 4996–5001. doi: 10.1128/JB.00317-06
    [96] McNally LM, Jeena PM, Gajee K, et al. (2006) Lack of association between the nasopharyngeal carriage of Streptococcus pneumoniae and Staphylococcus aureus in HIV-1-infected South African children. J Infect Dis 194: 385–390.
    [97] Darveau RP (2010) Periodontitis: a polymicrobial disruption of host homeostasis. Nat Rev Microbiol 8: 481–490. doi: 10.1038/nrmicro2337
    [98] Armitage GC (1999) Development of a classification system for periodontal diseases and conditions. Ann Periodontol 4: 1–6.
    [99] Socransky SS, Haffajee AD, Cugini MA, et al. (1998) Microbial complexes in subgingival plaque. J Clin Periodontol 25: 134–144.
    [100] Kumar PS, Griffen AL, Barton JA, et al. (2003) New bacterial species associated with chronic periodontitis. J Dent Res 82: 338–344. doi: 10.1177/154405910308200503
    [101] Nyvad B, Kilian M (1987) Microbiology of the early colonization of human enamel and root surfaces in vivo. Eur J Oral Sci 95: 369–380. doi: 10.1111/j.1600-0722.1987.tb01627.x
    [102] Zijnge V, van Leeuwen MBM, Degener JE, et al. (2010) Oral biofilm architecture on natural teeth. PLoS One 5: e9321.
    [103] He XS, Shi WY (2009) Oral microbiology: past, present and future. Int J Oral Sci 1: 47. doi: 10.4248/ijos.09029
    [104] Yamada T, Takahashi-Abbe S, Abbe K (1985) Effects of oxygen on pyruvate formate-lyase in situ and sugar metabolism of Streptococcus mutans and Streptococcus sanguis. Infect Immun 47: 129–134.
    [105] Takahashi N, Nyvad B (2011) The role of bacteria in the caries process ecological perspectives. J Dent Res 90: 294–303.
    [106] Downes J, Mantzourani M, Beighton D (2011) Scardovia wiggsiae sp. nov., isolated from the human oral cavity and clinical material, and emended descriptions of the genus Scardovia and Scardovia inopinata. Int J Syst Evol Microbiol 61: 25–29.
    [107] Kaur R, Gilbert SC, Sheehy EC, et al. (2013) Salivary levels of Bifidobacteria in caries free and caries active children. Int J Paediatr Dent 23: 32–38.
    [108] Munson MA, Pitt-Ford T, Chong B, et al. (2002) Molecular and cultural analysis of the microflora associated with endodontic infections. J Dent Res 81: 761–766.
    [109] Burne RA, Marquis RE (2000) Alkali production by oral bacteria and protection against dental caries. FEMS Microbiol Lett 193: 1–6. doi: 10.1111/j.1574-6968.2000.tb09393.x
    [110] Razavi A, Gmür R, Imfeld T, et al. (2007) Recovery of Enterococcus faecalis from cheese in the oral cavity of healthy subjects. Oral Microbiol Immun 22: 248–251. doi: 10.1111/j.1399-302X.2006.00349.x
    [111] Kampfer J, Gohring TN, Attin T, et al. (2007) Leakage of food borne Enterococcus faecalis through temporary fillings in a simulated oral environment. Int Endontic J 40: 471–477. doi: 10.1111/j.1365-2591.2007.01252.x
    [112] Raghavendran K, Mylotte JM, Scannapieco FA (2007) Nursing home‐associated pneumonia, hospital‐acquired pneumonia and ventilator‐associated pneumonia: the contribution of dental biofilms and periodontal inflammation. Periodontology 44: 164–177.
    [113] Scannapieco FA (1999) Role of oral bacteria in respiratory infection. J Periodontol 70: 793–802. doi: 10.1902/jop.1999.70.7.793
    [114] Vincent JL (1999) Prevention of nosocomial bacterial pneumonia. Thorax 54: 544–549. doi: 10.1136/thx.54.6.544
    [115] Gil-Perotin S, Ramirez P, Marti V, et al. (2012) Implications of endotracheal tube biofilm in ventilator-associated pneumonia response: a state of concept. Crit Care 16: 1–9.
    [116] Marik PE (2001) Aspiration pneumonitis and aspiration pneumonia. Engl J Med 344: 665–671. doi: 10.1056/NEJM200103013440908
    [117] Scannapieco FA (2013) The oral microbiome: its role in health and in oral and systemic infections. Clin Microbiol Newsl 35: 163–169. doi: 10.1016/j.clinmicnews.2013.09.003
    [118] Borgnakke WS, Ostalo PV, Taylor GW, et al. (2013) Effect of periodontal disease on diabetes: systematic review of epidemiologic observational evidence. J Periodontol 84: 135–152. doi: 10.1902/jop.2013.132001
    [119] Segata N, Haake SK, Mannon P, et al. (2012) Composition of the adult digestive tract bacterial microbiome based on seven mouth surfaces, tonsils, throat and stool samples. Genome Biol 13: R42. doi: 10.1186/gb-2012-13-6-r42
    [120] Anand PS, Nandakumar K, Shenoy KT (2006) Are dental plaque, poor oral hygiene, and periodontal disease associated with Helicobacter pylori infection? J Periodontol 77: 692–698. doi: 10.1902/jop.2006.050163
    [121] Whitmore SE, Lamont RJ (2014) Oral bacteria and cancer. PLoS Pathog 10: e1003933.
    [122] Atanasova KR, Yilmaz O (2014) Looking in the Porphyromonas gingivalis cabinet of curiosities: the microbium, the host and cancer association. Mol Oral Microbiol 29: 55–66. doi: 10.1111/omi.12047
    [123] Ahn J, Chen CY, Hayes RB (2012) Oral microbiome and oral and gastrointestinal cancer risk. Cancer Cause Control 23: 399–404. doi: 10.1007/s10552-011-9892-7
    [124] Kaur S, White S, Bartold PM (2013) Periodontal disease and rheumatoid arthritis a systematic review. J Dent Res 92: 399–408. doi: 10.1177/0022034513483142
    [125] Kamer AR, Dasanayake AP, Craig RG, et al. (2008) Alzheimer's disease and peripheral infections: the possible contribution from periodontal infections, model and hypothesis. J Alzheimers Dis 13: 437–449. doi: 10.3233/JAD-2008-13408
    [126] Ide M, Papapanou PN (2013) Epidemiology of association between maternal periodontal disease and adverse pregnancy outcomes-systematic review. J Clin Periodontol 40: S181–S194.
    [127] Zaura E, Keijser BJ, Huse SM, et al. (2009) Defining the healthy "core microbiome" of oral microbial communities. BMC Microbiol 9: 259.
    [128] Lazarevic V, Whiteson K, Hernandez D, et al. (2010) Study of inter-and intra-individual variations in the salivary microbiota. BMC Genomics 11: 523. doi: 10.1186/1471-2164-11-523
    [129] Moon JH, Lee JH (2016) Probing the diversity of healthy oral microbiome with bioinformatics approaches. BMB reports 49: 662. doi: 10.5483/BMBRep.2016.49.12.164
    [130] Baas-Becking LGM (1934) Geobiologie; of inleiding tot de milieukunde. WP Van Stockum & Zoon NV.
    [131] Loesche WJ (1969) Oxygen sensitivity of various anaerobic bacteria. Appl Microbiol 18: 723–727.
    [132] Ueki A, Akasaka H, Suzuki D, et al. (2006) Xylanibacter oryzae gen. nov., sp. nov., a novel strictly anaerobic, Gram negative, xylanolytic bacterium isolated from rice-plant residue in flooded rice-field soil in Japan. Int J Syst Evol Microbiol 56: 2215–2221.
    [133] Ausec L, Kraighera B, Mandic-Mulec I (2009) Differences in the activity and bacterial community structure of drained grassland and forest peat soils. Soil Biol Biochem 41: 1874–1881. doi: 10.1016/j.soilbio.2009.06.010
    [134] Castro HF, Classen AT, Austin EE, et al. (2010) Soil microbial community responses to multiple experimental climate change drivers. Appl Environ Microb 76: 999–1007. doi: 10.1128/AEM.02874-09
    [135] Contreras M, Costello EK, Hidalgo G, et al. (2010) The bacterial microbiota in the oral mucosa of rural Amerindians. Microbiology 156: 3282–3287. doi: 10.1099/mic.0.043174-0
    [136] Li K, Bihan M, Methé BA (2013) Analyses of the stability and core taxonomic memberships of the Human microbiome. PLoS One 8: e63139. doi: 10.1371/journal.pone.0063139
    [137] Zaura E, Nicu EA, Krom BP, et al. (2014) Acquiring and maintaining a normal oral microbiome: current perspective. Front Cell Infect Mi 4.
    [138] Galiminas V, Hall MW, Singh N, et al. (2014) Bacterial community composition of chronic periodontitis and novel oral sampling sites for detecting disease indicators. Microbiome 2: 32.
    [139] Sun B, Zhou D, Tu J, et al. (2017) Evaluation of the Bacterial Diversity in the Human Tongue Coating Based on Genus-Specific Primers for 16S rRNA Sequencing. Biomed Res Int 2017: 8184160.
    [140] Hall MW, Singh N, Ng KF, et al. (2017) Inter-personal diversity and temporal dynamics of dental, tongue, and salivary microbiota in the healthy oral cavity. NPJ Biofilm Microbiome 3: 2. doi: 10.1038/s41522-016-0011-0
    [141] Takeshita T, Kageyama S, Furuta M, et al. (2016) Bacterial diversity in saliva and oral health-related conditions: the Hisayama Study. Sci Rep 6: 22164. doi: 10.1038/srep22164
    [142] Li J, Quinque D, Horz HP, et al. (2014) Comparative analysis of the human saliva microbiome from different climate zones: Alaska, Germany, and Africa. BMC Microbiol 14: 316. doi: 10.1186/s12866-014-0316-1
    [143] Huse SM, Ye Y, Zhou Y, et al. (2012) A Core human microbiome as viewed through 16S rRNA sequence clusters. PLoS One 7: e34242. doi: 10.1371/journal.pone.0034242
    [144] Gevers D, Knight R, Petrosino JF, et al. (2012) The human microbiome project: A community resource for the healthy human microbiome. PLoS Biol 10: e1001377. doi: 10.1371/journal.pbio.1001377
    [145] Walter J, Ley R (2011) The human gut microbiome: ecology and recent evolutionary changes. Annu Rev Microbiol 65: 411–429. doi: 10.1146/annurev-micro-090110-102830
    [146] Xiao E, Mattos M, Vieira GHA, et al. (2017) Diabetes enhances IL-17 expression and alters the oral microbiome to increase its pathogenicity. Cell Host Microbe 22: 120–128. doi: 10.1016/j.chom.2017.06.014
    [147] Grover HS, Blaggana A, Jain Y, et al (2015) Detection and measurement of oral malodor in chronic periodontitis patients and its correlation with levels of select oral anaerobes in subgingival plaque. Contemp Clin Dent 6: S181–S187. doi: 10.4103/0976-237X.166825
    [148] Hoceini A, Khelil NK, Ben-Yelles I, et al. (2016) Caries-related factors and bacterial composition of supragingival plaques in caries free and caries active Algerian adults. Asian Pac J Trop Biomed 6: 720–726. doi: 10.1016/j.apjtb.2016.06.011
    [149] Horner-Devine MC, Lage M, Hughes JB, et al. (2004) A taxa-area relationship for bacteria. Nature 432: 750–753.
    [150] Reid NM, Addison SL, Macdonald LJ, et al. (2011) Biodiversity of active and inactive bacteria in the gut flora of wood-feeding huhu beetle larvae (Prionoplus reticularis). Appl Environ Microb 77: 7000–7006. doi: 10.1128/AEM.05609-11
    [151] Gong HL, Shi Y, Zhou L, et al. (2013) The composition of microbiome in larynx and the throat biodiversity between laryngeal squamous cell carcinoma patients and control population. PLoS One 8: e66476.
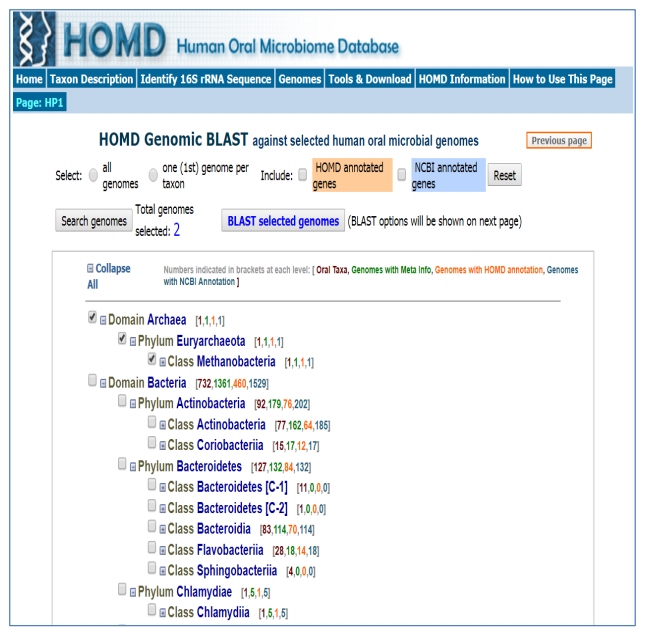
    [152] Chen T, Yu WH, Izard J, et al. (2010) The Human Oral Microbiome Database: a web accessible resource for investigating oral microbe taxonomic and genomic information. Database 2010.
    [153] Human Microbiome Jumpstart Reference Strains Consortium (2010) A catalog of reference genomes from the human microbiome. Science 328: 994–999.
    [154] Wang J, Qi J, Zhao H, et al. (2013) Metagenomic sequencing reveals microbiota and its functional potential associated with periodontal disease. Sci Rep 3: 1843. doi: 10.1038/srep01843
    [155] Raghunathan A, Ferguson HR, Bornarth CJ, et al. (2005) Genomic DNA amplification from a single bacterium. Appl Environ Microb 71: 3342–3347. doi: 10.1128/AEM.71.6.3342-3347.2005
    [156] Dean FB, Hosono S, Fang L (2002) Comprehensive human genome amplification using multiple displacement amplification. P Natl Acad Sci USA 99: 5261–5266.
    [157] Chitsaz H, Yee-Greenbaum JL, Tesler G (2011) Efficient de novo assembly of single-cell bacterial genomes from short-read data sets. Nat Biotechnol 29: 915–921. doi: 10.1038/nbt.1966
    [158] Bankevich A, Nurk S, Antipov D, et al. (2012) SPAdes: a new genome assembly algorithm and its applications to single-cell sequencing. J Comput Biol 19: 455–477.
    [159] Lasken RS (2012) Genomic sequencing of uncultured microorganisms from single cells. Nat Rev Microbiol 10: 631–640. doi: 10.1038/nrmicro2857
    [160] Boschker HTS, Nold SC, Wellsbury P (1998) Direct linking of microbial populations to specific biogeochemical processes by 13C-labelling of biomarkers. Nature 392: 801–805.
    [161] Radajewski S, Ineson P, Parekh NR, et al. (2000) Stable-isotope probing as a tool in microbial ecology. Nature 403: 646–649.
    [162] McLean JS (2014) Advancements toward a systems level understanding of the human oral microbiome. Front Cell Infect Mi 4: 98.
    [163] Peterson SN, Snesrud E, Liu J, et al. (2013) The dental plaque microbiome in health and disease. PLoS One 8: e58487.
    [164] Lourenço TGB, Heller D, Silva-Boghossian CM (2014) Microbial signature profiles of periodontally healthy and diseased patients. J Clin Periodontol 41: 1027–1036. doi: 10.1111/jcpe.12302
    [165] Farrell JJ, Zhang L, Zhou H, et al. (2011) Variations of oral microbiota are associated with pancreatic diseases including pancreatic cancer. Gut 61: 582–588.
    [166] Belda-Ferre P, Alcaraz LD, Cabrera-Rubio R, et al. (2012) The oral metagenome in health and disease. ISME J 6: 46–56. doi: 10.1038/ismej.2011.85
    [167] Duran-Pinedo AE, Chen T, Teles R, et al. (2014) Community-wide transcriptome of the oral microbiome in subjects with and without periodontitis. ISME J 8: 1659–1672. doi: 10.1038/ismej.2014.23
    [168] Jorth P, Trivedi U, Rumbaugh K, et al. (2013) Probing bacterial metabolism during infection using high-resolution transcriptomics. J Bacteriol 195: 4991–4998. doi: 10.1128/JB.00875-13
    [169] Griffen AL, Beall CJ, Campbell JH, et al. (2012) Distinct and complex bacterial profiles in human periodontitis and health revealed by 16S pyrosequencing. ISME J 6: 1176–1185.
    [170] Schulze-Schweifing K, Banerjee A, Wade WG (2014).Comparison of bacterial culture and 16S rRNA community profiling by clonal analysis and pyrosequencing for the characterization of the dentine caries-associated microbiome. Front Cell Infect Mi 4: 164.
    [171] Pushalkar S, Ji X, Li Y, et al. (2012) Comparison of oral microbiota in tumor and non-tumor tissues of patients with oral squamous cell carcinoma. BMC Microbiol 12: 144. doi: 10.1186/1471-2180-12-144
    [172] Liu B, Faller LL, Klitgord N, et al. (2012) Deep sequencing of the oral microbiome reveals signatures of periodontal disease. PLoS One 7: e37919. doi: 10.1371/journal.pone.0037919
    [173] Xie G, Chain PSG, Lo CC, et al. (2010) Community and gene composition of a human dental plaque microbiota obtained by metagenomic sequencing. Mol Oral Microbiol 25: 391–405.
    [174] Huson DH, Auch AF, Qi J, et al. (2007) MEGAN analysis of metagenomic data. Genome Res 17: 377–386. doi: 10.1101/gr.5969107
    [175] Benitez-Paez A, Belda-Ferre P, Simon-Soro A, et al. (2014) Microbiota diversity and gene expression dynamics in human oral biofilms. BMC Genomics 15: 311.
    [176] Jorth P, Turner KH, Gumus P, et al. (2014) Metatranscriptomics of the human oral microbiome during health and disease. Mbio 5: e01012-14.
    [177] Maron PA, Ranjard L, Mougel C, et al. (2007) Metaproteomics: a new approach for studying functional microbial ecology. Microb Ecol 53: 486–493. doi: 10.1007/s00248-006-9196-8
    [178] Yakob M, Fuentes L, Wang MB, et al. (2014) Salivary biomarkers for detection of oral squamous cell carcinoma: current state and recent advances. Curr Oral Health Rep 1: 133–141. doi: 10.1007/s40496-014-0014-y
    [179] Barnes VM, Ciancio SG, Shibly O, et al. (2011) Metabolomics reveals elevated macromolecular degradation in periodontal disease. J Dent Res 90: 1293–1297. doi: 10.1177/0022034511416240
    [180] Arrais JP, Rosa N, Melo J, et al. (2013) Oral Card: a bioinformatic tool for the study of oral proteome. Arch Oral Biol 58: 762–772.
  • This article has been cited by:

    1. Anikate Gupta, Abhineet Saini, Neha Khatri, Ashima Juyal, Review of single-point diamond turning process on IR optical materials, 2022, 69, 22147853, 435, 10.1016/j.matpr.2022.09.073
    2. Ziteng Li, Shuhao Kang, Huan Liu, Yuhu Liu, Mingjun Ren, Xinquan Zhang, Limin Zhu, Duo Li, Molecular dynamics study on burr formation mechanism during monocrystalline silicon nano-grinding process, 2024, 131, 15266125, 2505, 10.1016/j.jmapro.2024.10.054
  • Reader Comments
  • © 2018 the Author(s), licensee AIMS Press. This is an open access article distributed under the terms of the Creative Commons Attribution License (http://creativecommons.org/licenses/by/4.0)
通讯作者: 陈斌, bchen63@163.com
  • 1. 

    沈阳化工大学材料科学与工程学院 沈阳 110142

  1. 本站搜索
  2. 百度学术搜索
  3. 万方数据库搜索
  4. CNKI搜索

Metrics

Article views(17985) PDF downloads(1842) Cited by(163)

Article outline

Figures and Tables

Figures(3)  /  Tables(1)

/

DownLoad:  Full-Size Img  PowerPoint
Return
Return

Catalog