Mini review Special Issues

Cyclodextrin-containing layer-by-layer films and microcapsules: Synthesis and applications

  • This article reviews the synthesis and applications of cyclodextrin (CD)-containing layer-by-layer (LbL) films and microcapsules. CD-containing LbL films and microcapsules have been synthesized through the electrostatic interactions between charged CDs and polyelectrolytes or the formation of host–guest complexes. In the former strategy, sulfonated and carboxylated CDs are often combined with oppositely charged polyelectrolytes. In contrast, in the latter strategy, CD-bearing polymers and guest-modified polymers are used as components of LbL assembly. Typical guest molecules include adamantane, ferrocene, and azobenzene derivatives. Electrochemical biosensors have been constructed by coating the surface of electrodes with CD-containing LbL films. In addition, CD-containing LbL assemblies are used as scaffolds for constructing drug delivery systems, in which hydrophobic, poorly soluble drugs are loaded on the film through host–guest complexation.

    Citation: Uichi Akiba, Jun-ichi Anzai. Cyclodextrin-containing layer-by-layer films and microcapsules: Synthesis and applications[J]. AIMS Materials Science, 2017, 4(4): 832-846. doi: 10.3934/matersci.2017.4.832

    Related Papers:

    [1] Patrick Mumbi Chileshe . Banking structure and the bank lending channel of monetary policy transmission: Evidence from panel data methods. Quantitative Finance and Economics, 2018, 2(2): 497-524. doi: 10.3934/QFE.2018.2.497
    [2] Victor J. Valcarcel . Yield curve rotations, monetary shocks, and Greenspan’s Conundrum. Quantitative Finance and Economics, 2019, 3(1): 1-21. doi: 10.3934/QFE.2019.1.1
    [3] Thomas C. Chiang . Economic policy uncertainty and stock returns—evidence from the Japanese market. Quantitative Finance and Economics, 2020, 4(3): 430-458. doi: 10.3934/QFE.2020020
    [4] Richard J. Cebula, Don Capener . The impact of federal income tax rate cuts on the municipal bond market in the U.S.: A brief exploratory empirical note. Quantitative Finance and Economics, 2018, 2(2): 407-412. doi: 10.3934/QFE.2018.2.407
    [5] Cunyi Yang, Li Chen, Bin Mo . The spillover effect of international monetary policy on China's financial market. Quantitative Finance and Economics, 2023, 7(4): 508-537. doi: 10.3934/QFE.2023026
    [6] Bonang N. Seoela . Efficacy of monetary policy in a currency union? Evidence from Southern Africa's Common Monetary Area. Quantitative Finance and Economics, 2022, 6(1): 35-53. doi: 10.3934/QFE.2022002
    [7] Haryo Kuncoro, Fafurida Fafurida, Izaan Azyan Bin Abdul Jamil . Growth volatility in the inflation-targeting regime: Evidence from Indonesia. Quantitative Finance and Economics, 2024, 8(2): 235-254. doi: 10.3934/QFE.2024009
    [8] Serçin ŞAHİN, Serkan ÇİÇEK . Interest rate pass-through in Turkey during the period of unconventional interest rate corridor. Quantitative Finance and Economics, 2018, 2(4): 837-859. doi: 10.3934/QFE.2018.4.837
    [9] Gülserim Özcan . The amplification of the New Keynesian models and robust optimal monetary policy. Quantitative Finance and Economics, 2020, 4(1): 36-65. doi: 10.3934/QFE.2020003
    [10] Simiso Msomi, Damien Kunjal . Industry-specific effects of economic policy uncertainty on stock market volatility: A GARCH-MIDAS approach. Quantitative Finance and Economics, 2024, 8(3): 532-545. doi: 10.3934/QFE.2024020
  • This article reviews the synthesis and applications of cyclodextrin (CD)-containing layer-by-layer (LbL) films and microcapsules. CD-containing LbL films and microcapsules have been synthesized through the electrostatic interactions between charged CDs and polyelectrolytes or the formation of host–guest complexes. In the former strategy, sulfonated and carboxylated CDs are often combined with oppositely charged polyelectrolytes. In contrast, in the latter strategy, CD-bearing polymers and guest-modified polymers are used as components of LbL assembly. Typical guest molecules include adamantane, ferrocene, and azobenzene derivatives. Electrochemical biosensors have been constructed by coating the surface of electrodes with CD-containing LbL films. In addition, CD-containing LbL assemblies are used as scaffolds for constructing drug delivery systems, in which hydrophobic, poorly soluble drugs are loaded on the film through host–guest complexation.


    The effectiveness of monetary policy has long been debated, with widely divergent views and assessments being expressed. This has especially been the case since the appearance of The General Theory of Employment, Interest and Money by Keynes (1936). In more recent times, this debate can be seen taking the form of uncertainty regarding the effectiveness of monetary policy tools, including managing the money supply per se on the one hand and the undertaking of "quantitative easing (QE)" on the other hand, although certainly other debates about the usefulness and dependability of monetary policy in the U.S. could be explored. Indeed, beginning in November, 2008 and continuing for the next several years, the Federal Reserve in the U.S. used QE (supplemented by near zero lower bound, ZLB, interest rates with the Fed Funds rate) to drive down the interest rate yields and keep them very low during and subsequent to the Great Recession. The Fed implemented QE by purchasing MBSs (mortgage backed securities) and other longer term financial instruments and thereby, given the high degree of capital mobility among U.S. bond markets, was able to lower mortgage interest rates. Ostensibly, this policy had as its objective the stimulation of the real estate sector of the economy by lowering mortgage interest rates and thereby elevating the growth rate of real GDP. Further elaboration on quantitative easing is provided in the Section 2 of the text of this study.

    In the current exploratory study, we empirically investigate the uncertainty of the effectiveness of recent monetary policies in lowering the real mortgage rate. In particular, we have an eye towards determining whether the Fed's policies, be it through changing the M2 money supply (expressed as a percent of GDP) per se using traditional tools or through quantitative easing perse, have been consistently effective or whether, instead, there is uncertainty regarding whether, when, and to what extent these policies achieve their ostensible goal of lowing the mortgage rate in different time periods. Based upon empirical estimates of a loanable funds model, it is shown that the consistency of recent monetary policies has indeed varied over time, implying that there does exists a genuine uncertainty regarding how dependable monetary policy effectiveness really is. Moreover, it is observed that elevated interest rate risk is a collateral effect of recent monetary policies, an effect that seriously endangers the usefulness of monetary policy in promoting the health of the macro-economy, a consideration that throws monetary policy effectiveness even further into question yet again.

    Previous studies have also focused on monetary policy effectiveness and the uncertainty thereof for the U.S.; furthermore, they assume a variety of forms. For example, Wheeler and Chowdhury (1993) investigate the relationship between residential expenditure and macroeconomic activity, with the empirics involving the study period 1959–1991. Part of their results implies that shocks to nominal interest rates, output, and the money supply significantly impact residential expenditures. Vargas-Silva (2008) also considers the uncertainty of the impact of monetary policy on the housing market while imposing certain sign restrictions. Among the extensions of the Wheeler and Chowdhury (1993) and Vargas-Silva (2008) analyses found in the current study are the following: (1) the focus on ex post real rather than nominal interest rates, which enables us to address the issue of inflation directly; (2) the consideration of eight sub-periods for the years from 1974–2016, making the present study more current; and (3) the absence of arbitrary imposed sign restrictions. Moreover, the present study differs even more markedly from the compelling yet quite different analysis by Marfatia (2014), which focused upon stock market responses to Fed policy surprises, and the also rather different analysis also by Marfatia (2015), the focus of which was financial stress and risks in bond markets.

    In the U.S., "quantitative easing" (QE) took the form of three rounds of policy actions, QE (1), QE (2), and QE (3), such that QE was a monetary policy staple for effectively six full years, from 2009 through 2014. In November of 2008, the Fed announced that it was going to pursue QE (1), which principally involved Fed purchases of mortgage-backed securities, ultimately amounting to a total of approximately $1.75 trillion (Krippner, 2012; Wu and Xia, 2016). Further purchases were stopped in June, 2010, as the economy started to improve, but resumed again in August of 2010 when the Fed decided the economy was not growing robustly, with the Fed suggesting the possibility of a second stage of quantitative easing, i.e., QE (2). In November of 2010, the Fed announced a second round of quantitative easing, QE (2), which was to involve the purchase of some $600 billion worth of Treasury debt by the end of the second quarter of 2011. QE (2) was a response to the evaluation by the Fed that the U.S. economy was experiencing slowing economic growth (Krippner, 2012).

    The third round of quantitative easing, QE (3), which was announced in September of 2012, initially involved the adoption of a $40 billion per month, open-ended bond purchasing program of agency mortgage-backed securities. Additionally, the Fed declared that it would probably keep the Fed Funds Rate (FFR) at near zero levels. During December of 2012, the FOMC (Federal Open Market Committee) announced an increase in the targeted volume of open-ended purchases from $40 billion to $85 billion per month. Finally, in June of 2013, the Fed openly declared the intention of cutting back on the degree of quantitative easing, suggesting that the Fed would reduce its monthly bond purchases and that the QE (3) policies could largely be terminated by the middle of 2014. The policy of quantitative easing technically came to an actual close by the end of October of 2014, with the Fed having accumulated a total of approximately $4.5 trillion in assets, a sum equal in magnitude to roughly one-fourth of the economy's GDP.

    Wu and Xia (2016) observe that since December 2008, the federal funds rate has been very near zero. When zero rates had been found to be insufficient to eliminate the negative effects of the Great Recession, the Fed introduced the new recession-fighting tool, i.e., quantitative easing. Wu and Xia (2016) take the view that the impact of this new policy measure has made it difficult to determine what the exact overall stance of monetary policy is at any given moment in time. In an effort to clarify this issue, they develop the "Shadow Fed Funds Rate" concept, which was previously considered and discussed less formally by Krippner (2012). Their mathematically determined rate takes into account both the actual federal funds rate and the impact of QE, as well as other non-traditional policy tools, the objective being to establish a more accurate measure of the Fed's impact on the economy. In the present study, despite not having a shadow interest rate, we explicitly include three monetary policy tools: an explicit measure of the magnitude of quantitative easing (QE), scaled by GDP, the real fed funds rate, and the magnitude of the M2 money supply, scaled by GDP.

    The three hypotheses being examined in this study, albeit at an exploratory level, are, as follows:

    1.During the post-Bretton Woods era in the U.S., the ex post real mortgage rate had been a decreasing function of the M2 measure of the money supply, scaled by GDP, i.e., expressed as a percent of GDP (so that is can be judged relative to the size of the economy), M2/Y, ceteris paribus;

    2.During the 2008–2014 portion of the post-Bretton Woods era in the U.S., the ex post real mortgage rate had been a decreasing function of the quantitative easing policies pursued by the Fed, where quantitative easing is expressed as a percent of GDP so that it can be judged relative to the size of the economy (QE/Y), 1 ceteris paribus. It is noteworthy of emphasis that, based on the history of quantitative easing provided below, that the effect of this policy approach is measured for the years 2008–2014.

    1 Scaling by GDP is needed for proper specification (Ostrosky, 1990; Ewing and Yanochik, 1999; Cebula, 2013, 2014).

    3.The statistical significance of hypotheses 1 and 2 varies over time, which thereby implies uncertainty regarding the effectiveness of the monetary policy tools involved.

    Predicated on the studies by Al-Saji (1993), Barth et al. (1985), Hoelscher (1986), as well as Zahid (1988), Cebula(2013, 2014), and Cebula et al. (2014), a loanable funds model is adopted in this study. In this context, the ex post real interest rate yield on new home mortgages in the U.S. is, assuming all other bond markets are in equilibrium, determined by (1).

    D + MS/Y + QE/Y=S. (1)

    where D is private domestic demand for 30 year fixed-rate mortgages, MS/Y stands for the ratio of the money supply to the GDP level, QE/Y is the ratio of quantitative easing net purchases to the GDP level; and S represents the private sector supply of 30 year fixed-rate mortgages.

    Based on the studies by Barth et al. (1985), as well as Hoelscher (1986), Zahid (1988), Cebula(2013, 2014) and Cebula et al. (2014), it is expected that:2

    2 See also Findlay (1990), Johnson (1992), Gissey (1999), Gale and Orszag (2003), and Swamy et al. (1990).

    D = D(EPRMORT,EPRBAA,EPRTF,UNR), and

    DEPRMORT>0,DEPRBAA<0,DEPRTF<0,DUNR<0. (2)

    S = S(EPRMORT,Y,EPRFFR), and

    SEPRMORT<0,SY>0,SEPRFFR<0. (3)

    where EPRMORT is the annual average ex post real interest rate yield on new 30 year fixed-rate home mortgages; EPRBAA is the annual average ex post real interest rate yield on Moody's Baa-rated corporate bonds; EPRTF stands for the annual average ex post real interest rate yield on high grade tax-exempt municipal bonds; UNR is the percentage civilian unemployment rate; Y is the annual percentage growth rate of real GDP; and EPRFFR represents the ex post real Fed Funds Rate.

    The value of any ex post real interest rate yield in this study is the nominal interest rate yield in question in year t minus the actual inflation rate Pt. The real Fed Funds Rate, EPRFFR, is treated as a de facto "control variable", along with EPRBAA, EPRTF, UNR and Y.

    Substituting equations (2) and (3) into equation (1) and solving for EPRMORT yields the fully expressed form of the model:

    EPRMORT=g(M2/Y,EPRFFR,EPRBAA,EPRTE,QE/Y,UNR,Y). (4)

    where, based on the hypothesized partials from equations (2) and (3), as well as the mainstream literature as reflected in the studies by Barth et al. (1985), Hoelscher (1986), Findlay (1990), Johnson (1992), Gissey (1999), Gale and Orszag (2003), Swamy et al. (1990), Madura (2008), and Zahid (1988), it is hypothesized that:

    gM2/Y<0,gEPRFFR<0,gEPRBAA>0,gEPRTE>0,gQE/Y<0,gUNR>0,gY<0. (5)

    Based on the model expressed in equation (4), the following equation is to be estimated by AR/2SLS:

    EPRMORTt=a0+a1(M2/Y)t1+a2EPRFFRt1+a3EPRBAAt+a4EPRTEt+a5(QE/Y)t1+a6UNRt1+a7Yt1+a8INTERTFBAAt+a9AR(1) + εt. (6)

    where EPRMORTt is ex post real interest rate yield on 30 year fixed-rate mortgages and expressed as a percent per annum; a0 is a constant; (M2/Y)t1 is M2 money supply in year t as a percent of GDP in year t−1;EPRFFRt1 is real Fed Funds rate in year t−1 and expressed as a percent per annum; EPRBAAt is real interest rate yield on Moody's Baa-rated corporate bonds in year t, expressed as a percent per annum; EPRTEt stands for real interest rate yield on high grade tax-exempt municipal bonds in year t, expressed as a percent per annum; (QE/Y)t1 is the ratio of net QE acquisitions in year t−1 to the GDP in year t−1, expressed as a percent; UNRt1 is the percentage unemployment rate of the civilian labor force in year t−1;Yt1 is the percentage growth rate of real GDP in year t−1;INTERTFBAAt is interaction term between EPRBAAt and EPRTEt, AR(1) is autoregressive term; and εt is error term.

    Interestingly, Belton and Cebula (1994, p. 461) observe that "Most time series studies show that there is a relationship between the state of the economy and electoral outcomes". Studies like those by Kiewiet (1983) and Grier (1991) have found compelling evidence suggestive of political monetary cycles, although Belton and Cebula (1994) did not find compelling evidence of a political monetary cycle. Consequently, in this study, the principal political cycle in the U.S. is acknowledged. In particular, the focus of one of the estimates involves a year that coincides with Presidential election cycles. Accordingly, the issue of monetary policy effectiveness in terms of the impacts of (M2/Y)t1, (QE/Y)t1, and EPRFFRt1 on EPRMORTt was estimated for the one post-Bretton Woods Presidential election study period that occurred during the midst of quantitative easing, namely: 2012. The temporal closeness of this Presidential election cycle to the other study periods considered here makes it suitable for comparison with the other estimation results. The choice of the AR/2SLS technique is based on the applicability of the AR(1) process to volatile time series, such as interest rates, and the contemporaneous structure of the model, i.e., the presence of unlagged explanatory variables in the specification in equation (6). The instruments are the two-year lags of both the non-binary variables and the binary variables; in each estimate, a constant is added to the instrument list. Two stage least squares (2SLS) is a standard time series tool for addressing endogeneity and requires the identification and use of instrumental variables (Greene, 1997). The instruments for variables EPRTEt and EPRBAAt were the two-year lags of the real interest rate yield on three-month Treasury bills, EPRTBRt2, and the real interest rate yield on Moody's Aaa-rated corporate bonds, EPRBAAt2. The variables EPRTEt and EPRTBRt2 are highly correlated (r = 0.752) as are EPRBAAt and EPRBAAt2 (r = 0.991), whereas the instruments are uncorrelated with the error term.

    The results for the initial seven study periods are provided in Tables 1–7, where, overall, the estimated coefficients exhibited the expected signs in nearly every case. In addition, the coefficients were significant at the 5% level or beyond for 27 out of 49 variables (excluding the interaction term) across the seven estimations, with four more coming in as significant at the 10% level. However, it is the pattern of estimated coefficients for the three monetary policy variables identified in this study, namely, (M2/Y)t1, (QE/Y)t1, and EPRFFRt1, that is of central interest here. Interestingly, in all seven estimates (respectively, .16, .17, .17, .15, .17, .21, and.26, for Tables 1, 2, 3, 4, 5, 6, and 7), the inverted AR roots are indicative of a stationary autoregressive process, so that there are no significant concerns regarding non-stationarity. In addition, the J-statistics are all significant at the 10% or better, implying that the instrument choices are exogenous. The coefficients on the EPRTEt and EPRBAAt variables all exhibit the hypothesized signs, with all 14 being significant at the 5% level or beyond. The unemployment rate variable, UNRt1, has the expected sign in all seven estimates, while being significant at beyond the 5% level in four case and beyond the 10% level in a fifth case. Furthermore, in five of the seven estimates, the interaction terms, INTERTFBAAt, is significant at the 10% level or better.

    Of far more relevance are the results for the main monetary policy tool variables, as reflected in (M2/Y)t1 and (QE/Y)t1(although the results for the Fed Funds rate variable may be of some interest). First, we take an overview of the results. For the 2009, 2010, and 2011 estimates, the coefficients on (M2/Y)t1 are negative, as hypothesized, and significant at the 5% level, whereas those for (QE/Y)t1 are also negative, as hypothesized, but significant at far beyond the 1% level. Regarding the 2012, 2013, and 2014, estimates, the (M2/Y)t1 coefficients are in all cases negative but not significant at the 5% level. However, for these same years, the quantitative easing coefficients, (QE/Y)t1, are all negative, with two being significant at far beyond the 1% level, one being significant at the 5% level. Finally, for the 2015 estimate, neither of these two monetary policy tools was significant at the 5% level. It can be inferred that there were no dramatic changes in monetary policy effectiveness in the transition from QE (1) to QE (2); however, there appears to have been a degradation in the effectiveness of monetary policy in the QE (2) to QE (3) transition.

    As shown in Table 1 for the study period through 2009, the variable (M2/Y)t-1, which may be viewed as reflecting the exercise of "standard" monetary policy insofar as it reflects the traditional use of reserve requirement changes (which while typically limited did in fact occasionally assume large proportions, such as in 1992), and net open market operations involving principally Treasury debt issues, is negative and significant at the 5% level, which attests to the effectiveness of standard monetary policy. Interestingly, real Fed Funds rate changes were also effective in influencing the real mortgage rate. Moreover, the effectiveness as well of quantitative easing is also affirmed by the significant (1% level) coefficient on (QE/Y)t-1.

    Table 1.  AR/2SLS estimate, 1974–2009.
    Variable Coefficient Std. Error t-Statistic Prob.
    EPRFFRt1 0.242685 0.076150 3.186927 0.0037
    EPRBAAt 0.526917 0.153219 3.438985 0.0020
    (M2/Y)t1 −0.043380 0.020923 −2.073272 0.0482
    a0 2.193953 1.217753 1.801641 0.0832
    (QE/Y)t1 −0.011524 0.001621 −7.108601 0.0000
    UNRt1 0.166389 0.089903 1.850765 0.0756
    INTERTFBAAt 0.012564 0.011488 1.093584 0.2842
    Yt1 0.004229 0.049873 0.084787 0.9331
    EPRTEt 0.058348 0.053904 1.082440 0.2890
    AR(1) 0.156176 0.283604 0.550683 0.5866
    R-squared 0.979495 Adjusted R-squared 0.972397

     | Show Table
    DownLoad: CSV

    Refer now to Tables 2 and 3. In each of these cases, the coefficients on both (M2/Y)t-1 and (QE/Y)t-1 are negative and significant; the real Fed Funds rate also is significant. This implies that traditional monetary policy, including the real Fed Funds rate, supplemented by quantitative easing were both effective in lowering interest rates. Clearly, the lowering of interest rate was consistent with the goal of attempting to stimulate the economy as a whole through, in this case, the stimulating of the housing market. Moreover, the significance of these tools appears to have been instrumental in helping to end the Great Recession in the U.S.

    Table 2.  AR/2SLS estimate, 1974–2010.
    Variable Coefficient Std. Error t-Statistic Prob.
    EPRFFRt1 0.265525 0.085344 3.111239 0.0044
    EPRBAAt 0.493829 0.166479 2.966317 0.0062
    (M2/Y)t1 −0.048099 0.020966 −2.294112 0.0298
    a0 2.391504 1.171081 2.042134 0.0510
    (QE/Y)t1 −0.009269 0.001509 −6.141362 0.0000
    UNRt1 0.194999 0.087567 2.226845 0.0345
    INTERTFBAAt 0.015268 0.012338 1.237460 0.2266
    Yt1 −0.002198 0.050860 −0.043216 0.9658
    EPRTEt 0.043055 0.046351 0.928901 0.3612
    AR(1) 0.166308 0.260677 0.637986 0.5289
    R-squared 0.978334 Adjusted R-squared 0.971112

     | Show Table
    DownLoad: CSV
    Table 3.  AR/2SLS estimate, 1974–2011.
    Variable Coefficient Std. Error t-Statistic Prob.
    EPRFFRt1 0.256620 0.082335 3.116796 0.0042
    EPRBAAt 0.500129 0.161014 3.106123 0.0043
    (M2/Y)t1 −0.047726 0.020940 −2.279111 0.0305
    a0 2.446073 1.127378 2.169700 0.0387
    (QE/Y)t1 −0.010001 0.001496 −6.684307 0.0000
    UNRt1 0.181655 0.077646 2.339539 0.0267
    INTERTFBAAt 0.016480 0.011555 1.426214 0.1649
    Yt1 −0.010991 0.040640 −0.270448 0.7888
    EPRTEt 0.040970 0.043061 0.951443 0.3495
    AR(1) 0.167736 0.235949 0.710897 0.4830
    R-squared 0.978359 Adjusted R-squared 0.971403

     | Show Table
    DownLoad: CSV

    However, as shown in Tables 4 and 5, for 2012 and 2013, although quantitative easing was still effective [the coefficient on (QE/Y)t-1 is negative and significant at the 1% level], the coefficient on standard monetary policy, (M2/Y)t-1, fails to be significant at the 5% level, although the real Fed Funds rate retains its statistical significance. Thus, standard monetary policy (other than the Fed Funds tool) lost its effectiveness following 2012, which no doubt was reflected by the lackluster economic growth following the Great Recession, although huge federal budget deficits may have confounded monetary policy during this time period (Council of Economic Advisors, 2018). That, of course, is a subject beyond the scope of this paper.

    Table 4.  AR/2SLS estimate, 1974–2012.
    Variable Coefficient Std. Error t-Statistic Prob.
    EPRFFRt1 0.255866 0.080320 3.185589 0.0034
    EPRBAAt 0.518056 0.155977 3.321361 0.0024
    (M2/Y)t1 −0.041241 0.020365 −2.025072 0.0522
    a0 2.063620 1.144013 1.803843 0.0817
    (QE/Y)t1 −0.008266 0.001764 −4.684674 0.0001
    UNRt1 0.169641 0.075053 2.260278 0.0315
    INTERTFBAAt 0.015290 0.010998 1.390261 0.1750
    Yt1 0.002302 0.041798 0.055074 0.9565
    EPRTEt 0.033359 0.046104 0.723565 0.4751
    AR(1) 0.152059 0.244189 0.622712 0.5383
    R-squared 0.978678 Adjusted R-squared 0.972061

     | Show Table
    DownLoad: CSV
    Table 5.  AR/2SLS estimate, 1974–2013.
    Variable Coefficient Std. Error t-Statistic Prob.
    EPRFFRt1 0.272010 0.082554 3.294950 0.0025
    EPRBAAt 0.509641 0.154071 3.307842 0.0024
    (M2/Y)t1 −0.033990 0.019446 −1.747951 0.0907
    a0 1.746964 1.166281 1.497893 0.1446
    (QE/Y)t1 −0.007525 0.001944 −3.871175 0.0005
    UNRt1 0.155423 0.075074 2.070280 0.0471
    INTERTFBAAt 0.015048 0.011216 1.341640 0.1898
    Yt1 0.006864 0.042869 0.160124 0.8739
    EPRTEt 0.032618 0.045051 0.724021 0.4747
    AR(1) 0.171793 0.245156 0.700748 0.4889
    R-squared 0.978753 Adjusted R-squared 0.972378

     | Show Table
    DownLoad: CSV

    Moreover, of greater concern, as shown in Tables 6 and 7 for the study period through 2014 and 2015, the (M2/Y)t-1 dimension of monetary policy failed to be a statistically significant policy tool, although the real Fed Funds rate is still impactful. And whereas the quantitative easing policy, (QE/Y)t-1, was marginally significant in the 2014 estimate, it ceases to exercise statistical significance the next year. The huge federal budget deficit during this period may in part have accounted for this, although that still remains to be determined.

    Table 6.  AR/2SLS estimate, 1974–2014.
    Variable Coefficient Std. Error t-Statistic Prob.
    EPRFFRt1 0.281562 0.088738 3.172947 0.0034
    EPRBAAt 0.505189 0.146914 3.438678 0.0017
    (M2/Y)t1 −0.021199 0.022026 −0.962420 0.3433
    a0 1.276702 1.356297 0.941315 0.3538
    (QE/Y)t1 −0.005491 0.002616 −2.098944 0.0441
    UNRt1 0.113766 0.077626 1.465574 0.1528
    INTERTFBAAt 0.014673 0.011444 1.282201 0.2093
    Yt1 0.007753 0.043504 0.178211 0.8597
    EPRTEt 0.040481 0.048135 0.840987 0.4068
    AR(1) 0.210005 0.263575 0.796758 0.4317
    R-squared 0.976270 Adjusted R-squared 0.969380

     | Show Table
    DownLoad: CSV
    Table 7.  AR/2SLS estimate, 1974–2015.
    Variable Coefficient Std. Error t-Statistic Prob.
    EPRFFRt1 0.296336 0.100143 2.959139 0.0058
    EPRBAAt 0.491993 0.140657 3.497832 0.0014
    (M2/Y)t1 −0.013470 0.023900 −0.563612 0.5769
    a0 1.047184 1.448897 0.722746 0.4751
    (QE/Y)t1 −0.004510 0.002636 −1.711303 0.0967
    UNRt1 0.084563 0.077390 1.092689 0.2827
    INTERTFBAAt 0.014763 0.011388 1.296375 0.2041
    Yt1 0.006840 0.043756 0.156332 0.8768
    EPRTEt 0.046333 0.049661 0.932997 0.3578
    AR(1) 0.262996 0.258212 1.018530 0.3161
    R-squared 0.975443 Adjusted R-squared 0.968537

     | Show Table
    DownLoad: CSV

    It may be of value to consider the estimate of the model for the period 1974–2008, an entirely pre-QE and pre-Great Recession period, and for the period 1974–2016, a clearly post-Great Recession and post-QE period, with the emphasis focused on the traditionally characterized core tools of U.S. monetary policy as reflected in the (M2/Y)t1 measure of standard monetary policy actions, i.e., reserve requirement changes and net open market purchases of principally U.S. Treasury securities. These results are provided in Tables 8 and 9, respectively. In Table 8, the monetary policy variable is statistically significant at only the 10% level and hence would clearly not be characterized as being effective in lowering the real mortgage rate. By contrast, in Table 9, the monetary policy variable is shown to be negative and significant at the 1% level, making the measure of traditional monetary policy tool usage appear to be much more effective.

    Table 8.  Estimation for the period prior to quantitative easing with EPRFFR omitted, 1974–2008.
    Variable Coefficient Std. Error t-Statistic Prob.
    EPRTEt 0.259659 0.113436 2.289041 0.0301
    EPRBAAt 0.526015 0.174296 3.017943 0.0055
    (M2/Y)t1 −0.043399 0.024920 −1.741508 0.0930
    a0 2.176506 1.223829 1.778440 0.0866
    (QE/Y)t1 NA NA NA NA
    UNRt1 0.162084 0.102110 1.587350 0.1241
    INTERTFBAAt 0.017928 0.014493 0.237044 0.2267
    Yt1
    AR(1)
    0.007872
    0.188493
    0.052980
    0.206142
    0.148589
    0.914383
    0.8830
    0.3686
    R-squared 0.977876 Adjusted R-squared 0.972141

     | Show Table
    DownLoad: CSV
    Table 9.  Estimation for the Period Following QE with EPRFFR Omitted, 1974–2016.
    Variable Coefficient Std. Error t-Statistic Prob.
    EPRTEt 0.150449 0.086167 1.746013 0.0896
    EPRBAAt 0.619463 0.104494 5.928207 0.0000
    (M2/Y)t1 −0.052562 0.015356 −3.422804 0.0016
    a0 2.796344 1.257992 2.222862 0.0328
    (QE/Y)t1 NA NA NA NA
    UNRt1 0.073416 0.096006 0.764703 0.4496
    INTERTFBAAt 0.025054 0.013178 1.901226 0.0655
    Yt1 AR(1) −0.0018920.374969 0.0479500.180565 −0.073712.076639 0.97040.0452
    R-squared 0.969373 Adjusted R-squared 0.963248

     | Show Table
    DownLoad: CSV

    Thus, considering the nine time periods studied, the effectiveness of monetary policy would seem to range from ineffective to somewhat effective all the way across the spectrum to very effective. Sadly, however, since it is not a priori known whether monetary policy is going to prove to be ineffective or only somewhat effective or is going to be very effective in any given time frame, the usefulness/efficacy of monetary policy is suspect due to the "uncertainty" in the results from using each form of policy instrument

    The empirical findings summarized in Tables 1-9 establish a reasonable basis for inferring that there exists, at least for the U.S., a non-trivial degree of uncertainty in terms of the effectiveness of Federal Reserve monetary policies.3 Arguably, however, the assessment of monetary policy effectiveness uncertainty has a more complex side to it once monetary policy impacts are placed within a non-myopic context, i.e., from a broader perspective, such as the growth rate of real GDP, i.e., the economy as a whole or the perspective of interest rate risk in the bond markets.

    3 Interestingly, these results do not provide evidence suggesting the existence of a political business cycle, paralleling the earlier finding in Belton and Cebula (1994).

    To illustrate, the estimates in the present study find that monetary policy (albeit in highly varying degrees) often can be an effective policy tool in terms of reducing the real mortgage rate, ostensibly to stimulate the housing industry and stimulate agammaegate economic growth. However, the across-the-board side effects of the monetary policies undertaken since 2008 include the lowering of real and nominal interest rates of all maturities to levels not experienced in decades in the U.S. (Council of Economic Advisors, 2004, Table B-73; 2018, Table B-25). With interest rates having been reduced to such extremely low levels, bond prices rose to commensurately higher levels. A major problem with monetary policy now has become one involving immense interest rate risk for bond holders as well as prospective bond holders, be they households, financial institutions, non-financial firms, pension funds, labor unions, and so forth. Any increase in the interest rate acts to diminish the net worth of these bond holders. These negative wealth effects tend to discourage both consumer purchases and firm investment in new plant and equipment. In other words, future recession probabilities have been increased by the very same monetary policies of recent years that were aimed at stimulating economic growth. Moreover, uncertainty and speculation regarding when and to what extent the Fed will be raising the Fed Funds Rate complicates monetary policy effectiveness and causes a host of other ramifications, including stock market and bond market volatility increases. And these observations trace just one vector (out of many) of outcomes deriving from recent monetary policies. "Uncertain" does indeed seem an apt description of U.S. monetary policy effects as well as monetary policy effectiveness.4

    4 Moreover, future research should endeavor to account for the effects of banking statutes (Robinson, 1980; Barth, 1991; Grier, 1991; Madura, 2008).

    The authors appreciate the helpful comments of two anonymous referees and the Editor.

    The authors declare no conflict of interest.

    [1] Gentile P, Carmagnola I, Nardo T, et al. (2015) Layer-by-layer assembly for biomedical applications in the last decade. Nanotechnology 26: 422001. doi: 10.1088/0957-4484/26/42/422001
    [2] Barsan MM, Brett CMA (2016) Recent advances in layer-by-layer strategies for biosensors incorporating metal nanoparticles. TrAC-Trend Anal Chem 79: 286–296. doi: 10.1016/j.trac.2015.11.019
    [3] Richardson JJ, Cui J, Björnmalm M, et al. (2016) Innovation in layer-by-layer assembly. Chem Rev 116: 14828–14867. doi: 10.1021/acs.chemrev.6b00627
    [4] Xuan M, Zhao J, Shao J, et al. (2017) Recent progress in layer-by-layer assembled biogenic capsules and their applications. J Colloid Interf Sci 487: 107–117. doi: 10.1016/j.jcis.2016.10.018
    [5] Polomska A, Leroux J, Brambilla D (2017) Layer-by-layer coating of solid drug cores: A versatile method to improve stability, control release and tune surface properties. Macromol Biosci 17: 1600228. doi: 10.1002/mabi.201600228
    [6] Anzai J, Kobayashi Y, Suzuki Y, et al. (1998) Enzyme sensors prepared by layer-by-layer deposition of enzymes on a platinum electrode through avidin-biotin interaction. Sensor Actuat B-Chem 52: 3–9. doi: 10.1016/S0925-4005(98)00248-2
    [7] Shi H, Yang Y, Huang JD, et al. (2006) Amperometric choline biosensors prepared by layer-by-layer deposition of choline oxidase on the Prussian blue-modified platinum electrode. Talanta 70: 852–858. doi: 10.1016/j.talanta.2006.02.012
    [8] Wang B, Anzai J (2007) Redox reactions of ferricyanide ions in layer-by-layer deposited polysaccharide films: A significant effect of the type of polycation in the films. Langmuir 23: 7378–7384. doi: 10.1021/la070119m
    [9] Crouzier T, Boudou T, Picart C (2010) Polysaccharide-based polyelectrolyte multilayers. Curr Opin Colloid In 15: 417–426. doi: 10.1016/j.cocis.2010.05.007
    [10] Sato H, Anzai J (2006) Preparation of layer-by-layer thin films composed of DNA and ferrocene-bearing poly(amine)s and their redox properties. Biomacromolecules 7: 2072–2076. doi: 10.1021/bm060222a
    [11] Jewell CM, Lynn DM (2008) Multilayered polyelectrolyte assemblies as platforms for the delivery of DNA and other nucleic acid-based therapeutics. Adv Drug Deliver Rev 60: 979–999. doi: 10.1016/j.addr.2008.02.010
    [12] Sukhishvili SA, Granick S (2002) Layered, erasable polymer multilayers formed by hydrogen-bonded sequential self-assembly. Macromolecules 35: 301–310. doi: 10.1021/ma011346c
    [13] Pavlukhina S, Sukhishvili S (2011) Polymer assemblies for controlled delivery of bioactive molecules from surfaces. Adv Drug Deliver Rev 63: 822–836. doi: 10.1016/j.addr.2011.03.017
    [14] Rao SV, Anderson KW, Bachas LG (1999) Controlled layer-by-layer immobilization of horseradish peroxidase. Biotechnol Bioeng 65: 389–396. doi: 10.1002/(SICI)1097-0290(19991120)65:4<389::AID-BIT3>3.0.CO;2-V
    [15] Sato K, Kodama D, Naka Y, et al. (2006) Electrochemically induced disintegration of layer-by-layer-assembled thin films composed of 2-iminobiotin-labeled poly(ethyleneimine) and avidin. Biomacromolecules 7: 3302–3305. doi: 10.1021/bm060819q
    [16] Hoshi T, Akase S, Anzai J (2002) Preparation of multilayer thin films containing avidin through sugar-lectin interactions and their binding properties. Langmuir 18: 7024–7028. doi: 10.1021/la0203685
    [17] Donath E, Sukhorukov GB, Caruso F, et al. (1998) Novel hollow polymer shells by colloid-templated assembly of polyelectrolytes. Angew Chem Int Ed 37: 2201–2205. doi: 10.1002/(SICI)1521-3773(19980904)37:16<2201::AID-ANIE2201>3.0.CO;2-E
    [18] Antipov AA, Sukhorukov GB, Leporatti S, et al. (2002) Polyelectrolyte multilayer capsule permeability control. Colloid Surface A 198–200: 535–541.
    [19] De Mercato LL, Ferraro MM, Baldassarre F, et al. (2014) Biological applications of LBL multilayer capsules: From drug delivery to sensing. Adv Colloid Interfac 207: 139–154. doi: 10.1016/j.cis.2014.02.014
    [20] Liu L, Son M, Park H, et al. (2014) Efficacy of CNT-bound polyelecby spray-assisted layer-by-layer (LbL) technique on water purification. RSC Adv 4: 32858–32865. doi: 10.1039/C4RA05272B
    [21] Kaner P, Johnson DJ, Seker E, et al. (2015) Layer-by-layer surface modification of polyethersulfone membranes using polyelectrolytes and AgCl/TiO2 xerogels. J Membrane Sci 493: 807–819. doi: 10.1016/j.memsci.2015.05.048
    [22] Sato K, Takahashi S, Anzai J (2012) Layer-by-layer thin films and microcapsules for biosensors and controlled release. Anal Sci 28: 929–938. doi: 10.2116/analsci.28.929
    [23] Wu B, Hou S, Huang L, et al. (2008) Oriented immobilization of immunoglobulin G onto the cuvette of the resonant mirror biosensor through layer-by-layer assembly of multilayer films. Mater Sci Eng C 28: 1065–1069. doi: 10.1016/j.msec.2007.04.035
    [24] Yoshida K, Hasebe Y, Takahashi S, et al. (2014) Layer-by-layer deposited nano- and micro-assemblies for insulin delivery: A review. Mater Sci Eng C 34: 384–392. doi: 10.1016/j.msec.2013.09.045
    [25] Hashide R, Yoshida K, Hasebe Y, et al. (2014) Poly(lactic acid) microparticles coated with insulin-containing layer-by-layer films and their pH-dependent insulin release. J Nanosci Nanotechno 14: 3100–3105. doi: 10.1166/jnn.2014.8562
    [26] Zhu Y, Xuan H, Ren J, et al. (2015) Self-healing multilayer polyelectrolyte composite film with chitosan and poly(acrylic acid). Soft Matt 11: 8452–8459. doi: 10.1039/C5SM01463H
    [27] Zhu Y, Yin T, Ren J, et al. (2016) Self-healing polyelectrolyte multilayer composite film with microcapsules. RSC Adv 6: 12100–12106. doi: 10.1039/C5RA22821B
    [28] Kurkov SV, Loftsson T (2013) Cyclodextrins. Int J Pharmaceut 453: 167–180. doi: 10.1016/j.ijpharm.2012.06.055
    [29] Suzuki I, Obata K, Anzai J, et al. (2000) Crown ether-tethered cyclodextrins: superiority of the secondary-hydroxy side modification in binding tryptophan. J Chem Soc Perkin Trans 2: 1705–1710.
    [30] Zhu X, Wang H, Chen Q, et al. (2007) Preparation and characterization of inclusion complex of iprodione and b-cyclodextrin to improve fungicidal activity. J Agr Food Chem 55: 3535–3539. doi: 10.1021/jf070197f
    [31] Takahashi K, Morimoto S, Nakamura H, et al. (2011) Improvement of pharmaceutical potential of all-trans retinoic acid with hydroxypropyl-b-cyclodextrin. J Incl Phenom Macro 70: 389–396. doi: 10.1007/s10847-010-9857-6
    [32] Moussa Z, Hmadeh M, Abiad MG, et al. (2016) Encapsulation of curcumine in cyclodextrin-metal organic frameworks: Dissociation of loaded Cd-MOFs enhances stability of curcumin. Food Chem 212: 485–494. doi: 10.1016/j.foodchem.2016.06.013
    [33] Čepo DV, Jug M, Rajkovič MG, et al. (2017) Formulation of a nutraceutical derived from carob: b-cyclodextrin encapsulation of antioxidants from carob pod. J Food Nutr Res 56: 48–60.
    [34] Suzuki I, Murakami K, Anzai J (2001) Fabrication of surface-confined ferrocene-appended cyclodextrins on gold electrode. Mater Sci Eng C 17: 149–154. doi: 10.1016/S0928-4931(01)00325-3
    [35] Arima H, Motoyama K, Higashi T (2017) Potential use of cyclodextrins as drug carriers and active pharmaceutical ingredients. Chem Pharm Bull 65: 341–348. doi: 10.1248/cpb.c16-00779
    [36] Seki T, Abe K, Egawa Y, et al. (2016) A pseudopolyrotaxane for glucose-responsive insulin release: The effect of binding ability and spatial arrangement of phenylboronic acid group. Mol Pharmaceut 13: 3807–3815. doi: 10.1021/acs.molpharmaceut.6b00599
    [37] Kojima Y, Okano T, Seki T, et al. (2017) Polyol-responsive pseudopolyrotaxanes based on phenylboronic acid-modified polyethylene glycol and cyclodextrins. J Incl Phenom Macro 87: 295–303. doi: 10.1007/s10847-017-0699-3
    [38] Yang X, Johnson S, Shi J, et al. (1997) Polyelectrolyte and molecular host ion self-assembly to multilayer thin films: An approach to thin chemical sensors. Sensor Actuat B-Chem 45: 87–92. doi: 10.1016/S0925-4005(97)00274-8
    [39] Sato K, Suzuki I, Anzai J (2003) Preparation of polyelectrolyte-layered assemblies containing cyclodextrin and their binding properties. Langmuir 19: 7406–7412. doi: 10.1021/la030163b
    [40] Sato K, Suzuki I, Anzai J (2004) Layered assemblies composed of sulfonated cyclodextrin and poly(allylamine). Colloid Polym Sci 282: 287–290. doi: 10.1007/s00396-003-0911-4
    [41] Suzki I, Sato K, Koga M, et al. (2003) Polyelectrolyte layered assemblies containing azobenzene-modified polymer and anionic cyclodextrins. Mater Sci Eng C 23: 579–583. doi: 10.1016/S0928-4931(03)00050-X
    [42] Zhi J, Tian X, Zhao W, et al. (2008) Self-assembled film based on carboxymethyl-b-cyclodextrin and diazoresin and its binding properties for methylene blue. J Colloid Interf Sci 319: 270–276. doi: 10.1016/j.jcis.2007.11.031
    [43] Yang SY, Hoonor R, Jin H, et al. (2013) Synthesis and characterization of cationic and anionic cyclodextrin oligomaers and their use in layer-by-layer film formation. B Korean Chem Soc 34: 2016–2022. doi: 10.5012/bkcs.2013.34.7.2016
    [44] Dam HH, Caruso F (2013) Formation and degradation of layer-by-layer-assembled polyelectrolyte polyrotaxane capsules. Langmuir 29: 7203–7208. doi: 10.1021/la304580x
    [45] Suzuki I, Egawa Y, Mizukawa Y, et al. (2002) Construction of positively-charged layered assemblies assisted by cyclodextrin complexation. Chem Commun 164–166.
    [46] Heyden AV, Wilczewski M, Labbé P, et al. (2006) Multilayer films based on host-guest interactions between biocompatible polymers. Chem Commun 3220–3222.
    [47] Kaftan O, Tumbiolo S, Dubreuil F, et al. (2011) Probing multivalent host-guest interactions between modified polymer layers by direct force measurement. J Phys ChemB 115: 7726–7735. doi: 10.1021/jp110939c
    [48] Dubacheva GV, Dumy P, Auzély R, et al. (2010) Unlimited growth of host-guest multilayer films based on functionalized neutral polymers. Soft Matt 6: 3747–3750. doi: 10.1039/c0sm00324g
    [49] Zhu M, Aryal GH, Zhang N, et al. (2015) Host-guest interactions derived multilayer perylene diimide thin film constructed on a scaffolding porphyrin monolayer. Langmuir 31: 578–586. doi: 10.1021/la504297w
    [50] Huang J, Yang Y, Shi H, et al. (2006) Multi-walled carbon nanotubes-based glucose biosensor prepared by layer-by-layer technique. Mater Sci Eng C 26: 113–117. doi: 10.1016/j.msec.2005.06.002
    [51] Zhang S, Vlémincq C, Wong DR, et al. (2016) Nanopapers of layer-by-layer nanotubes. J Mater Chem B 4: 7651–7661. doi: 10.1039/C6TB02737G
    [52] Trejo NK, Frey M (2015) A comparative study on electrosprayed, layer-by-layer, and chemically grafted nanomembranes loaded with iron oxide nanoparticles. J Appl Polym Sci 132: 42657.
    [53] Xiong F, Chen C, Liu S (2016) Preparation of chitosan/polystyrene sulfonate multilayered composite metal nanoparticles and its application. J Nanosci Nanotechno 16: 6027–6031. doi: 10.1166/jnn.2016.12111
    [54] 
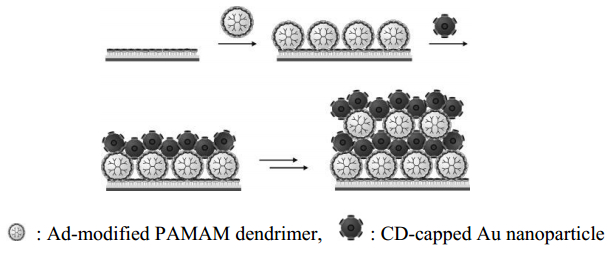
Crespo-Biel O, Dordi B, Reinhoudt DN, et al. (2005) Supramolecular layer-by-layer assembly: Alternating adsorption of guest- and host-functionalized molecules and particles using multivalent supramolecular interactions. J Am Chem Soc 127: 7594–7600. doi: 10.1021/ja051093t
    [55] Crespo-Biel O, Dordi B, Maury P, et al. (2006) Patterned, hybrid, multilayer nanostructures based on multivalent supramolecular interactions. Chem Mater 18: 2545–2551. doi: 10.1021/cm052796c
    [56] Li G, Dong Z, Zhu Y, et al. (2016) Dual-responsive colloidal microcapsules based on host-guest interaction on solid templates. J Colloid Interf Sci 475: 196–202. doi: 10.1016/j.jcis.2016.04.050
    [57] Zhang Y, Yang RH, Liu F, et al. (2004) Fluorescent sensor for imidazole derivatives based on monomer-dimer equilibrium of a zinc porphyrin complex in a polymeric film. Anal Chem 76: 7336–7345. doi: 10.1021/ac049477+
    [58] Khan R, Dhayal M (2009) Chitosan/polyaniline hybrid conducting biopolymer base impedimetric immunosensor to detect Ochratoxin-A. Biosens Bioelectron 24: 1700–1705. doi: 10.1016/j.bios.2008.08.046
    [59] Kurita R, Hirata Y, Yabuki S, et al. (2008) Surface modification of thin polyion complex film for surface plasmon resonance immunosensor. Sensor Actuat B-Chem 130: 320–325. doi: 10.1016/j.snb.2007.08.007
    [60] Anzai J, Ueno A, Osa T (1984) High and rapid response in photo-induced potential changes across a poly(vinyl chloride)/spirobenzopyran membrane. J Chem Soc Chem Commun 688–689.
    [61] Kirsch J, Siltanen C, Zhou Q, et al. (2013) Biosensor technology: recent advances in threat agent detection and medicine. Chem Soc Rev 42: 8733–8768. doi: 10.1039/c3cs60141b
    [62] Takahashi S, Anzai J (2013) Recent progress in ferrocene-modified thin films and nanoparticles for biosensors. Materials 6: 5742–5762. doi: 10.3390/ma6125742
    [63] Rao PV, Gan SH (2015) Recent advances in nanotechnology-based diagnosis and treatments of diabetes. Curr Drug Metab 16: 371–375. doi: 10.2174/1389200215666141125120215
    [64] Zhang W, Shi Y, Zheng S, et al. (2017) Preparation of photoactive multilayer films with high photocurrent response and detection of thrombin. J Electroanal Chem 784: 85–90. doi: 10.1016/j.jelechem.2016.10.061
    [65] Yang Y, Yang X, Liu Y, et al. (2005) Optical sensor for lithocholic acid based on multilayered assemblies from polyelectrolyte and cyclodextrin. J Photoch Photobio A 171: 137–144. doi: 10.1016/j.jphotochem.2004.10.006
    [66] Damos FS, Luz RCS, Tanaka AA, et al. (2010) Development of an electroactive layer-by-layer assembly based on host-guest supramolecular interactions. J Electroanal Chem 639: 36–42. doi: 10.1016/j.jelechem.2009.11.008
    [67] Damos FS, Luz RCS, Tanaka AA, et al. (2010) Dissolved oxygen amperometric sensor based on layer-by-layer assembly using host-guest supramolecular interactions. Anal Chim Acta 664: 144–150. doi: 10.1016/j.aca.2010.02.011
    [68] Chen W, Luo G, Qiu W, et al. (2017) Mesoporous silica-based versatile theranostic nanoplatform constructed by layer-by-layer assembly for excellent photodynamic/chemo therapy. Biomaterials 117: 54–65. doi: 10.1016/j.biomaterials.2016.11.057
    [69] Nag S, Duarte L, Bertrand E, et al. (2014) Ultrasensitive QRS made by supramolecular assembly of functionalized cyclodextrins and graphene for the detection of lung cancer VOC biomarkers. J Mater Chem B 2: 6571–6579. doi: 10.1039/C4TB01041H
    [70] Duarte L, Nag S, Castro M, et al. (2016) Chemical sensors based on new polyamides biobased on (Z) octadec-9-enedioic acid and b-cyclodextrin. Macromol Chem Phys 217: 1620–1628. doi: 10.1002/macp.201600102
    [71] Li J, Liu D, Tian L, et al. (2009) Electrochemical investigation of myoglobin in layer-by-layer films assembled with sulfonated-b-cyclodextrin. Electroanalysis 21: 2653–2659. doi: 10.1002/elan.200900308
    [72] Camacho C, Matías JC, Cao R, et al. (2008) Hydrogen peroxide biosensor with a supramolecular layer-by-layer design. Langmuir 24: 7654–7657. doi: 10.1021/la800242a
    [73] 
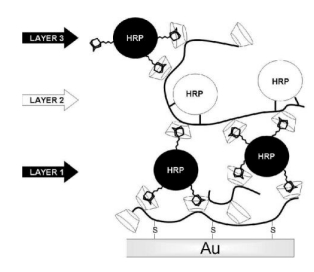
Villalonga R, Díez P, Gamella M, et al. (2012) Layer-by-layer supramolecular architecture of cyclodextrin-modified PAMAM dendrimers and adamantane-modified peroxidase on gold surface for electrochemical biosensing. Electrochim Acta 76: 249–255. doi: 10.1016/j.electacta.2012.05.025
    [74] Zhu X, Loh X (2015) Layer-by-layer assemblies for antibacterial applications. Biomater Sci 3: 1505–1518. doi: 10.1039/C5BM00307E
    [75] Wei T, Zhan W, Cao L, et al. (2016) Multifunctional and regenerable antibacterial surfaces fabricated by a universal strategy. ACS Appl Mater Interfaces 8: 30048–30057. doi: 10.1021/acsami.6b11187
    [76] Qu Y, Wei T, Zhan W, et al. (2017) A reusable supramolecular platform for the specific capture and release of proteins and bacteria. J Mater Chem B 5: 444–453. doi: 10.1039/C6TB02821G
    [77] Xu G, Pranantyo D, Xu L, et al. (2016) Antifouling, antimicrobial, and antibiocorrosion multilayer coatings assembled by layer-by-layer deposition involving host-guest interaction. Ind Eng Chem Res 55: 10906–10915. doi: 10.1021/acs.iecr.6b02190
    [78] Wang Z, Feng Z, Gao C (2008) Stepwise assembly of the same polyelectrolytes using host-guest interaction to obtain microcapsules with multiresponsive properties. Chem Mater 20: 4194–4199. doi: 10.1021/cm8003358
    [79] Li C, Luo G, Wang H, et al. (2011) Host-guest assembly of pH-responsive degradable microcapsules with controlled drug release behavior. J Phys Chem C 115: 17651–17659. doi: 10.1021/jp203940s
    [80] Luo G, Xu X, Zhang J, et al. (2012) Encapsulation of an adamantane-doxorubicin prodrug in pH-responsive polysaccharide capsules for controlled release. ACS Appl Mater Interfaces 4: 5317–5324. doi: 10.1021/am301258a
    [81] Xiao W, Chen W, Zhang J, et al. (2011) Design of a photoswitchable hollow microcapsular drug delivery system by using a supramolecular drug-loading approach. J Phys Chem B 115: 13796–13802. doi: 10.1021/jp208692c
    [82] Lin H, Xiao W, Qin S, et al. (2014) Switch on/off microcapsules for controlled photosensitive drug release in a 'release-cease-recommence' mode. Polym Chem 5: 4437–4440.
    [83] 
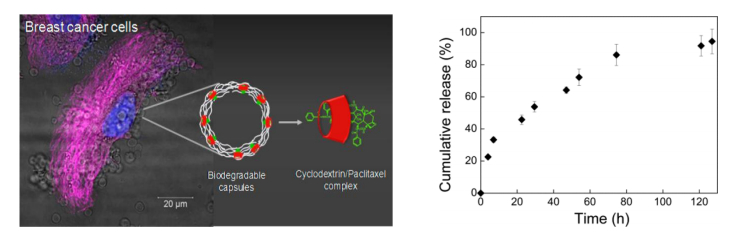
Jing J, Szarpak-Jankowska A, Guillot R, et al. (2013) Cyclodextrin/paclitaxel complex in biodegradable capsules for breast cancer treatment. Chem Mater 25: 3867–3873. doi: 10.1021/cm4019925
    [84] Tejashri G, Amrita B, Darshana J (2013) Cyclodextrin based nanosponges for pharmaceutical use: A review. Acta Pharmaceut 63: 335–358.
    [85] Cho E, Jung S (2015) Supramolecular complexation of carbohydrates for the bioavailability enhancement of poorly soluble drugs. Molecules 20: 19620–19646. doi: 10.3390/molecules201019620
    [86] Antoniuk I, Amiel C (2016) Cyclodextrin-mediated hierarchical self-assembly and its potential in drug delivery applications. J Pharm Sci 105: 2570–2588. doi: 10.1016/j.xphs.2016.05.010
    [87] Kurapati R, Raichur AM (2013) Composite cyclodextrin-calcium carbonate porous microparticles and modified multilayer capsules: novel carriers for encapsulation of hydrophobic drugs. J Mater Chem B 1: 3175–3184. doi: 10.1039/c3tb20192a
    [88] Martin A, Tabary N, Leclercq L, et al. (2013) Multilayered textile coating based on a b-cyclodextrin polyelectrolyte for the controlled release of drugs. Carbohyd Polym 93: 718–730. doi: 10.1016/j.carbpol.2012.12.055
    [89] 
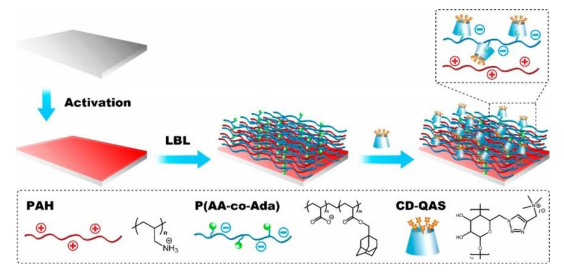
Junthip J, Tabary N, Chai F, et al. (2016) Layer-by-layer coating of textile with two oppositely charged cyclodextrin polyelectrolytes for extended drug delivery. J Biomed Mater Res A 104: 1408–1424. doi: 10.1002/jbm.a.35674
    [90] Gómez-Galván F, Pérez-Álvarez L, Matas J, et al. (2016) Preparation and characterization of soluble branched ionic b-cyclodextrin and their inclusion complexes with triclosan. Carbohyd Polym 142: 149–157. doi: 10.1016/j.carbpol.2016.01.046
    [91] Pérez-Álvarez L, Matas J, Gómez-Galván F, et al. (2017) Branched and ionic b-cyclodextrin multilayer assembling onto polyacrylonitrile membranes for removal and controlled release of triclosan. Carbohyd Polym 156: 143–151. doi: 10.1016/j.carbpol.2016.09.020
    [92] Hashide R, Yoshida K, Hasebe Y, et al. (2012) Insulin-containing layer-by-layer films deposited on poly(lactic acid) microbeads for pH-controlled release of insulin. Colloid Surface B 89: 242–247. doi: 10.1016/j.colsurfb.2011.09.023
    [93] Masood F (2016) Polymeric nanoparticles for targeted drug delivery system for cancer therapy. Mater Sci Eng C 60: 569–578. doi: 10.1016/j.msec.2015.11.067
    [94] Fagui AE, Wintgens V, Gaillet C, et al. (2014) Layer-by-layer coated PLA nanoparticles with oppositely charged b-cyclodextrin polymer for controlled delivery of lipophilic molecules. Macromol Chem Phys 215: 555–565. doi: 10.1002/macp.201300693
    [95] Xuan H, Ren J, Zhang J, et al. (2017) Novel highly-flexible, acid-resistant and self-healing host-guest transparent multilayer films. Appl Surf Sci 411: 303–314. doi: 10.1016/j.apsusc.2017.03.129
    [96] Xuan H, Ren J, Wang X, et al. (2017) Flame-retardant, non-irritating and self-healing multilayer films with double-network structure. Compos Sci Technol 145: 15–23. doi: 10.1016/j.compscitech.2017.03.038
  • This article has been cited by:

    1. Yue Liu, Siming Liu, Xueying Xu, Pierre Failler, Does Energy Price Induce China’s Green Energy Innovation?, 2020, 13, 1996-1073, 4034, 10.3390/en13154034
    2. Hui An, Ruibo Yang, Xuejiao Ma, Siqi Zhang, Sardar M.N. Islam, An evolutionary game theory model for the inter-relationships between financial regulation and financial innovation, 2021, 55, 10629408, 101341, 10.1016/j.najef.2020.101341
    3. Wenhan Wu, Wenzhuo Wu, Kouhua Wu, Chen Ding, The nexus between green innovations and natural resources commodity prices in China, 2022, 78, 03014207, 102719, 10.1016/j.resourpol.2022.102719
  • Reader Comments
  • © 2017 the Author(s), licensee AIMS Press. This is an open access article distributed under the terms of the Creative Commons Attribution License (http://creativecommons.org/licenses/by/4.0)
通讯作者: 陈斌, bchen63@163.com
  • 1. 

    沈阳化工大学材料科学与工程学院 沈阳 110142

  1. 本站搜索
  2. 百度学术搜索
  3. 万方数据库搜索
  4. CNKI搜索

Metrics

Article views(7517) PDF downloads(1378) Cited by(7)

Figures and Tables

Figures(8)

Other Articles By Authors

/

DownLoad:  Full-Size Img  PowerPoint
Return
Return

Catalog