Research article Topical Sections

Electrochemical impedance spectroscopy analysis with a symmetric cell for LiCoO2 cathode degradation correlated with Co dissolution

  • Static degradation of LiCoO2 cathodes is a problem that hinders accurate analysis using our developed separable symmetric cell. Therefore, in this study we investigate the static degradation of LiCoO2 cathodes in separable symmetric cells by electrochemical impedance spectroscopy (EIS) and inductively coupled plasma analyses. EIS measurements of LiCoO2 cathodes are conducted in various electrolytes, with different anions and with or without HF and/or H2O. This allows us to determine the static degradation of LiCoO2 cathodes relative to their increase of charge transfer resistance. The increase of the charge transfer resistance of the LiCoO2 cathodes is attributed to cobalt dissolution from the active material of LiCoO2. Cobalt dissolution from LiCoO2 is revealed to occur even at low potential in the presence of HF, which is generated from LiPF6 and H2O. The results indicate that avoidance of HF generation is important for the analysis of lithium-ion battery electrodes by using the separable cell. These findings reveal the condition to achieve accurate analysis by EIS using the separable cell.

    Citation: Hiroki Nara, Keisuke Morita, Tokihiko Yokoshima, Daikichi Mukoyama, Toshiyuki Momma, Tetsuya Osaka. Electrochemical impedance spectroscopy analysis with a symmetric cell for LiCoO2 cathode degradation correlated with Co dissolution[J]. AIMS Materials Science, 2016, 3(2): 448-459. doi: 10.3934/matersci.2016.2.448

    Related Papers:

    [1] Marcella Noorman, Richard Allen, Cynthia J. Musante, H. Thomas Banks . Analysis of compartments-in-series models of liver metabolism as partial differential equations: the effect of dispersion and number of compartments. Mathematical Biosciences and Engineering, 2019, 16(3): 1082-1114. doi: 10.3934/mbe.2019052
    [2] Leandro Donisi, Giuseppe Cesarelli, Pietro Balbi, Vincenzo Provitera, Bernardo Lanzillo, Armando Coccia, Giovanni D'Addio . Positive impact of short-term gait rehabilitation in Parkinson patients: a combined approach based on statistics and machine learning. Mathematical Biosciences and Engineering, 2021, 18(5): 6995-7009. doi: 10.3934/mbe.2021348
    [3] Yingjian Yang, Qiang Li, Yingwei Guo, Yang Liu, Xian Li, Jiaqi Guo, Wei Li, Lei Cheng, Huai Chen, Yan Kang . Lung parenchyma parameters measure of rats from pulmonary window computed tomography images based on ResU-Net model for medical respiratory researches. Mathematical Biosciences and Engineering, 2021, 18(4): 4193-4211. doi: 10.3934/mbe.2021210
    [4] Chenkai Chang, Fei Qi, Chang Xu, Yiwei Shen, Qingwu Li . A dual-modal dynamic contour-based method for cervical vascular ultrasound image instance segmentation. Mathematical Biosciences and Engineering, 2024, 21(1): 1038-1057. doi: 10.3934/mbe.2024043
    [5] Zhaoyu Chen, Hongbo Fan, Meiyan Ma, Dangguo Shao . FECFusion: Infrared and visible image fusion network based on fast edge convolution. Mathematical Biosciences and Engineering, 2023, 20(9): 16060-16082. doi: 10.3934/mbe.2023717
    [6] Xiao Zou, Jintao Zhai, Shengyou Qian, Ang Li, Feng Tian, Xiaofei Cao, Runmin Wang . Improved breast ultrasound tumor classification using dual-input CNN with GAP-guided attention loss. Mathematical Biosciences and Engineering, 2023, 20(8): 15244-15264. doi: 10.3934/mbe.2023682
    [7] Virginia Giorno, Serena Spina . On the return process with refractoriness for a non-homogeneous Ornstein-Uhlenbeck neuronal model. Mathematical Biosciences and Engineering, 2014, 11(2): 285-302. doi: 10.3934/mbe.2014.11.285
    [8] Hu Dong, Gang Liu, Xin Tong . Influence of temperature-dependent acoustic and thermal parameters and nonlinear harmonics on the prediction of thermal lesion under HIFU ablation. Mathematical Biosciences and Engineering, 2021, 18(2): 1340-1351. doi: 10.3934/mbe.2021070
    [9] Xiujun Zhang, H. G. Govardhana Reddy, Arcot Usha, M. C. Shanmukha, Mohammad Reza Farahani, Mehdi Alaeiyan . A study on anti-malaria drugs using degree-based topological indices through QSPR analysis. Mathematical Biosciences and Engineering, 2023, 20(2): 3594-3609. doi: 10.3934/mbe.2023167
    [10] Xin Chen, Tengda Li, Will Cao . Optimizing cancer therapy for individuals based on tumor-immune-drug system interaction. Mathematical Biosciences and Engineering, 2023, 20(10): 17589-17607. doi: 10.3934/mbe.2023781
  • Static degradation of LiCoO2 cathodes is a problem that hinders accurate analysis using our developed separable symmetric cell. Therefore, in this study we investigate the static degradation of LiCoO2 cathodes in separable symmetric cells by electrochemical impedance spectroscopy (EIS) and inductively coupled plasma analyses. EIS measurements of LiCoO2 cathodes are conducted in various electrolytes, with different anions and with or without HF and/or H2O. This allows us to determine the static degradation of LiCoO2 cathodes relative to their increase of charge transfer resistance. The increase of the charge transfer resistance of the LiCoO2 cathodes is attributed to cobalt dissolution from the active material of LiCoO2. Cobalt dissolution from LiCoO2 is revealed to occur even at low potential in the presence of HF, which is generated from LiPF6 and H2O. The results indicate that avoidance of HF generation is important for the analysis of lithium-ion battery electrodes by using the separable cell. These findings reveal the condition to achieve accurate analysis by EIS using the separable cell.


    1. Introduction

    The mathematical formalisation of cell motion is a fascinating topic which has attracted the attention of physicists and mathematicians over the past fifty years. In more recent times, the development of sophisticated technologies capable of capturing high-resolution videos of moving cells has renewed the interest of the physical and mathematical communities. This has promoted the formulation of several models, which rely on different mathematical approaches, to reproduce qualitative behaviours emerging from cell motion. We refer the interested reader to[1, 2, 5, 7, 8, 9, 10, 11, 14, 17, 18, 22, 31, 36, 37] and references therein.

    Accumulating evidence indicates that the interaction between epithelial and mesenchymal cells plays a pivotal role in cancer development and metastasis formation [20, 39, 40]. Here we propose a model for the co-culture dynamics of epithelial-like and mesenchymal-like cells. In our model, mesenchymal-like and epithelial-like cells in motion are grouped into two distinct populations. Following a kinetics approach, the microscopic state of each cell is identified by its position and velocity (i.e., a point in the phase space), and the two populations are characterised through the related phase space densities. Macroscopic quantities (e.g., local cell densities) are then expressed in terms of microscopic averages [3, 4]. We make use of the mesoscopic formalism developed in[8, 22] to include microscopic aspects of cell motion which cannot be captured by macroscopic models. Moreover, we adapt the strategies presented in[15] to model proliferation, competition for nutrients and adhesive interactions between epithelial-like cells.

    A calibration of the model based on experimental datasets is beyond our present scope. In this work, our aim, rather, is to present a sample of numerical results which display the emergence of different spatial patterns, depending on parameters and initial data. The remainder of the paper is organised as follows. The main features of the biological system and the mathematical model are introduced in Section 2. In Section 3, we discuss the main numerical results. Finally, some research perspectives are summarised in Section 4.


    2. The model

    In this section, we introduce the key features of the biological system and the mathematical model. In Subsection 2.1, we state the biological problem and the assumptions we need in view of the mathematical formalisation. In Subsection 2.2, we describe the modelling strategies we designed to translate the biological phenomena into mathematical terms, and we present the model.


    2.1. Brief phenomenological overview and main assumptions

    The term Epithelial-Mesenchymal Transition (EMT) refers to the temporary and reversible switching between epithelial and mesenchymal phenotypes. During EMT, non-motile epithelial cells, collectively embedded via cell-cell junctions (i.e., homotypic adhesion), convert into motile mesenchymal cells [20, 39]. This strongly reduces cell adhesion and enhances cell motility.

    EMT is commonly observed in various non-pathological conditions, namely during embryonic development and tissue repair in the adult organism. However, this phenotypic reprogramming has been linked to cancer progression [39,40]. For instance, EMT may favour the seeding of secondary tumours at distant sites and the creation of metastases [20]. In particular, EMT has been implicated in the formation of the fibrous capsules observed in hepatic tumours, which seem to be mainly composed of cells that express a mesenchymal-like phenotype [25].

    We consider a monolayer of epithelial-like and mesenchymal-like cells in co-culture on a regular plastic surface (i.e., a petri dish). Cellular movement is seen as the superposition of persistent spontaneous motion and chemotactic response. The former is due to the tendency of cells to randomly orient themselves, whilst the latter is guided by chemotactic cytokines. In this framework, we focus on the following biological phenomena:

    (ⅰ) secretion from cells of chemotactic cytokines;

    (ⅱ) diffusion and consumption of chemotactic cytokines;

    (ⅲ) random motion of cells and chemotaxis;

    (ⅳ) adhesive interactions between epithelial cells;

    (ⅴ) cell proliferation and competition for nutrients.

    To reduce biological complexity to its essence, we make the prima facie assumption that the diffusion of chemotactic cytokines is isotropic. Moreover, we model cell motion in two dimensions only, since we focus on a monolayer co-culture (i.e., we let cells grow side by side and not one on top of the other), and we assume that the status of motion of a cell is left unaltered by interactions which do not lead to homotypic adhesion. Finally, we stress that this paper does not deal with several evolutionary aspects. For instance, we consider a sample where both epithelial-like and mesenchymal-like cells are present from the beginning, and we do not let EMT occur. Moreover, we do not include the effects of cellular heterogeneity and therapeutic actions, which we explored previously in[12,15, 16, 28, 29].


    2.2. Mathematical formalisation

    We divide epithelial-like and mesenchymal-like cells in motion into two populations labeled, respectively, by the index $i=1$ and $i=2$. We identify the microscopic state of each moving cell by its instantaneous position and velocity, which are described by the continuous variables $\mathbf{x} = (x,y) \in X \subset \mathbb{R}^2$ and $\mathbf{v} = (v_x,v_y) \in V \subset \mathbb{R}^2$. We let the set $V$ be compact and spherically symmetric [8]. Furthermore, we group epithelial-like cells at rest due to homotypic adhesion and chemotactic cytokines into two additional populations, labeled by the index $i=3$ and $i=4$, and we model their microscopic states by means of the $\mathbf{x}$ variable only.

    At any instant of time $t$, these populations are characterised, respectively, by the phase space densities

    $ f_1 = f_1 (t,\mathbf{x},\mathbf{v}): \mathbb{R}_+ \times X \times V \to \mathbb{R}_+, f_2 = f_2 (t,\mathbf{x},\mathbf{v}): \mathbb{R}_+ \times X \times V \to \mathbb{R}_+ \nonumber $

    and the local densities

    $ n_3 = n_3 (t,\mathbf{x}): \mathbb{R}_+ \times X \to \mathbb{R}_+, n_4 = n_4 (t,\mathbf{x}): \mathbb{R}_+ \times X \to \mathbb{R}_+. \nonumber $

    The local densities of cells in motion and the local cell density can be computed as

    $ n_{1,2}(t,\mathbf{x}) = \int_{V} f_{1,2}(t,\mathbf{x},\mathbf{v}) d\mathbf{v}, \varrho(t,\mathbf{x}) = \sum\limits_{i=1}^3 n_i(t,\mathbf{x}), $ (1)

    while the total cell density and the average local cell density are

    $ N(t) = \int_{X} \varrho(t,\mathbf{x}) d\mathbf{x}, \bar{\varrho}(t) = \frac{N(t)}{|X|}, $ (2)

    where $|X|$ denotes the measure of the set $X$.

    The following notations and assumptions are used to model the biological phenomena of interest (vid. Table 1 for a summary of the model parameters):

    Table 1. Summary of the model parameters.
    Biological Phenomena Parameters
    Secretion from cells of chemotactic cytokines $\nu$
    Consumption of chemotactic cytokines $\alpha$
    Random motion vs chemotactic reorientation $\beta$
    Homotypic adhesion $\gamma$
    Cell proliferation $\kappa$
    Competition for nutrients $\mu$
     | Show Table
    DownLoad: CSV

    $\bullet$ Secretion from cells of chemotactic cytokines. Cells in population $i=1,2,3$ secrete cytokines responsible for chemotaxis at an average rate $\nu \in \mathbb{R}_+$.

    $\bullet$ Diffusion and consumption of chemotactic cytokines. Chemotactic cytokines diffuse across the culture system with unitary diffusion constant. Moreover, the concentration of cytokines decreases over time due to the consumption by cells, which occurs at a rate described by the functional $\mathcal{A}(\varrho(t,\mathbf{x});\alpha) \geq 0$. The parameter $\alpha \in \mathbb{R}_+$ stands for the average consumption rate and, as a first attempt to take into account the nonlinear nature of cell-cytokine interactions [6], we define the functional $\mathcal{A}$ as

    $ \mathcal{A}(\varrho;\alpha) := \alpha \; \varrho(t,\mathbf{x})^2. $ (3)

    $\bullet$ Random motion of cells and chemotaxis. Using a velocity jump formalism [8, 22], we assume that a cell in the state $(\mathbf{x},\mathbf{v}_*)$ of the population $i=1,2$ can jump into the state $(\mathbf{x},\mathbf{v})$ of the same population at a rate described by the functional

    $ \mathcal{B}(\mathbf{v}, \nabla_{\mathbf{x}} n_4; \beta, |V|) := \frac{1}{|V|} \; + \; b(|\mathbf{v}|, |\nabla_{\mathbf{x}} n_4|; \beta, |V|) \left(\mathbf{v} \cdot \nabla_{\mathbf{x}} n_4(t,\mathbf{x}) \right) $ (4)

    with

    $ b(|\mathbf{v}|, |\nabla_{\mathbf{x}} n_4|; \beta, |V|) : = \frac{|V|^{-1}}{\beta + |\mathbf{v}| |\nabla_{\mathbf{x}} n_4(t,\mathbf{x})|}. $ (5)

    The functional $\mathcal{B}$ satisfies

    $ \int_V \mathcal{B}(\mathbf{v}, \cdot; \beta, |V|) d\mathbf{v} = 1, \forall \beta, |V| \in \mathbb{R}_+. $ (6)

    In definition (4), $|V|$ denotes the measure of the set $V$, and the parameter $\beta \in \mathbb{R}_+$ provides an average measure of the relative contribution of random motion versus chemotactic reorientation on cell movement. The first term of definition (4) translates into mathematical terms the idea that random motion does not favour any precise velocity (i.e., when a moving cell reorients itself and jump from the state $(\mathbf{x},\mathbf{v}_*)$ to the state $(\mathbf{x},\mathbf{v})$, all values of $\mathbf{v}$ are equiprobable). In the second term, the scalar product models the tendency of cells to follow the cytokine gradient independently from their current velocity (i.e., the chemotactic response leads a moving cell in the state $(\mathbf{x},\mathbf{v}_*)$ to jump to the state $(\mathbf{x},\mathbf{v})$, with $\mathbf{v}$ pointing in the direction of $\nabla_{\mathbf{x}} n_4$ independently from the direction of the vector $\mathbf{v}_*$). Definition (5) preserves the non-negativity of the functional $\mathcal{B}$, and ensures that smaller values of the parameter $\beta$ will correspond to a stronger influence of chemotactic reorientation on cell motion.

    $\bullet$ Adhesive interactions between epithelial cells. Encounters between a cell in the state $(\mathbf{x},\mathbf{v}^*)$ of population $j=1$ (or the state $\mathbf{x}$ of population $j=3$) and a cell in the state $(\mathbf{x},\mathbf{v}_*)$ of population $i=1$ can lead the latter to reach either the state $(\mathbf{x},\mathbf{v})$ of the same population (i.e., the adhesive interaction fails) or the state $\mathbf{x}$ of population $h=3$ (i.e., the adhesive interaction leads to homotypic adhesion). For the sake of simplicity, we assume that encounters between epithelial-like cells occur at unitary rate, and we define the rate of adhesive interactions as

    $ \mathcal{G}^h_{ij}(\mathbf{v}; \gamma, |V|) := {γ|V|,if i=1,j=1,3and h=31γ|V|,if i=1,j=1,3and h=10,otherwise,
    \forall \; \mathbf{v} \in V, $
    (7)
    $ \sum\limits_{h=1}^{3} \int_V \mathcal{G}^h_{ij}(\mathbf{v}; \gamma, |V|) d\mathbf{v} = 1, \mbox{for} \; \gamma \in [0,1], \; |V| \in \mathbb{R}_+, \; i=1 \mbox{ and } j=1,3. $ (8)

    In definition (7), the parameter $\gamma \in [0,1]$ stands for the average rate of homotypic adhesion, while the factor $1/{|V|}$ accounts for the fact that the interactions under consideration are independent from the velocities of the interacting cells.

    $\bullet$ Cell proliferation and competition for nutrients. The parameter $\kappa \in \mathbb{R}_+$ stands for the average cell proliferation rate. Furthermore, since the proliferation of cells is limited by the competition for nutrients, we introduce a death term $\mathcal{M}(N;\mu)$. The parameter $\mu \in \mathbb{R}_+$ stands for the average rate of death. Among all possible definitions of the functional $\mathcal{M}$, we make use of the following one

    $ \mathcal{M}(N;\mu) := \mu \; N(t), $ (9)

    which relies on the natural assumption that a higher total density of cells corresponds to a lower concentration of available nutrients, and thus to a higher chance of cell death.

    The evolution of the functions $f_1(t,\mathbf{x},\mathbf{v})$, $f_2(t,\mathbf{x},\mathbf{v})$, $n_3(t,\mathbf{x})$ and $n_4(t,\mathbf{x})$ is governed by the equations given hereafter, which describe the net inlet of moving epithelial-like and mesenchymal-like cells through the volume element $d\mathbf{x} \; d\mathbf{v}$ centered at $(\mathbf{x},\mathbf{v})$, as well as the net flux of epithelial-like cells at rest and chemotactic cytokines through the volume element $d\mathbf{x}$ centered at $\mathbf{x}$:

    $ tf1(t,x,v)+vxf1(t,x,v)=VB(v,xn4;β,|V|)f1(t,x,v)dvf1(t,x,v) inflow & outflow due to random motion and chemotactic reorientation+VVG111(v;γ,|V|)f1(t,x,v)f1(t,x,v)dvdv inflow due to changes of velocity caused by adhesive interactions+n3(t,x)VG113(v;γ,|V|)f1(t,x,v)dv inflow due to changes of velocity caused by adhesive interactionsf1(t,x,v)VV(G111(v;γ,|V|)+G311(v;γ,|V|))f1(t,x,v)dvdv outflow due to homotypic adhesionf1(t,x,v)n3(t,x)V(G113(v;γ,|V|)+G313(v;γ,|V|))dv outflow due to homotypic adhesion+κf1(t,x,v)M(N;μ)f1(t,x,v) proliferation and competition,
    $
    (10)
    $ tf2(t,x,v)+vxf2(t,x,v) =VB(v,xn4;β,|V|)f2(t,x,v)dvf2(t,x,v) inflow & outflow due to random motion and chemotactic reorientation+κf2(t,x,v)M(N;μ)f2(t,x,v) proliferation and competition,
    $
    (11)
    $ tn3(t,x)=VVVG311(v;γ,|V|)f1(t,x,v)f1(t,x,v)dvdvdv inflow due to homotypic adhesion+n3(t,x)VVG313(v;γ,|V|)f1(t,x,v)dvdv inflow due to homotypic adhesion+κn3(t,x)M(N;μ)n3(t,x) proliferation and competition,
    $
    (12)
    $ \partial_t n_4(t,\mathbf{x}) = \underbrace{\nu \; \varrho(t,\mathbf{x}) + \Delta_\mathbf{x} n_4(t,\mathbf{x})}_{\mbox{ secretion and diffusion}} - \underbrace{\mathcal{A}(\varrho;\alpha) \; n_4(t,\mathbf{x}).}_{\mbox{ consumption}} $ (13)

    Plugging definitions (3), (4), (5), (7) and (9) into equations (10)-(13), we obtain

    $ tf1+vxf1=1|V|(1+vxn4β+|v||xn4|)n1f1 random motion and chemotactic reorientation+(1γ)|V|n1(n1+n3)(n1+n3)f1 homotypic adhesion+(κμN)f1, proliferation and competition
    $
    (14)
    $ tf2+vxf2=1|V|(1+vxn4β+|v||xn4|)n2f2 random motion and chemotactic reorientation+(κμN)f2, proliferation and competition
    $
    (15)
    $ tn3=γ(n1+n3)n1 homotypic adhesion+(κμN)n3, proliferation and competition
    $
    (16)
    $ tn4=νϱ+Δxn4 secretion and diffusionαn4ϱ2. consumption
    $
    (17)

    3. Main results

    In this section, we discuss a sample of numerical results which display the emergence of different spatial patterns, depending on parameters and initial data. In Subsection 3.1, we describe the simulation setup and the method we use for calculating numerical solutions. In Subsection 3.2, we focus on a sample composed of mesenchymal-like cells only, where proliferation and competition phenomena do not take place. The results we present highlight how different initial cell densities can cause the emergence of different spatial patterns, such as spots, stripes and hole structures. In Subsection 3.3, we show that, when there is little competition for nutrients, epithelial-like and mesenchymal-like cells can segregate and create honeycomb structures. Finally, the simulations discussed in Subsection 3.4 provide a possible explanation for how the interplay between epithelial-cell adhesion and mesenchymal-cell spreading paves the way for the formation of ring-like structures.


    3.1. Numerical method and simulation setup

    For simplicity, we follow [33] and approximate cellular velocities in polar coordinates. We also assume that all moving cells are characterised by the same modulus of the velocity, which is normalised to unity. This can be justified by noting that the main differences between the adhesive behaviours of epithelial-like and mesenchymal-like cells are already captured by the modelling strategies described in the previous section. As a result, we set

    $ v_x = \cos\theta, v_y = \sin\theta, \theta \in [0,2\pi), $ (18)

    so that the phase space distributions can be computed by tracking velocity angles and space only.

    To perform numerical simulations, we set $X = [-L,L] \times [-L,L]$ and we discretise the computational domain with a uniform mesh as

    $ Δx=L2M,xi=iΔx,i=M,,0,,M,Δy=L2M,yj=jΔy,j=M,,0,,M,Δθ=2πm+1,θk=kΔθ,k=0,,m.
    $

    The phase space densities and the local densities are approximated as

    $ f_{1,2}(t,\mathbf{x},\mathbf{v}) \approx f_{1,2}(h \Delta t,x_i,y_j,\theta_k) = f^h_{1,2}(x_i,y_j,\theta_k) $

    and

    $ n_{3,4}(t,\mathbf{x}) \approx n_{3,4}(h \Delta t, x_i,y_j) = n^h_{3,4}(x_i,y_j), $

    where $\Delta t$ is the time step.

    We numerically solve the problem defined by the discretised versions of equations (14)-(17), periodic boundary conditions and suitable initial data. Simulations are performed in MATLAB with $L=15$, $M=56$, $m=36$ and $\Delta t=0.014$.

    The method for calculating numerical solutions is based on a time-splitting scheme. We begin by updating $f_1^h$ and $f_2^h$ by discretising and solving the homogeneous equations associated to the advection-reaction equations (14) and (15).

    A flux-limiting scheme (see for instance [27]) is used to treat the advective terms. First, we advect $f_1^h$ and $f_2^h$ in the $y$-direction, and we denote the results obtained by $f_1^{h+1/4}$ and $f_2^{h+1/4}$. Secondly, we advect $f_1^{h+1/4}$ and $f_2^{h+1/4}$ in the $x$-direction, and we denote the results obtained by $f_1^{h+1/2}$ and $f_2^{h+1/2}$. In more detail, making use of the notations $f_{1,2}^{h}(x_i, y_j,\theta_k) = f^h_{1,2,i,j,k}$ and dropping the indexes $1,2$ for the sake of readability, we compute

    $ f^{h+1/4}_{i,j,k}=f^{h}_{i,j,k}-\lambda [F_{i,j,k}^h - F^h_{i,j-1,k} ], $

    with $\lambda = \Delta t / \Delta x$ and the flux $F_{i,j,k}^h$ being defined as the combination of a lower order flux (L) and a higher order flux (H), that is,

    $ F _{i,j,k}^h = H_{i,j,k}^h - ( 1 - \phi^h_{i,j,k} ) [H_{i,j,k}^h - L^h_{i,j,k}]. $

    In the above equation,

    $ L^h_{i,j,k} = \sin(\theta_k) \; f^{h}_{i,j,k}, $

    and, according to the Richmyer two-step Lax-Wendroff method,

    $ H^h_{i,j,k} = \sin(\theta_k) \; f^{h+1/4}_{i,j+1/2,k}, $

    with

    $ f^{h+1/4}_{i,j+1/2,k} = {1 \over 2}(f^h_{i,j,k} - f^h_{i,j+1,k} ) - {\lambda \over 2} [L^h_{i,j+1,k} - L^h_{i,j,k}]. $

    The quantity $\phi^h_{i,j,k}$ is the Ultrabee flux limiter, that is,

    $ \phi^h_{i,j,k} = \max(0,\min(1, 2 \; r_{i,j,k}^h),\min(r_{i,j,k}^h, 2)), $

    with

    $ r^h_{i,j,k}= {{{f^h_{i,j,k}} - f^h_{i,j-1,k}} \over {f_{i,j+1,k}^h - f_{i,j,k}^h}}. $

    An analogous procedure is used to compute $f_1^{h+1/2}$ and $f_2^{h+1/2}$.

    Then, we update $f_1^{h+1/2}$ and $f_2^{h+1/2}$ by discretising and solving equations (14) and (15) without advective terms on the left-hand sides. The system of equations obtained after the discretisation is solved by means of a fourth-order Runge-Kutta method. In this way, we obtain $f_1^{h+1}$ and $f_2^{h+1}$.

    On the other hand, $n_3^{h}$ and $n_4^{h}$ are updated, respectively, through the systems of equations resulting from the discretisation of equations (16) and (17), which are solved by using a fourth-order Runge-Kutta method. Thus, we obtain $n_3^{h+1}$ and $n_4^{h+1}$. A classical second-order centred finite difference scheme is used to calculate the numerical solutions of the reaction-diffusion equation (17).

    We consider different initial conditions to mimic different biological scenarios. Moreover, we vary the values of the parameters $\kappa$ and $\mu$, while we keep the other parameters equal to suitable non-zero values. In particular, we set $\nu=1$, $\alpha=0.1$, $\beta=0.1$ and $\gamma=0.1$. Additional simulations show that variations of these parameters, within reasonable ranges, leave the qualitative properties of the emerging patterns unaltered.


    3.2. Emergence of spots, stripes and hole patterns

    We focus on a sample composed of mesenchymal-like cells and chemotactic cytokines only. Cells are initially characterised by a uniform space distribution parametrised by $n^0_2 \in \mathbb{R}_+$, and their velocities are homogeneously distributed. The initial distribution of cytokines is a small positive random perturbation of the zero level. We test the possibility of obtaining different emerging patterns by tuning the value of the initial cell density (i.e., the value of the parameter $n^0_2$). We are interested in the case where the total cell density does not vary over time. Therefore, we neglect the effects of non-conservative phenomena (i.e., we set $\kappa=\mu=0$).

    The results of Fig. 1 highlight how increasing values of the parameter $n^0_2 \in (0.005, 0.1)$ lead to the emergence of different spatial patterns for large values of $t$. These patterns are similar to those observed in macroscopic models of chemotaxis [33], and in other transport models [21, 35]. They also exhibit a dependance on the total cell density and on the size of the spatial domain which is analogous to that of classical models for chemotactic movement (see also Remark 1). In more detail:

    (ⅰ) if $n^0_2 \in (0.005, 0.02)$, the emergent patterns are highly concentrated spots of aggregation [vid. Fig. 1(A)];

    (ⅱ) if $n^0_2 \in (0.02, 0.07)$, the emergent patterns are wider aggregation spots [vid. Fig. 1(B)] or stripes [vid. Fig. 1(C)];

    (ⅲ) if $n^0_2 \in (0.07, 0.15)$, the emergent patterns have a hole structure [vid. Fig. 1(D)].

    Figure 1. Emergence of spots, stripes and hole patterns. Plots of $n_2(t,\mathbf{x})$ at four time instants $t \in [0,400]$. We consider a sample composed of mesenchymal-like cells and chemotactic cytokines only. The cells are initially characterised by a uniform space distribution parametrised by $n^0_2 \in \mathbb{R}_+$, and their velocities are homogeneously distributed. The initial distribution of cytokines is a small positive random perturbation of the zero level. The effects of non-conservative phenomena are neglected (i.e., $\kappa=\mu=0$). Increasing values of the parameter $n^0_2$ pave the way for the emergence of different spatial patterns, such as spots [vid. Panels A and B ($n^0_2=0.02$ and $n^0_2=0.04$)], stripes [vid. Panel C ($n^0_2=0.05$)], and hole structures [vid. Panel D ($n^0_2=0.08$)].

    In analogy with classical macroscopic models of chemotaxis, cells tend to aggregate in the local maxima of the chemoattractant (data not shown). However, the quadratic dependence of the consumption rate of cytokines on the local cell density [see definition (3)] seems to prevent finite time blow-up, which is observed in standard macroscopic models. This allows for the formation of bounded aggregation patterns. Additional simulations (data not shown) suggest that relevant patterns cannot emerge when $n^0_2 < 0.005$ (the density is too low for any spatial organisation of cells) and $n^0_2 > 0.15$ (overcrowding occurs).

    Remark 1.  The total cell density $N(t)$ and the average local cell density $\bar{\varrho}(t)$ [see equations (2)] are preserved, since we are neglecting the effects of non-conservative phenomena (i.e., we set $\kappa=\mu=0$). In particular, $\bar{\varrho}(t)= n^0_2$ for all $t \geq 0$. As a consequence, higher values of the parameter $n^0_2$ correspond to higher values of the average local cell density. This observation supports the idea that the long-time behaviour of the spatial patterns is governed by the asymptotic values of the average local density of cells. Therefore, as a complementary interpretation of the results presented in this subsection, we note that increasing asymptotic values of the average local cell density may induce the formation of different spatial patterns.


    3.3. Emergence of spots, stripes and honeycomb patterns

    We assume that the sample is initially composed of chemotactic cytokines, mesenchymal-like cells and epithelial-like cells in motion. The distribution of cytokines is a small positive random perturbation of the zero level. Cells are uniformly distributed in space and their distributions are parametrised by $n^0_{1} \in \mathbb{R}_+$ and $n^0_{2} \in \mathbb{R}_+$. Moreover, cellular velocities are homogeneously distributed. We test the possibility of obtaining different emerging patterns by varying the value of the quotient of the average rate of proliferation and the average rate of death due to competition for nutrients (i.e., the value of the ratio $\kappa/\mu$). For simplicity, we set $\kappa=1$ and we tune the value of the parameter $\mu$.

    The results in Fig. 2 highlight how decreasing values of the parameter $\mu \in (0.007, 0.2)$ lead, in the limit of large times, to the emergence of different spatial patterns. In fact:

    (ⅰ) if $\mu \in (0.05, 0.2)$, the emergent patterns are highly concentrated spots of epithelial-like and mesenchymal-like cells [vid. Fig. 2(A) and Fig. 2(B)];

    (ⅱ) if $\mu \in (0.015, 0.05)$, the emergent patterns are stripes of epithelial-like and mesenchymal-like cells [vid. Fig. 2(C) and Fig. 2(D)];

    (ⅲ) if $\mu \in (0.007, 0.015)$, the emergent patterns display a honeycomb structure, which results from the segregation between epithelial-like and mesenchymal-like cells [vid. Fig. 2(E) and Fig. 2(F)], an emergent behaviour documented in the biological literature [26, 30].

    Figure 2. Emergence of spots, stripes and honeycomb patterns. We consider a sample initially composed of chemotactic cytokines, mesenchymal-like cells and epithelial-like cells in motion. The distribution of cytokines is a small positive random perturbation of the zero level. Cells are uniformly distributed in space and their distributions are parametrised by $n^0_{1,2}=0.04$. Cellular velocities are homogeneously distributed. We set $\kappa=1$ and tune the value of $\mu$. Decreasing values of parameter $\mu$ pave the way for the emergence of different spatial patterns, such as spots [vid. Panels A and B ($\mu=0.1$)], stripes [vid. Panels C and D ($\mu=0.02$)], and segregation patterns with a honeycomb structure [vid. Panels E and F ($\mu=0.01$)].

    These results have been obtained with $n^0_{1,2}=0.04$. Additional simulations (data not shown) support the idea that the values of the parameters $n^0_{1}$ and $n^0_{2}$ do not affect the qualitative properties of the patterns shown in Fig. 2. In fact, in agreement with the considerations drawn in Remark 1, the numerical results presented here suggest that the long-time behaviour of the spatial patterns depend on the asymptotic values attained by the average local cell density $\bar{\varrho}(t)$, which can be easily proven to be equal to $\kappa \; (\mu |X|)^{-1}$. In more detail,

    (ⅰ) when $\mu=0.1$, $\displaystyle{\lim_{t \to +\infty} \bar{\varrho}(t) \approx 0.01}$ and we observe the emergence of highly concentrated spots [to be compared with case (i) of Subsection 3.2];

    (ⅱ) when $\mu=0.02$, $\displaystyle{\lim_{t \to +\infty} \bar{\varrho}(t) \approx 0.05}$ and we observe the emergence of stripes [to be compared with case (ⅱ) of Subsection 3.2];

    (ⅲ) when $\mu=0.01$, $\displaystyle{\lim_{t \to +\infty} \bar{\varrho}(t) \approx 0.1}$ and we observe the emergence of segregation patterns with a honeycomb structure [to be compared with case (ⅲ) of Subsection 3.2].

    Additional simulations (data not shown) support the conclusion that relevant patterns cannot emerge for $\mu > 0.2$ (the asymptotic value of $\bar{\varrho}(t)$ is too low for any spatial organisation of cells) and $\mu < 0.007$ (the asymptotic value of $\bar{\varrho}(t)$ is too high and overcrowding occurs).


    3.4. Formation of ring-like patterns

    We consider a sample where epithelial-like cells at rest and chemotactic cytokines are not present at time $t=0$. The initial cell distributions are radially symmetric in space, and the cell velocities are homogeneously distributed, that is,

    $ f_{1,2}(t=0,x,y, \theta)= C_{1,2} \; e^{-\frac{{x}^2+{y}^2}{20}}, \forall \; (x,y, \theta) \in X \times [0, 2 \pi), \;C_{1,2} \in \mathbb{R_+}. $ (19)

    We are interested in the case where the total cell density does not vary over time. Therefore, we neglect the effects of non-conservative phenomena (i.e., we set $\kappa=\mu=0$).

    The results presented in Fig. 3 show that, while epithelial-like cells rapidly stop moving because of adhesive interactions [vid. Fig. 3(A)], mesenchymal-like cells diffuse throughout the sample [vid. Fig. 3(B)] and follow the chemotactic path created by the diffusing cytokines [vid. Fig. 3(C)]. The resulting pattern is an expanding ring-like structure made of mesenchymal-like cells, which surrounds a cluster of epithelial-like cells kept at rest by homotypic adhesion.

    Figure 3. Formation of ring-like patterns. Plots at four time instants $t \in [0, 40]$ of of $n_1(t,\mathbf{x}) + n_3(t,\mathbf{x})$ (Panel A), $n_2(t,\mathbf{x})$ (Panel B) and $n_4(t,\mathbf{x})$ (Panel C). We consider a sample initially composed of mesenchymal-like cells and epithelial-like cells in motion only, whose distributions are modelled by (19). The effects of non-conservative phenomena are neglected (i.e., $\kappa=\mu=0$). While epithelial-like cells rapidly stop moving because of adhesive interactions (vid. Panel A), mesenchymal-like cells diffuse throughout the sample (vid. Panel B), and follow the chemotactic path defined by the diffusing cytokines (vid. Panel C). The resulting pattern is an expanding ring-like structure made of mesenchymal-like cells, which surrounds a cluster of epithelial-like cells kept at rest by homotypic adhesion.

    The results presented here have been obtained with $C_{1,2}=10$. Additional simulations (data not shown) suggest that the values of the parameters $C_{1,2}$ do not influence the qualitative properties of the patterns in Fig. 3. In fact, these patterns result from the interplay between the radial symmetry of the initial cell distributions, the absence of chemotactic cytokines inside the system at time $t=0$, the tendency of epithelial-like cells to stop moving because of homotypic adhesion, and the fact that mesenchymal-like cells spread throughout the sample following the gradient of chemotactic cytokines.

    Such ring-like structures of mesenchymal-like cells resemble the fibrous capsules observed in hepatic tumours, which seem to be mainly composed of cells expressing a mesenchymal-like phenotype [25]. They also share some striking similarities with patterns arising from different biological contexts, such as tumour growth [13] and evolution of bacterial populations [38], and with the outcomes of chemotaxis models that incorporate some specific effects related to the finite size of individual cells [35].


    4. Conclusions and perspectives

    We have developed an integro-differential model for the co-culture dynamics of epithelial-like and mesenchymal-like cells. The strategy that we have used to model the consumption of the chemoattractant seems to prevent blow-up in finite time, which is usually observed in classical macroscopic models of chemotaxis. This allows for the formation of bounded aggregation patterns, whose long-time behaviour depends on the asymptotic value of the average local density of cells. In fact, higher asymptotic values of the average local cell density lead to the emergence of different spatial patterns, such as spots, stripes and honeycomb structures. Furthermore, our results support the idea that epithelial-like and mesenchymal-like cells can segregate when there is little competition for nutrients. Finally, we have shown how the interplay between epithelial-cell adhesion and mesenchymal-cell spreading can pave the way for the formation of ring-like structures, which resemble the fibrous capsules frequently observed in hepatic tumours.

    Future research will be addressed to refine the current modelling strategies. For instance, a natural improvement of the model would be to define the rate of death due to competition for nutrients as a function of the local cell density. Furthermore, since cell motion implies resource reallocation (i.e., redistribution of energetic resources from proliferation-oriented tasks toward development and maintenance of motility), it might be worth considering different proliferation/death rates for moving cells and cells at rest. From the analytical point of view, it would be interesting to study the ring-like patterns discussed in Subsection 3.4. In this respect, the techniques employed in [38] may prove to be useful. Finally, spatial dynamics play a pivotal role in the evolution of many living complex systems, including biological and social systems (see for instance [32]). Therefore, another possible research direction would be to investigate if the modelling approach presented here could be used profitably to model the dynamics of other living systems.


    [1] Nishi Y (2001) Lithium ion secondary batteries; past 10 years and the future. J Power Sources 100: 101–106.
    [2] Etacheri V, Marom R, Elazari R, et al. (2011) Challenges in the development of advanced Li-ion batteries: a review. Energy Environ Sci 4: 3243–3262. doi: 10.1039/c1ee01598b
    [3] Dunn B, Kamath H, Tarascon J-M (2011) Electrical energy storage for the grid: a battery of choices. Science 334: 928–935. doi: 10.1126/science.1212741
    [4] Yang Z, Zhang J, Kintner-Meyer MCW, et al. (2011) Electrochemical Energy Storage for Green Grid. Chem Rev 111: 3577–3613. doi: 10.1021/cr100290v
    [5] Broussely M, Biensan P, Bonhomme F, et al. (2005) Main aging mechanisms in Li ion batteries. J Power Sources 146: 90–96. doi: 10.1016/j.jpowsour.2005.03.172
    [6] Vetter J, Novák P, Wagner MR, et al. (2005) Ageing mechanisms in lithium-ion batteries. J Power Sources 147: 269–281.
    [7] Smart MC, Ratnakumar BV (2011) Effects of Electrolyte Composition on Lithium Plating in Lithium-Ion Cells. J Electrochem Soc 158: A379–A389. doi: 10.1149/1.3544439
    [8] Aurbach D, Markovsky B, Salitra G, et al. (2007) Talyossef, M. Koltypin, et al., Review on electrode–electrolyte solution interactions, related to cathode materials for Li-ion batteries. J Power Sources 165: 491–499.
    [9] Aurbach D, Markovsky B, Rodkin A, et al. (2002) On the capacity fading of LiCoO2 intercalation electrodes. Electrochimica Acta 47: 4291–4306. doi: 10.1016/S0013-4686(02)00417-6
    [10] Takami N, Satoh A, Hara M, et al. (1995) Structural and Kinetic Characterization of Lithium Intercalation into Carbon Anodes for Secondary Lithium Batteries. J Electrochem Soc 142: 371–379. doi: 10.1149/1.2044017
    [11] Aurbach D, Levi MD, Levi E, et al. (1998) Common Electroanalytical Behavior of Li Intercalation Processes into Graphite and Transition Metal Oxides. J Electrochem Soc 145: 3024–3034. doi: 10.1149/1.1838758
    [12] Markovsky B, Levi MD, Aurbach D (1998) The basic electroanalytical behavior of practical graphite–lithium intercalation electrodes. Electrochimica Acta 43: 2287–2304. doi: 10.1016/S0013-4686(97)10172-4
    [13] Barsoukov E, Kim JH, Yoon CO, et al. (1999) Kinetics of lithium intercalation into carbon anodes: in situ impedance investigation of thickness and potential dependence. Solid State Ionics.
    [14] Zhang D, Haran BS, Durairajan A, et al. (2000) Studies on capacity fade of lithium-ion batteries. J Power Sources 91: 122–129. doi: 10.1016/S0378-7753(00)00469-9
    [15] Nagasubramanian G (2000) Two- and three-electrode impedance studies on 18650 Li-ion cells. J Power Sources 87: 226–229. doi: 10.1016/S0378-7753(99)00469-3
    [16] Li J, Murphy E, Winnick J, et al. (2001) Studies on the cycle life of commercial lithium ion batteries during rapid charge–discharge cycling. J Power Sources 102: 294–301. doi: 10.1016/S0378-7753(01)00821-7
    [17] Seki S, Kihira N, Mita Y, et al. (2011) AC Impedance Study of High-Power Lithium-Ion Secondary Batteries—Effect of Battery Size. J Electrochem Soc 158: A163–A166. doi: 10.1149/1.3525277
    [18] Mukoyama D, Momma T, Nara H, et al. (2012) Electrochemical Impedance Analysis on Degradation of Commercially Available Lithium Ion Battery during Charge–Discharge Cycling. Chem Lett 41: 444–446. doi: 10.1246/cl.2012.444
    [19] Osaka T, Momma T, Mukoyama D, et al. (2012) Proposal of novel equivalent circuit for electrochemical impedance analysis of commercially available lithium ion battery. J Power Sources 205: 483–486.
    [20] Hang T, Mukoyama D, Nara H, et al. (2013) Electrochemical impedance spectroscopy analysis for lithium-ion battery using Li4Ti5O12 anode. J Power Sources 222: 442–447. doi: 10.1016/j.jpowsour.2012.09.010
    [21] Illig J, Ender M, Weber A, et al. (2015) Modeling graphite anodes with serial and transmission line models. J Power Sources 282: 335–347. doi: 10.1016/j.jpowsour.2015.02.038
    [22] Hoshi Y, Narita Y, Honda K, et al. (2015) Optimization of reference electrode position in a three-electrode cell for impedance measurements in lithium-ion rechargeable battery by finite element method. J Power Sources 288: 168–175. doi: 10.1016/j.jpowsour.2015.04.065
    [23] Osaka T, Mukoyama D, Nara H (2015) Review—Development of Diagnostic Process for Commercially Available Batteries, Especially Lithium Ion Battery, by Electrochemical Impedance Spectroscopy. J Electrochem Soc 162: A2529–A2537.
    [24] Osaka T, Nara H, Mukoyama D, et al. (2013) New Analysis of Electrochemical Impedance Spectroscopy for Lithium-ion Batteries. J Electrochem Sci Tech 4: 157–162. doi: 10.5229/JECST.2013.4.4.157
    [25] Mendoza-Hernandez OS, Ishikawa H, Nishikawa Y, et al. (2014) State of Charge Dependency of Graphitized-Carbon-Based Reactions in a Lithium-ion Secondary Cell Studied by Electrochemical Impedance Spectroscopy. Electrochimica Acta 131: 168–173. doi: 10.1016/j.electacta.2014.01.057
    [26] Bünzli C, Kaiser H, Novák P (2015) Important Aspects for Reliable Electrochemical Impedance Spectroscopy Measurements of Li-Ion Battery Electrodes. J Electrochem Soc 162: A218–A222.
    [27] Yokoshima T, Nara H, Mukoyama D, et al. (2011) Performance of Fine Reference Electrode in Thin Laminated Li-Ion Cell, in: Meet. Abstr, The Electrochemical Society, pp. 1451–1451.
    [28] Jansen AN, Dees DW, Abraham DP, et al. ((2007)) Low-temperature study of lithium-ion cells using a LiySn micro-reference electrode. J Power Sources 174: 373–379.
    [29] La Mantia F, Wessells CD, Deshazer HD, et al. (2013) Reliable reference electrodes for lithium-ion batteries. Electrochem Commun 31: 141–144.
    [30] Gómez-Cámer JL, Novák P (2013) Electrochemical impedance spectroscopy: Understanding the role of the reference electrode. Electrochem Commun 34: 208–210. doi: 10.1016/j.elecom.2013.06.016
    [31] Adler SB (2002) Reference Electrode Placement in Thin Solid Electrolytes. J Electrochem Soc 149: E166–E172. doi: 10.1149/1.1467368
    [32] Klink S, Höche D, La Mantia F, et al. (2013) FEM modelling of a coaxial three-electrode test cell for electrochemical impedance spectroscopy in lithium ion batteries. J Power Sources 240: 273–280. doi: 10.1016/j.jpowsour.2013.03.186
    [33] Momma T, Yokoshima T, Nara H, et al. (2014) Distinction of impedance responses of Li-ion batteries for individual electrodes using symmetric cells. Electrochimica Acta 131: 195–201. doi: 10.1016/j.electacta.2014.01.091
    [34] Chen CH, Liu J, Amine K (2001) Symmetric cell approach and impedance spectroscopy of high power lithium-ion batteries. J Power Sources 96: 321–328.
    [35] Levi MD, Dargel V, Shilina Y, et al. (2014) Impedance Spectra of Energy-Storage Electrodes Obtained with Commercial Three-Electrode Cells: Some Sources of Measurement Artefacts. Electrochimica Acta 149: 126–135. doi: 10.1016/j.electacta.2014.10.083
    [36] Amatucci G (1996) Cobalt dissolution in LiCoO2-based non-aqueous rechargeable batteries. Solid State Ionics 83: 167–173.
    [37] Levi MD, Salitra G, Markovsky B, et al. (1999) Solid‐State Electrochemical Kinetics of Li‐Ion Intercalation into Li1 − x CoO2: Simultaneous Application of Electroanalytical Techniques SSCV, PITT, and EIS. J Electrochem Soc 146: 1279–1289.
    [38] Momma T, Matsunaga M, Mukoyama D, et al. (2012) Ac impedance analysis of lithium ion battery under temperature control. J Power Sources 216: 304–307. doi: 10.1016/j.jpowsour.2012.05.095
    [39] Nara H, Mukoyama D, Yokoshima T, et al. (2016) Impedance Analysis with Transmission Line Model for Reaction Distribution in a Pouch Type Lithium-Ion Battery by Using Micro Reference Electrode. J Electrochem Soc 163: A434–A441.
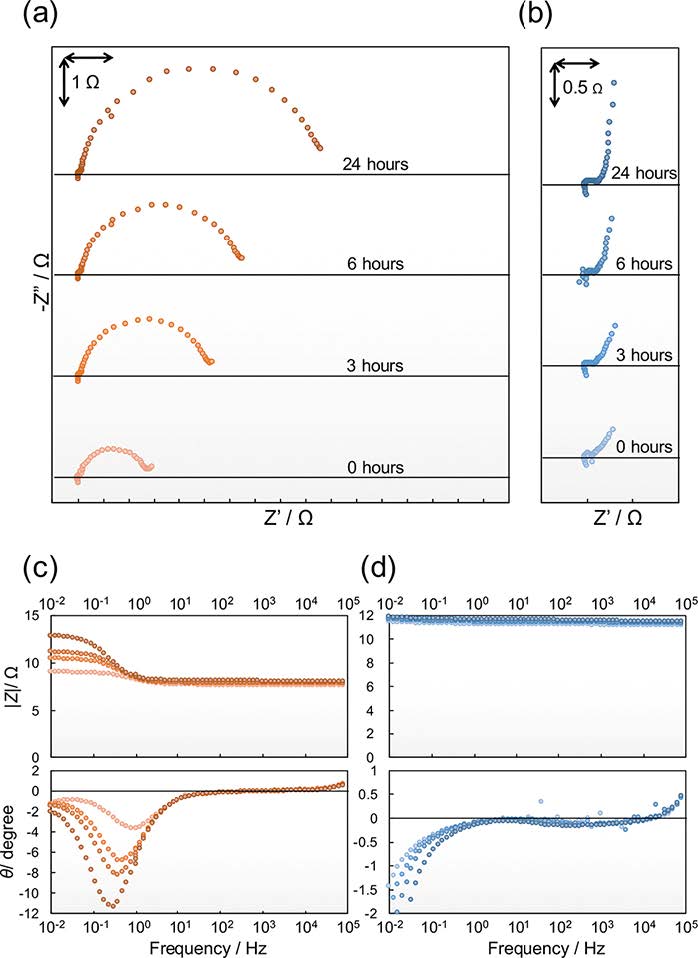
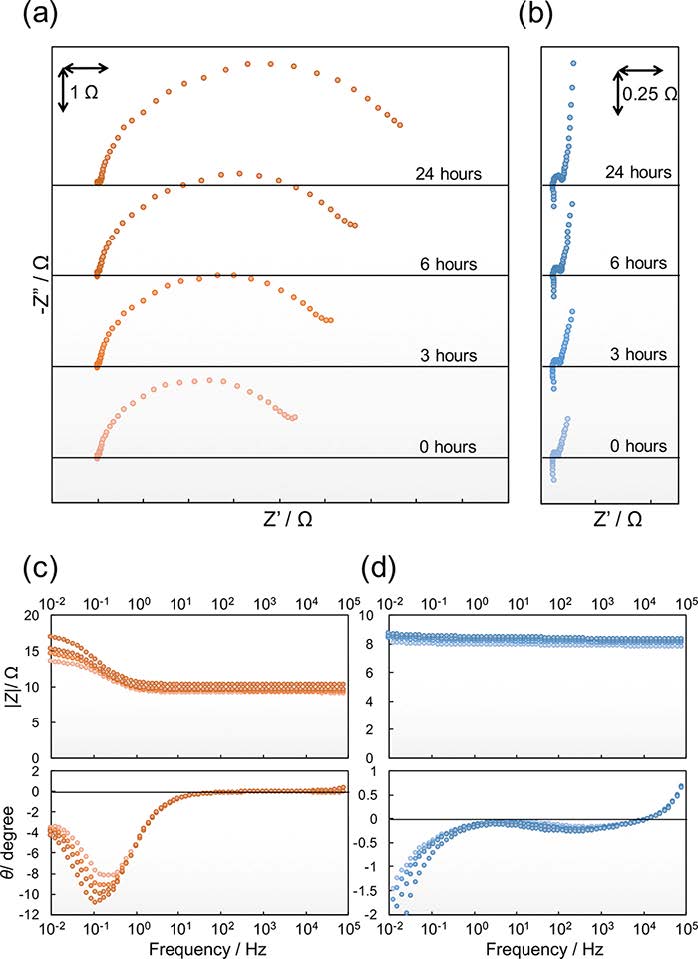
  • This article has been cited by:

    1. Zhong Liu, Shaobin Zhong, Qiang Liu, Chenxi Xie, Yunzhu Dai, Chuan Peng, Xin Chen, Ruhai Zou, Thyroid nodule recognition using a joint convolutional neural network with information fusion of ultrasound images and radiofrequency data, 2021, 0938-7994, 10.1007/s00330-020-07585-z
    2. Wenqiang Luo, Zhiwei Chen, Qi Zhang, Baiying Lei, Zhong Chen, Yuan Fu, Peidong Guo, Changchuan Li, Teng Ma, Jiang Liu, Yue Ding, Osteoporosis Diagnostic Model Using a Multichannel Convolutional Neural Network Based on Quantitative Ultrasound Radiofrequency Signal, 2022, 48, 03015629, 1590, 10.1016/j.ultrasmedbio.2022.04.005
    3. Huiying Wen, Wei Zheng, Min Li, Qing Li, Qiang Liu, Jianhua Zhou, Zhong Liu, Xin Chen, Multiparametric Quantitative US Examination of Liver Fibrosis: A Feature-Engineering and Machine-Learning Based Analysis, 2022, 26, 2168-2194, 715, 10.1109/JBHI.2021.3100319
    4. Zhuhuang Zhou, Ruiyang Gao, Shuicai Wu, Qiying Ding, Guangyu Bin, Po-Hsiang Tsui, Scatterer size estimation for ultrasound tissue characterization: A survey, 2024, 225, 02632241, 114046, 10.1016/j.measurement.2023.114046
    5. Qianfeng Ma, Lifeng Gong, Liyuan Ma, Tao Jiang, Application of ultrasound attenuation imaging and shear wave elastography in the diagnosis of metabolic fatty liver disease, 2024, 40, 0264-8725, 2830, 10.1080/02648725.2023.2202537
    6. Andrew C. Markel, Cameron Hoerig, Allan K.N. de Alencar, Kenneth F. Swan, Alexander D. Gleed, Lili Shi, Gabriella Pridjian, Jonathan Mamou, Carolyn L. Bayer, Quantitative Ultrasound-Based Characterization of Placental Tissue Microstructure in a Rat Model of Preeclampsia, 2025, 03015629, 10.1016/j.ultrasmedbio.2025.04.017
  • Reader Comments
  • © 2016 the Author(s), licensee AIMS Press. This is an open access article distributed under the terms of the Creative Commons Attribution License (http://creativecommons.org/licenses/by/4.0)
通讯作者: 陈斌, bchen63@163.com
  • 1. 

    沈阳化工大学材料科学与工程学院 沈阳 110142

  1. 本站搜索
  2. 百度学术搜索
  3. 万方数据库搜索
  4. CNKI搜索

Metrics

Article views(8639) PDF downloads(1567) Cited by(16)

Article outline

Figures and Tables

Figures(6)

/

DownLoad:  Full-Size Img  PowerPoint
Return
Return

Catalog