


Figure 1.
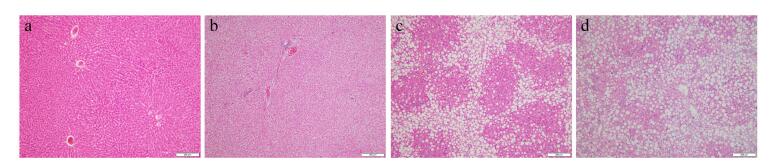
Example sliced images of isolated liver tissue under different steatosis stages: (a), (b), (c), and (d) are for normal liver, mild fatty liver, moderate fatty liver and severe fatty liver, respectively.
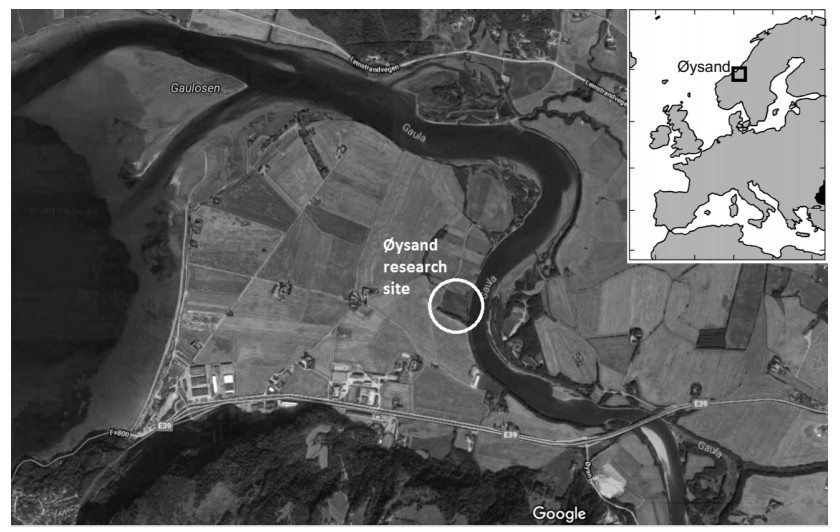
Citation: Santiago Quinteros, Aleksander Gundersen, Jean-Sebastien L'Heureux, J. Antonio H. Carraro, Richard Jardine. Øysand research site: Geotechnical characterisation of deltaic sandy-silty soils[J]. AIMS Geosciences, 2019, 5(4): 750-783. doi: 10.3934/geosci.2019.4.750
| [1] | Marcella Noorman, Richard Allen, Cynthia J. Musante, H. Thomas Banks . Analysis of compartments-in-series models of liver metabolism as partial differential equations: the effect of dispersion and number of compartments. Mathematical Biosciences and Engineering, 2019, 16(3): 1082-1114. doi: 10.3934/mbe.2019052 |
| [2] | Leandro Donisi, Giuseppe Cesarelli, Pietro Balbi, Vincenzo Provitera, Bernardo Lanzillo, Armando Coccia, Giovanni D'Addio . Positive impact of short-term gait rehabilitation in Parkinson patients: a combined approach based on statistics and machine learning. Mathematical Biosciences and Engineering, 2021, 18(5): 6995-7009. doi: 10.3934/mbe.2021348 |
| [3] | Yingjian Yang, Qiang Li, Yingwei Guo, Yang Liu, Xian Li, Jiaqi Guo, Wei Li, Lei Cheng, Huai Chen, Yan Kang . Lung parenchyma parameters measure of rats from pulmonary window computed tomography images based on ResU-Net model for medical respiratory researches. Mathematical Biosciences and Engineering, 2021, 18(4): 4193-4211. doi: 10.3934/mbe.2021210 |
| [4] | Chenkai Chang, Fei Qi, Chang Xu, Yiwei Shen, Qingwu Li . A dual-modal dynamic contour-based method for cervical vascular ultrasound image instance segmentation. Mathematical Biosciences and Engineering, 2024, 21(1): 1038-1057. doi: 10.3934/mbe.2024043 |
| [5] | Zhaoyu Chen, Hongbo Fan, Meiyan Ma, Dangguo Shao . FECFusion: Infrared and visible image fusion network based on fast edge convolution. Mathematical Biosciences and Engineering, 2023, 20(9): 16060-16082. doi: 10.3934/mbe.2023717 |
| [6] | Xiao Zou, Jintao Zhai, Shengyou Qian, Ang Li, Feng Tian, Xiaofei Cao, Runmin Wang . Improved breast ultrasound tumor classification using dual-input CNN with GAP-guided attention loss. Mathematical Biosciences and Engineering, 2023, 20(8): 15244-15264. doi: 10.3934/mbe.2023682 |
| [7] | Virginia Giorno, Serena Spina . On the return process with refractoriness for a non-homogeneous Ornstein-Uhlenbeck neuronal model. Mathematical Biosciences and Engineering, 2014, 11(2): 285-302. doi: 10.3934/mbe.2014.11.285 |
| [8] | Hu Dong, Gang Liu, Xin Tong . Influence of temperature-dependent acoustic and thermal parameters and nonlinear harmonics on the prediction of thermal lesion under HIFU ablation. Mathematical Biosciences and Engineering, 2021, 18(2): 1340-1351. doi: 10.3934/mbe.2021070 |
| [9] | Xiujun Zhang, H. G. Govardhana Reddy, Arcot Usha, M. C. Shanmukha, Mohammad Reza Farahani, Mehdi Alaeiyan . A study on anti-malaria drugs using degree-based topological indices through QSPR analysis. Mathematical Biosciences and Engineering, 2023, 20(2): 3594-3609. doi: 10.3934/mbe.2023167 |
| [10] | Xin Chen, Tengda Li, Will Cao . Optimizing cancer therapy for individuals based on tumor-immune-drug system interaction. Mathematical Biosciences and Engineering, 2023, 20(10): 17589-17607. doi: 10.3934/mbe.2023781 |
Non-alcoholic fatty liver disease (NAFLD) is a multi-system disease that not only causes liver function damage, but also affects other organs [1,2]. For example, patients with NAFLD have a higher mortality rate of liver disease and non-liver disease than ordinary people [3]. Therefore, the accurate assessment of the severity of NAFLD is critical for the prevention, diagnosis and treatment of fatty liver-related diseases. The pathologic definition of NAFLD is that more than 5% of liver hepatocytes have macro steatosis. NAFLD represents a spectrum of diseases ranging from simple steatosis to nonalcoholic steatohepatitis, which can progress to liver fibrosis, cirrhosis, and hepatocellular carcinoma [4].
Even though liver biopsy is considered as the gold standard for NAFLD diagnosis, it has inherent disadvantages such as invasiveness, complications, and being subjective [5,6]. Conventional medical imaging methods for NAFLD diagnosis include computed tomography (CT), magnetic resonance imaging (MRI) and ultrasonography (US) [7,8,9,10]. Among these modalities, US is the most commonly used method for NAFLD diagnosis because it is non-invasive, non-radiative, real-time, and inexpensive. It is suitable for people of all ages, including pregnant women and children, and is not limited by medical history [11]. Conventional ultrasound imaging is a semi-quantitative assessment. Therefore, it is subjective and relies on the experience of the operator [12]. However, quantitative ultrasound (QUS) imaging can provide specific tissue features and increase the specificity of conventional US. It has been widely applied in the liver fat quantification [13,14].
Envelope statistics and spectral-based techniques are two major categories of QUS technique. Both of them have demonstrated success in NAFLD applications, providing additional diagnostic capabilities [13]. The envelope statistics technique utilized the shape and attributes of the envelope of the backscattered ultrasound to estimate the information about the underlying tissue microstructures. Various models and their derivations for the statistics of the envelope, such as the Nakagami model, the Rayleigh model, and the homodyned-K model, have been proposed over the past few decades for the biomedical ultrasound applications [15]. For the NAFLD diagnosis, the Nakagami model is currently the most frequently used one [16,17,18].
Spectral-based techniques include the estimation of attenuation coefficient (AC) and its derivatives, the estimation of backscatter coefficient (BSC) and its derivatives such as the effective scatterer diameter (ESD) and the effective acoustic concentration (EAC) of scatterers. These techniques utilize the amplitude, frequency and phase information in the ultrasonic RF signal and also have the ability to observe tissue microstructures. Paige et al. explored the diagnostic performance of AC and BSC for predicting histology-confirmed steatosis grade in NAFLD patients. Their results suggested that QUS parameters may be more accurate and provide higher interobserver agreement than CUS [19]. Yang et al. used the integral backscatter coefficient to evaluate the liver fat concentration after liver transplantation, and observed that the integrated backscatter coefficient (IBC) has a good correlation with liver fat concentration [17]. Lin et al. investigated the QUS measurements of BSC identify steatosis in animal models and found that BSC can accurately diagnose and quantify hepatic steatosis [21]. Ghoshal et al. studied ESD and EAC and the results indicated that the two parameters are sensitive to fat content in the liver [22].
The primary purpose of this study is to combine multiple QUS parameters using an efficient fusion method to obtain an optimal characteristic parameter. We identified six commonly used QUS parameters to measure different liver fat concentrations, and selected several parameters with better staging effects for combination. The diagnosis performance of the combined parameter was evaluated and compared with that of the single QUS parameter. To the best of our knowledge, this is the first study to combine multiple QUS parameters for evaluating liver steatosis grade.
The NAFLD rat model was supplied by the Guangdong Experimental Animal Center. The animal experiment obtained the review of the Experimental Animal Ethics Committee of Shenzhen University. The experimental rat weighed between 180 and 200 g. The culture environment of the experimental rat model was sterile and constant, the temperature and humidity of culture environment were maintained at 20−60∘ and 40−70%, respectively. A total of 65 rats were involved in the study. The rats were randomly divided into the control group (8 rats) and the fatty liver group (57 rats). The rats in the control group were fed with a standard diet with sterilized food and water, while for those in the fatty liver group a high fat emulsion (20% lard, 10% cholesterol, 20% sodiumcholate, 0.5% propylthiouracil, and 30% fructose) was given once a day at 1 mL/100 g rat weight, for different numbers of days to induce different severity stages of steatosis. After 2, 4, 6, and 8 weeks, the rats were humanely killed for analysis. Specifically, the right lateral lobe of the liver was used for QUS measurements, while the rest lobes were for histologic assessment. It should be noted that the steatosis grade was ultimately determined by the histologic assessment, rather than the length of feeding time of the rats. Moreover, all procedures conducted in our study had been approved by the Animal Care Committee of Shenzhen University and the Guangdong Medical Laboratory Animal Center.
Excised liver tissues were fixed in 10% formalin solution for at least 24 h. After washing and dehydrating, samples were embedded in paraffin and sliced to a thickness of 7 μm. The paraffin slices were stained with hematoxylin-eosin (HE) by histopathology technicians, and analyzed using a microscope (BX41, Olympus, Pittsburgh, PA) by an expert pathologist. According to the percentage of hepatocytes containing macrovesicular fat droplets, the severity grades for steatosis were defined as follows [23]: S0<5%, S1=5%−33%, S2=33−66%, and S3≥67%. For an illustration, example sliced images for liver tissue sections with different steatosis stages are shown in Figure 1, where (a), (b), (c), and (d) represent normal liver, mild fatty liver, moderate fatty liver and severe fatty liver, respectively. It can be seen that hepatocytes containing macrovesicular fat droplets are increasing from (a) to (d) in the figure. The percent of hepatocytes containing macrovesicular fat droplets serves as the quantitative measurement for the determination of steatosis stage.
In an ex vivo experiment, the right liver lobe was processed and embedded in a fabricated gelatin phantom (gelatin from porcine skin, G2500, Sigma-Aldrich, St. Louis, MO, USA) in a container (11×11×7 cm). The objective for such design was to simulate the tissues that lie between the ultrasound probe and liver in vivo. A modified ultrasound scanner (M5, Mindray, Guangdong, China) with a linear array probe (7L4S) was used to capture the RF data. The center frequency of the probe is 7.5 MHz and the sampling frequency is 30 MHz. Each rat liver tissue phantom was scanned ten times and the ultrasound images and the corresponding RF data were stored for offline processing.
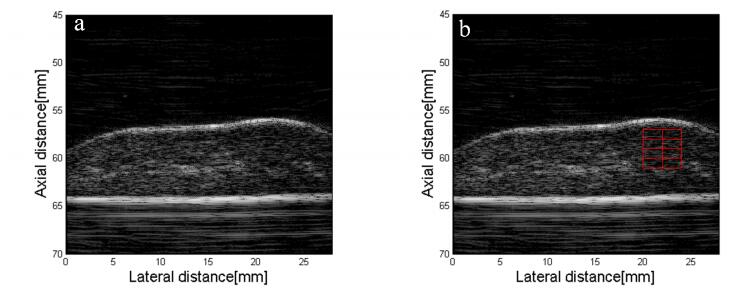
The ultrasound image was reconstructed from the corresponding RF data. Then the region of interest (ROI) is selected in the reconstructed image as shown in Figure 2. Six different QUS parameters were calculated based on the ROI which was divided into several sub-ROIs according to different algorithms. Here we just briefly introduce their definitions.
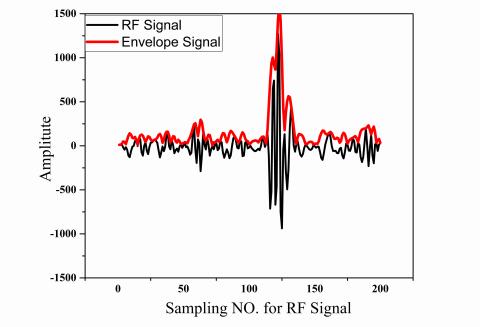
We used the Nakagami statistical model to analyze the envelope and estimate the shape parameter m and the scaling parameter U [24]. The envelope of the RF signal was calculated by the Hilbert transform. The typical relationship between the RF signal and envelope waveform is shown in Figure 3. The probability density function (pdf) of the envelope signal x, which can be approximated as a Nakagami model with two parameters (m,U) as follows:
| f(x)=2mmτ(m)umx2m−1exp(−mux2), | (2.1) |
where τ(⋅) is the gamma function, the parameters m and U are represented as:
| △=ln(E(∑i=Ni=1x2i))−1N∑i=Ni=1ln(x2i), | (2.2) |
| mMLE={0.5001+0.1649△−0.0544△2△,if 0<△<0.5772,8.8989+9.0600△+0.9755△2△(17.7973+11.9685△+△2),if 0.5772<△<17, | (2.3) |
| U=log(E(x2)). | (2.4) |
The attenuation coefficient slope as a function of frequency is expressed in dB/MHz/cm and is obtained by the following equation [25]:
| ln(S(f,Z1))−ln(S(f,Z2))4d+βrf=βsf, | (2.5) |
where S(f,Z1) denotes the power spectrum at depth Z1, S(f,Z2) denotes the power spectrum at depth Z2, f is the frequency, d denotes the distance between Z1 and Z2, d=Z2−Z1, Z1 and Z2 are the distance from the probe to the ROI (in cm). βr and βs denote ACS of reference phantom and tissue (dB/MHz/cm), respectively. We also normalized the power spectrum by dividing the measured power spectrum by the standard power spectrum, which is denoted as
| S(f,Z)=Ss(f,Z)Sr(f,Z), | (2.6) |
where Ss(f,Z) denotes the measured power spectrum, Sr(f,Z) denotes the reference power spectrum, Z is depth.
The integrate Backscatter coefficient, expressed in dB, is estimated using [22]:
| IBC=1fmin−fmax∫fmaxfminBSC(f)df, | (2.7) |
where BSC(f) is the ultrasonic backscatter coefficient, which is estimated in accordance with the method described by [26]:
| BSC=10log10[Ss(f,Z)Sr(f,Z)exp(4βrZ)10.632R2pk2a28Ωl[1+(ka24F)2]], | (2.8) |
where Rp is the reflection coefficient from the plane reflector (assumed to be one), k is the wave vector, a is the transducer radius, F is the transducer focal distance, l is the thickness of segmentation window.
From a microscopic point of view, the backscattered theoretical power spectrum can also be expressed as [27]:
| Wthero(f)=185lq2a6efff4pz2var1+2.66(fqaeff)2e−(3.487faeff)2, | (2.9) |
where f is the frequency (MHz), aeff denote the effective scatterer diameter (ESD) (mm), p is the scatterer concentration (mm−3), zvar=z−z0z0 is relative acoustic impedance of the scatterer and its surrounding medium, pz2var denote the effective acoustic concentration (EAC), l is the window length (mm), q is the transducer aperture.
The power spectrum is linearly fitted in the bandwidth by the least squares fitting method based on frequency f. The spectral slope and the intermediate frequency amplitude are ms and M, respectively. The effective scatter diameter (ESD) and effective acoustic concentration (EAC) are obtained by the following equation, respectively:
| ESD=√g3(fc,b)n−msg4(fc), | (2.10) |
| EAC=exp(M−4.34lnE−g1(fc,b)n−g2(fc)a2eff4.34)a2(n−1)eff, | (2.11) |
where g1, g2, g3, g4 are constants, b is the fractional bandwidth, E is a constant related to the aperture and focal length, and n is set as 4 for the biological tissue are isotropic scatterers.
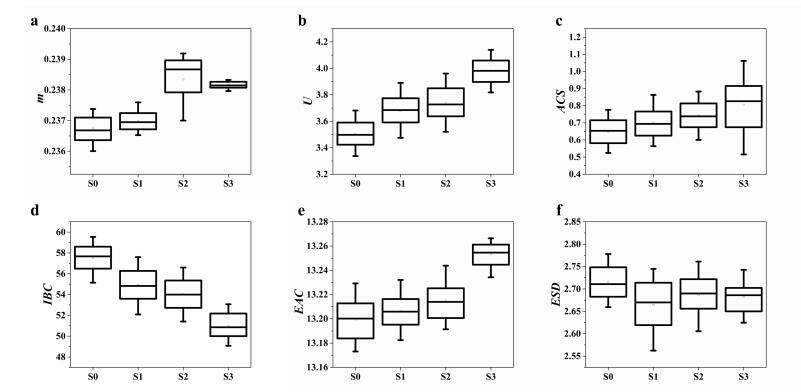
To select the appropriate parameters for predicting NAFLD, a univariate analysis was performed on the parameters mentioned above. Four parameters (m, U, IBC, EAC) showed as the most significant predictors for the NAFLD stage. These four parameters were then used for construct a combination model. An optimal linear combination of the four parameters was used to improve the prediction of mild steatosis (stage ≥ S1). The method proposed by [28,29] was used to determine the optimal linear combination which has the greatest AUROC out of all the possible linear combinations. The combination coefficients and corresponding cut-off values were calculated. Comparisons of the performances between the single parameters and their linear combination were performed.
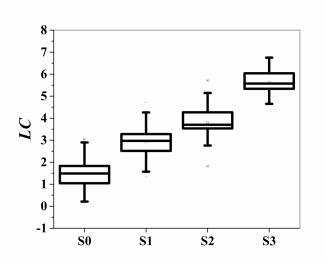
The box plots of the six QUS parameters for different NAFLD stages are shown in Figure 4. In this figure we can clearly observe that the parameter m, U, IBC, EAC are well correlated with the NAFLD stages. The formula of the optimal linear combination was
| LC=5×U+m−1.8×IBC+0.3×EAC. | (3.1) |
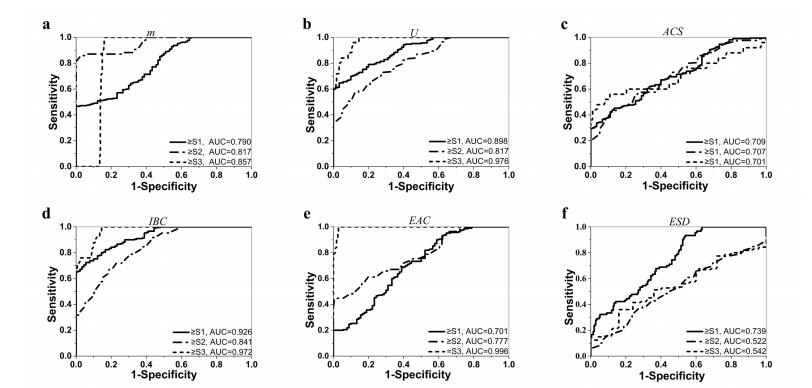
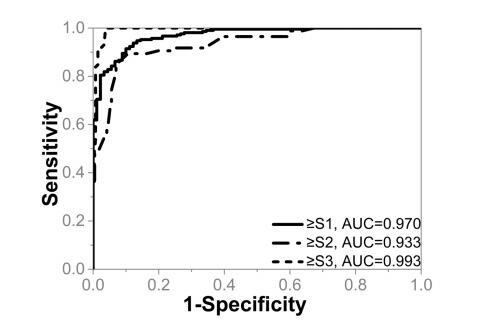
As mentioned earlier, the coefficients in the equation were determined by using the method reported in [28,29], which explores the information carried by the marker values in different testing groups and employs the Fisher's linear discriminant function for the optimization. The resultant linear combination provided us the maximum value of AUROC for better steatosis assessment. The box plot of the combined parameter for different NAFLD stages is shown in Figure 5. The performance of the combined parameter was analyzed and compared with those of the single parameter. The ROC curves of the six QUS parameters and the combined parameters for differentiating NAFLD stages are shown in Figures 6 and 7, respectively. The performance of different parameters are listed in Table 1.
| Parameters | m | U | IBC | EAC | Combination | |
| AUC | 0.790 | 0.898 | 0.926 | 0.701 | 0.970 | |
| stage ≥ S1 | ACC | 0.726 | 0.804 | 0.825 | 0.655 | 0.901 |
| Sen | 0.467 | 0.647 | 0.724 | 0.933 | 0.938 | |
| Spe | 1.0 | 0.966 | 0.945 | 0.378 | 0.877 | |
| AUC | 0.953 | 0.817 | 0.841 | 0.777 | 0.933 | |
| stage ≥ S2 | ACC | 0.916 | 0.718 | 0.703 | 0.720 | 0.894 |
| Sen | 0.835 | 0.576 | 0.718 | 0.447 | 0.894 | |
| Spe | 0.835 | 0.880 | 0.772 | 0.861 | 0.897 | |
| AUC | 0.857 | 0.976 | 0.972 | 0.996 | 0.933 | |
| stage = S3 | ACC | 0.814 | 0.936 | 0.932 | 0.967 | 0.976 |
| Sen | 1.0 | 1.0 | 1.0 | 1.0 | 1.0 | |
| Spe | 0.84 | 0.854 | 0.855 | 0.971 | 0.963 |
 DownLoad:
CSV
DownLoad:
CSV
Liver fatty deposits not only cause damage to liver tissue, but also cause lesions in other tissues. Studies have shown that NAFLD is more than just a liver disease, it is can also agammaavate the incidence of diabetes and cardiovascular diseases [30]. Moreover, quantitative assessment of donor hepatic steatosis is critical in liver transplantation for the success of surgery [31,32]. Therefore, it is of great clinical importance to accurately assess of the severity of NAFLD.
Various QUS parameters have been developed in previous studies for the NAFLD diagnosis. These parameters can assess the hepatic fat quantification from different aspects. How to combine these parameters for improving the diagnosis performance is still challenging. A recent study explored a multiparametric approach by combining QUS parameters to test the discriminate performance between the stages of liver fibrosis [33]. Linear discriminant analysis was used in that study for combining multiple parameters. This study applied a different combination method which is based on the criteria of maximizing the AUROC. The AUROC is used extensively in research to express discriminating power and diagnostic performance. Therefore, the combination method used in this study has unique advantage. It has the greatest AUROC out of all the possible linear combinations, ensuring that the performance of the combination is better than that of any individual method.
As shown Table 1, the four QUS parameters have different performances in distinguishing different steatosis stages. For distinguishing ≥ S1, ≥ S2, and =S3, IBC, m, EAC have the greatest AUROCs, respectively. Therefore, there is no one single parameter that is completely better than other parameters. The combination method can extract complementary information from different parameters compensate for the lack of a single characteristic parameter. It can be observed that the combination parameter has the highest AUROC than those of any single parameter for distinguishing ≥ S1. For other stages, although the combination parameter cannot achieve the highest AUROC compared with single parameter, it can improve the overall performance.
One limitation of our study comes from the animal model. The effectiveness of the proposed method was demonstrated using the NAFLD rat model. Its performance on human subjects need to be further tested through extra experiments. It would have been ideal to recruit clinical patients who have only varying levels of steatosis severity. However, this was a challenging task because steatosis, inflammation and fibrosis may precede or develop in parallel with the liver disease. Animal models of the spectrum of NAFLD provide the necessary tools to overcome confounding variables, such as genetic heterogeneity, and environmental factors, including diet and lifestyle. Given the difficulty of studying all the factors involved in steatosis in human populations, the animal model may have helped to improve our understanding of the physiopathology of the disease. Another limitation of the study is that ultrasonography was examined in ex vivo samples. In our study, we conducted ex-vivo liver experiments in order to isolate the liver fat factor from the confounding environment experienced in vivo experiments, so that the problem for NALFD can be examined independently. For the assessment of in vivo livers, other factors such as heart beat and blood flow must be considered as well. It could be recognized that the examination of the individual fat factor in ex-vivo livers can provide useful reference information for relevant studies in the in vivo experiments, as the QUS technique explores the microstructures of livers, the changes of which from in vivo to ex vivo are limited. In our future work, we shall deliver more efforts to extent the proposed technique to assess in vivo livers in rats and humans by taking the confounding environment into account. In addition, our work did not include comparisons between quantitative US or their combined parameters and the standard ultrasound techniques utilized clinically. Adding relevant comparisons may provide more comprehensive interpretation of the results. Moreover, it should be noted that quantification of liver fat based on the US technique is one way to assess liver disease in NAFLD. However, liver inflammation cannot be measured with US. Fibrosis is the strongest and most relevant indicator of disease progression and can be more accurately quantified via biopsy and elastography [34].
We have proposed a multiparametric approach to explore the QUS parameters to differentiate between different steatosis stages. The findings show that this approach can make up for the deficiency of single parameter and improve the quantitative staging ability of fatty liver, and thus could play an important role in the diagnosis of NAFLD.
This work was supported by the National Natural Science Foundation of China (Grant Nos. 81871429 and 61427806), the Science and Technology Planning Project of Guangdong Province (No. 2017A020215099) and Shenzhen Science and Technology Planning Project (Grant No. JCYJ20160520175319943). We would like to thank the anonymous reviewers for their constructive comments and valuable suggestions.
The authors declare that there is no conflict of interests regarding the publication of this article.
| [1] | L'Heureux JS, Lunne T, Lacasse S, et al. (2017) Norway's National GeoTest Site Research Infrastructure (NGTS). In Proceedings of the 19th International Conference on Soil Mechanics and Geotechnical Engineering. Seoul. |
| [2] |
Blaker Ø, Carroll R, Paniagua P, et al. (2019) Halden research site: geotechnical characterization of a post glacial silt. AIMS Geosci 5: 184-234. doi: 10.3934/geosci.2019.2.184

|
| [3] |
Gundersen AS, Hansen RC, Lunne T, et al. (2019) Characterization and engineering properties of the NGTS Onsøy soft clay site. AIMS Geosci 5: 665-703. doi: 10.3934/geosci.2019.3.665
|
| [4] | L'Heureux JS, Lindgård A, Emdal A (2019) The Tiller-Flotten research site: Geotechnical characterization of a very sensitive clay deposit. AIMS Geosci 5 [In press]. |
| [5] | Gilbert GL, Instanes A, Sinitsyn AO, et al. (2019) Characterization of the NGTS permafrost sites: Longyearbyen, Svalbard. AIMS Geosci 5 [In press]. |
| [6] | Salgado R (2008) The engineering of foundations. McGraw-Hill New York. |
| [7] | Gundersen AS, Carotenuto P, Lunne T, et al. (2019) Measurements of hydraulic soil properties at NGTS sand site using a newly-developed in-situ tool. AIMS Geosci 5 [In press]. |
| [8] | Reite AJ (1994) Weischelian and Holocene geology of Sør-Trøndelag and adjacent parts of Nord-Trøndelag county, Central Norway. Norges Geol undersøkelse-Bulletin, 1-30. |
| [9] | Reite AJ, Sveian H, Erichsen E (1999) Trondheim fra istid til nåtid-landskapshistorie og løsmasser. Norges Geol undersøkelse Gråsteinen 5: 40. |
| [10] | Wolff FC (1979) Beskrivelse til de berggrunnsgeologiske kart Trond-heim og Østersund 1:250,000. Norges Geol undersøkelse 353: 76. |
| [11] | Gundersen AS, Quinteros S, L'Heureux JS, et al. (2018) Soil classification of NGTS sand site (Øysand, Norway) based on CPTU, DMT and laboratory results. In 4th International Symposium on Cone Penetration Testing. CPT18, 323-328. |
| [12] | Cosentini RM, Della VecchiaA G, Foti S, et al. (2012) Estimation of the hydraulic parameters of unsaturated samples by electrical resistivity tomography. Géotechnique 62: 583-594. |
| [13] | Lunne T, Robertson PK, Powell JJM (1997) Cone Penetration Testing in Geotechnical Practice. New York. |
| [14] | ASTM (2017) D2487-17 Standard Practice for Classification of Soils for Engineering Purposes (Unified Soil Classification System). |
| [15] | Powers MC (1953) A new roundness scale for sedimentary particles. J Sediment Petrol 23: 117-119. |
| [16] | NS 8012 (1982) Geoteknisk prøving. Laboratoriemetoder. Korndensitet. Standard Norge, Lysaker. |
| [17] | Lunne T, Knudsen S, Blaker Ø, et al. (2019) Methods used to determine maximum and minimum dry unit weight of sand. Is there a need for a new standard? Can Geotech J 56: 536-553. |
| [18] | Jamiolkowski M, Lo Presti DCF, Manassero M (2003) Evaluation of relative density and shear strength of sands from CPT and DMT. In Germaine JT, Sheahan TC, Whitman RV (eds), Soil behavior and soft ground construction, ASCE GSP, 201-238. |
| [19] | NGF (2018) Guidelines for performing total sounding tests (In Norwegian: Veiledning for utførelse av totalsondering). Norwegian Geotechnical Society, Norway. |
| [20] | ISO 22476-1 (2012) Geotechnical investigation and testing-Field testing-Part 1: Electrical cone and piezocone penetration test. |
| [21] | ISO 22476-11 (2017) Geotechnical investigation and testing-Field testing-Part 11: Flat dilatometer test |
| [22] | Marchetti S (1980) In situ tests by flat dilatometer. J Geotech Geoenviron Eng 106: 299-321. |
| [23] | Kuwano R, Jardine RJ (2002) On the applicability of cross-anisotropic elasticity to granular materials at very small strains. Géotechnique 52: 727-750. |
| [24] | Jardine RJ (2013) Advanced laboratory testing in research and practice. 2nd Bishop Lecture. Proc. ICSMGE. Presses des Ponts, Paris, 1: 35-55. |
| [25] |
Demir Z, Narasimhan TN (1994) Improved Interpretation of Hvorslev Tests. J Hydraul Eng 120: 477-494. doi: 10.1061/(ASCE)0733-9429(1994)120:4(477)
|
| [26] | Hazen A (1911) Discussion of Dams on sand foundations. Trans Am Soc Civ Eng 73: 199-203. |
| [27] | Robertson PK, Cabal KL (2015) Guide to Cone Penetration Testing for Geotechnical Engineering, 6th Editio. Gregg Drilling & Testing Inc., California. |
| [28] | Mayne PW (2009) Geoengineering Design Using the Cone Penetration Test. ConeTec Inc., Richmond, BC, Canada. |
| [29] | Schmertmann JH (1983) Revised procedure for calculating Ko and OCR from DMT's with Id > 1.2 and which incorporates the penetration force measurement to permit calculating the plane strain friction angle. In Proc. of the 1st Int. Conf. on the Flat Dilatometer. Gainesville, FL. |
| [30] | Marchetti S (1985) On the field determination of Ko in sand. In 11th Int. Conf. on Soil Mech. and Found. Eng. Panel Presentation, Balkema Pub., Rotterdam, 5: 2667-2672. |
| [31] | Mayne P, Coop MR, Springman S, et al. (2009) Geomaterial behavior and testing. In Proc. 17th International Conference on Soil Mechanics and Geotechnical Engineering. Alexandria, Egypt, 4: 1-96. |
| [32] |
Monaco P, Amoroso S, Marchetti S, et al. (2014) Overconsolidation and Stiffness of Venice Lagoon Sands and Silts from SDMT and CPTU. J Geotech Geoenviron Eng 140: 215-227. doi: 10.1061/(ASCE)GT.1943-5606.0000965
|
| [33] | Marchetti S, Monaco P, Totani G, et al. (2001) The Flat Dilatometer Test (DMT) in Soil Investigations. International Conference on Insitu Measurement of Soil Properties and Case Histories (Insitu 2001). Parahyangan Catholic University, 95-131. |
| [34] | Jaky J (1944) The coefficient of earth pressure at rest. In Hungarian (A nyugalmi nyomas tenyezoje). J Soc Hung Eng Arch (MagyarMernok es Epit Kozlonye), 355-358. |
| [35] | Jaky J (1948) Pressure in silos. In: Proc. 2nd Int. Conf. on SoilMechanics and Foundation Engineering. Rotterdam, The Netherland, 1: 103-110. |
| [36] | Mayne P, Kulhawy FH (1982) Ko-OCR relationships in soil. J Soil Mecha Found Div 108: 851-872. |
| [37] | Lee J, Park D, Kyung D, et al. (2003) Effect of particle characteristics on Ko behaviour of granular materials. In Proceedings of the 18th International Conference on Soil Mechanics and Geotechnical Engineering, Paris, 337-380. |
| [38] | Baldi G (1986) Interpretation of CPTs and CPTUs, 2nd part: drained penetration of sands. In Proceedings of the Fourth International Geotechnical Seminar. Singapore, 143-156. |
| [39] | Mayne PW (2014) KN2: Interpretation of geotechnical parameters from seismic piezocone tests. In: Robertson PK, Cabal KL (eds), Proceedings, 3rd International Symposium on Cone Penetration Testing (CPT'14, Las Vegas), ISSMGE Technical Committee TC 102, 47-73. |
| [40] | Marchetti S (1997) The Flat Dilatometer: Design Applications. In Third Geotechnical Engineering Conference Cairo University. Cairo, 421-448. |
| [41] | Uzielli M, Mayne PW, Cassidy M, et al. (2013) Probabilistic assignment of design strength for sands from in-situ testing data. In Advances in Soil Mechanics & Geotechnical Engineering (series), IOS-Millpress, Amsterdam, 1: 214-227. |
| [42] | NGI (2018) Impact of cone penetrometer type on CPTU results at 4 NGTS Sites. Silt, Soft Clay, Sand, and Quick Clay. Report No. 20160154-21-R. Oslo, Norway. |
| [43] |
Jin HW, Lee J, Ryu BH, et al. (2019) Simple frost heave testing method using a temperature-controllable cell. Cold Reg Sci Technol 157: 119-132. doi: 10.1016/j.coldregions.2018.09.011
|
| 1. | Zhong Liu, Shaobin Zhong, Qiang Liu, Chenxi Xie, Yunzhu Dai, Chuan Peng, Xin Chen, Ruhai Zou, Thyroid nodule recognition using a joint convolutional neural network with information fusion of ultrasound images and radiofrequency data, 2021, 0938-7994, 10.1007/s00330-020-07585-z | |
| 2. | Wenqiang Luo, Zhiwei Chen, Qi Zhang, Baiying Lei, Zhong Chen, Yuan Fu, Peidong Guo, Changchuan Li, Teng Ma, Jiang Liu, Yue Ding, Osteoporosis Diagnostic Model Using a Multichannel Convolutional Neural Network Based on Quantitative Ultrasound Radiofrequency Signal, 2022, 48, 03015629, 1590, 10.1016/j.ultrasmedbio.2022.04.005 | |
| 3. | Huiying Wen, Wei Zheng, Min Li, Qing Li, Qiang Liu, Jianhua Zhou, Zhong Liu, Xin Chen, Multiparametric Quantitative US Examination of Liver Fibrosis: A Feature-Engineering and Machine-Learning Based Analysis, 2022, 26, 2168-2194, 715, 10.1109/JBHI.2021.3100319 | |
| 4. | Zhuhuang Zhou, Ruiyang Gao, Shuicai Wu, Qiying Ding, Guangyu Bin, Po-Hsiang Tsui, Scatterer size estimation for ultrasound tissue characterization: A survey, 2024, 225, 02632241, 114046, 10.1016/j.measurement.2023.114046 | |
| 5. | Qianfeng Ma, Lifeng Gong, Liyuan Ma, Tao Jiang, Application of ultrasound attenuation imaging and shear wave elastography in the diagnosis of metabolic fatty liver disease, 2024, 40, 0264-8725, 2830, 10.1080/02648725.2023.2202537 | |
| 6. | Andrew C. Markel, Cameron Hoerig, Allan K.N. de Alencar, Kenneth F. Swan, Alexander D. Gleed, Lili Shi, Gabriella Pridjian, Jonathan Mamou, Carolyn L. Bayer, Quantitative Ultrasound-Based Characterization of Placental Tissue Microstructure in a Rat Model of Preeclampsia, 2025, 03015629, 10.1016/j.ultrasmedbio.2025.04.017 |
Figures(28) / Tables(3)

Santiago Quinteros, Aleksander Gundersen, Jean-Sebastien L'Heureux, J. Antonio H. Carraro, Richard Jardine. Øysand research site: Geotechnical characterisation of deltaic sandy-silty soils[J]. AIMS Geosciences, 2019, 5(4): 750-783. doi: 10.3934/geosci.2019.4.750

| Parameters | m | U | IBC | EAC | Combination | |
| AUC | 0.790 | 0.898 | 0.926 | 0.701 | 0.970 | |
| stage ≥ S1 | ACC | 0.726 | 0.804 | 0.825 | 0.655 | 0.901 |
| Sen | 0.467 | 0.647 | 0.724 | 0.933 | 0.938 | |
| Spe | 1.0 | 0.966 | 0.945 | 0.378 | 0.877 | |
| AUC | 0.953 | 0.817 | 0.841 | 0.777 | 0.933 | |
| stage ≥ S2 | ACC | 0.916 | 0.718 | 0.703 | 0.720 | 0.894 |
| Sen | 0.835 | 0.576 | 0.718 | 0.447 | 0.894 | |
| Spe | 0.835 | 0.880 | 0.772 | 0.861 | 0.897 | |
| AUC | 0.857 | 0.976 | 0.972 | 0.996 | 0.933 | |
| stage = S3 | ACC | 0.814 | 0.936 | 0.932 | 0.967 | 0.976 |
| Sen | 1.0 | 1.0 | 1.0 | 1.0 | 1.0 | |
| Spe | 0.84 | 0.854 | 0.855 | 0.971 | 0.963 |
DownLoad:
CSV
| Parameters | m | U | IBC | EAC | Combination | |
| AUC | 0.790 | 0.898 | 0.926 | 0.701 | 0.970 | |
| stage ≥ S1 | ACC | 0.726 | 0.804 | 0.825 | 0.655 | 0.901 |
| Sen | 0.467 | 0.647 | 0.724 | 0.933 | 0.938 | |
| Spe | 1.0 | 0.966 | 0.945 | 0.378 | 0.877 | |
| AUC | 0.953 | 0.817 | 0.841 | 0.777 | 0.933 | |
| stage ≥ S2 | ACC | 0.916 | 0.718 | 0.703 | 0.720 | 0.894 |
| Sen | 0.835 | 0.576 | 0.718 | 0.447 | 0.894 | |
| Spe | 0.835 | 0.880 | 0.772 | 0.861 | 0.897 | |
| AUC | 0.857 | 0.976 | 0.972 | 0.996 | 0.933 | |
| stage = S3 | ACC | 0.814 | 0.936 | 0.932 | 0.967 | 0.976 |
| Sen | 1.0 | 1.0 | 1.0 | 1.0 | 1.0 | |
| Spe | 0.84 | 0.854 | 0.855 | 0.971 | 0.963 |
