1.
Introduction
The information about motifs provides significant knowledge about evolutionary processes and the complexities of different organisms simultaneously. Biologists believe that some special proteins called Transcription Factors (TFs) bind to some patterns of the DNA substrings called Transcription Factor Binding Sites (TFBSs). Then, the process of gene expression initiates [1]. During this process, genes are transcribed into RNA and get activated or deactivated. These regulatory sites in DNA strings correspond to some conservative sequence patterns which are called motifs. The regulatory sites or TFBSs are called occurrences. Finding these regulatory sites or TFBSs seems to be difficult; however, discovering them helps molecular biologists to investigate the interaction between DNA and proteins, gene regulation, cell development, and cell reaction under physiological and pathological conditions. Occurrences have a fixed length, but they have slightly different compositions from their own motif.
This problem is one of the well-known problems in molecular biology and since it has been proven to be NP-hard [2], various methods and algorithms have been proposed to solve it. There are two classes of procedures for finding motifs: Pattern driven and sample driven approaches. In pattern driven procedures, the methods search on all |Σ|l candidate motifs. In sample-driven approaches patterns related to the given instance are only explored [3]. Methods to solve MDP can also be classified into two main groups: exact and approximate methods. The exact methods are very time consuming while approximate methods give a good result(s) in a reasonable time. Thus, they have attracted more attention from research communities. Heuristic procedures (as approximate procedures) have been widely used in the literature since they are fast and give a reasonable answer(s) [4]. Numerous existing algorithms identify motifs with a given length, but they are either not applicable or not efficient when searching motifs with different lengths. Finding motifs with and without gapped in the given sequences is the goal of many algorithms. Locating gapped motifs is a time-consuming task due to using combinatorial approaches [5]. Our proposed procedure is for a fixed-length motif without gap, and we don't study extensible-length motifs here.
To find real biological motifs, several assumptions which are close to the nature of the motif have been considered. Kaya [6] has listed some of these assumptions:
1. Each DNA sequence has an occurrence.
2. Each DNA sequence does not have an occurrence. This is more close to the definition of the motif in nature.
3. Sequences in the dataset have more than one occurrence.
4. There is more than one motif for sequences.
For each of these assumptions, a suitable algorithm has been proposed, but we are looking for an algorithm that behaves more similar to the nature of the motif, indeed. In fact, a composition of these assumptions can help us to find a reasonable answer(s). In the literature, the proposed procedures for solving MDP have been classified into two main groups: Statistical techniques and string-based methods [7]. Some significant statistical algorithms are the expectation maximization (EM) algorithm [8] and Gibbs Sampling [9] proposed by Lawrence and Raly which use a greedy approach. These algorithms use elaborated statistical techniques for finding motifs. MEME (Multiple EM for Motif Elicitation) is an extended EM algorithm for discovering motifs in unaligned biopolymer sequences [10]. AlignAce (Aligns Nucleic Acid Conserved Elements) finds occurrences in a set of DNA sequences [11]. This algorithm tries to find profile motif. An important assumption taken into account by this procedure is that the motif model is one that is most different from the background motif model. Thus, they try to maximize the likelihood ratio of the motif model to the background model or the information entropy of the motif model in order to find the answer. In fact, log likelihood and information content are two scoring functions which are used for profile motif models. In MotifHyades, a novel probabilistic model was proposed and with two derived optimization algorithms attempted to find paired motifs in DNA sequences in human cell lines [12]. In [13], the k-spectrum modeling was used to catch DNA motif patterns from protein sequences. In the algorithm, multiple evaluation metrics gathered on millions of k-mer binding intensities from 92 proteins across 5 DNA-binding families.
The second class of algorithms is string-based ones. This kind of algorithms directly tries to find a motif through a substring that starts from zero to l. In fact, a tree of depth l is constructed where a node at depth k represents a k-length prefix of the motif. Some of the algorithms in this category are SPELLER [3], Weeder [14], MITRA [15], CENSUS [16], GENMOTIF [17], and RISOTTO [18]. Swarm intelligence algorithms are created based on natural phenomena. Genetic, Firefly, artificial bee colony and gravitation search algorithms are among the metaheuristic algorithms which are inspired by nature. Swarm intelligence deals with a system consisting of a group of individuals who move independently, but the group stays together and gradually converges to the optimal solution(s). These algorithms are iterative methods in which a single answer tries to improve itself during a period. Most of the metaheuristic algorithms in MDP use a single objective function, for example, MEME, MITRA, Weeder, and Consensus [19]. Kaya proposed MOGAMOD [6] considering three objective functions and demonstrated that considering the problem of MDP as a multi-objective optimization problem gives better motifs than the single objective ones. In fact, MOGAMOD attempts to optimize the length, support, and similarity of the motif simultaneously. These functions are in conflict with each other. Thus finding a solution that optimizes all these objectives at the same time is practically impossible and bounds to use the Pareto optimality notion. It is shown that the Multi-objective Artificial Bee Colony (MOABC) algorithm obtained the best results for a group of datasets among different approaches in the literature [20]. Similar to MOGAMOD, MOABC uses three objectives to find motifs. The authors of this paper also proposed a parallel version of this algorithm for protein strings [21]. Like all multi-objective optimization problems, it finds multiple answers at the end. In fact, this characteristic makes multi-objective algorithms superior to single objective ones. In this paper, we propose a multi-objective imperialist competition algorithm (MOICA) for MDP considering the three above mentioned objectives. Imperialist Competition Algorithm has recently attracted the attention of researchers to solve the optimization problems more efficiently.
For comparison purposes, we have used several measurements to demonstrate the efficiency of MOICA. We used hypervolume [22] which is an indicator that defines the volume of search space dominated by Pareto fronts. We also computed biological indicators such as nCC, nPC, nSn, nPPV, sSn, sPPV, sASP, and nSp to demonstrate the biological quality of our results [23]. Finally, we considered the motifs extracted from the same instances as in [6,7,20].
This paper is structured as follows: As you read the first section is the introduction. In Section2, we briefly define the motif discovery problem (MDP). Then in Section 3 describes the multi-objective version of MDP. Next, in Section 4, we describe the ICA and our algorithm that would adjust ICA for the multi-objective version of MDP. Next section shows the experimental results obtained from MOICA and compares the results with some of the already existing approximation algorithms. Finally, we present our conclusion in the last section.
2.
Materials and methods
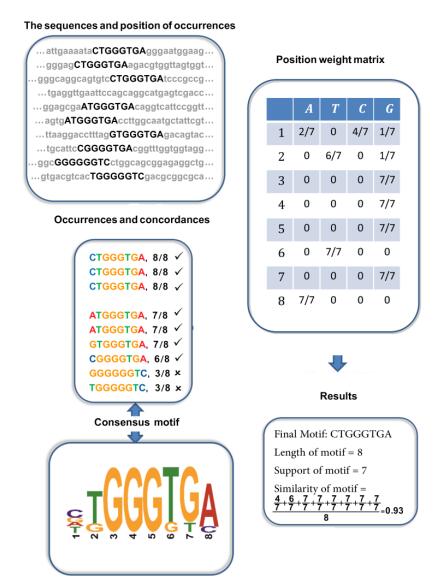
Consider n sequences with length m, which are a composition of the alphabet Σ, are called by si. We defined si[k, l] as a subsequence of si with length l that started from k. Also, let si[k] denote a single alphabet of si in position k. In this paper, we will be using the terms string(s) and sequence(s) interchangeably. A motif is obtained in the given input sequences by its occurrences. We denoted the occurrences related to one motif as a vector x = (x1, x2, …, xn), where xi is the starting position of an occurrence in the si and xi = 0, 1, 2, …, m-l+1, where l is the length of each occurrence in the dataset. Let us suppose that each sequence has a probability of selection. Then, we indicate xi = 0 if we don't select any occurrence in si. As a result, there is not an occurrence in the ith sequence with xi = 0 (Figure 1). The probability of selection is called rate in our paper. It is clear that a sequence with a rate = 40 has less chance for selection than one with a rate = 60. The start of metaheuristic algorithms is to create individual populations. Using each of these occurrences as an individual, then, we extract occurrences in the sequences regarding the length of motif (Figure 1). The length of the motif in our algorithm varies between 7 and 64 as in [24]. In order to obtain a consensus motif, we put all of the occurrences under each other (Figure 1). A composition of the maximum alphabet frequency for each column results in consensus motif (Figure 1). We define two variables to show consensus in a precise way: wi=maxfΣi is the maximum alphabet frequency, and the corresponding alphabet for wi is denoted by cwi, both of them extracted from the ith column of the occurrence matrix. Then, the consensus motif is expressed through consensus(x) = cw1cw2…cwn.
After finding the consensus motif, we find concordance of each occurrence; it is a normalized value that shows the resemblance between the consensus motif and the occurrence (Figure 1).
Where dH is the Hamming distance between two sequences with equal length, i.e., the number of positions where the two sequences differ. Furthermore, same as other algorithms in the literature, the threshold of our algorithm for concordance is 0.5. It means that if the concordance of ith occurrence is less than 0.5, we let xi = 0. The number of xi > 0 is the support of the motif which depends on its occurrences. The mathematical notation of it can be written in the following way:
Where uxi={1xi>00xi=0. In our example of Figure 1, a single motif occurrence exists in each sequence at most, but in reality, it can be more than one. On the other side, we make a limitation on the support, support(x)≥δ,δ={2n≤43n>4. Next, concept similarity is employed, which involve the maximum value from the ith column of the position weight matrix.
Then, the similarity is the average of maximum frequency for a potential motif with length l (Figure 1).
We computed the similarity of the example motif in Figure 1. A concept that we used in our algorithm is Complexity based on Fogel [25][Fogel, 2004 #51;Atashpaz-Gargari, 2007 #30]. The complexity of a string with length l in |Σ| different alphabets is computed as follows:
Where ni, j is the number of the jth alphabet from Σ in the selected sequence xi and |Σ| = 4 in DNA. As an example, the complexity of string "AAAAAAA' is log47!7!0!0!0!=0, and the complexity of string "AAATAAA" is log47!6!1!0!0!=1.40. These short strings are somehow useless in biology since nA = 7, 6. The complexity of an individual x is the average complexity value of each sequence.
The complexity of two strings "AAAAAAA" and "AAATAAA" is 0+1.402=0.70. The complexity depends on the length of the motif, which we normalize it based on the elicited motif length. In our algorithm, we took a minimum threshold of 0.5 (50%) for the complexity.
Our goal in this paper is to maximize the length, support, and similarity of the motif simultaneously while avoiding falls in low complexity result(s). In fact, these three values (length, support, and similarity) are our objectives. Fitness value of an individual is assessed based on its length, support, and similarity. We also have used the fitness value of each individual to compute the fitness value of a group of individuals. These two values help us to find the weakest and the most likehood individuals and the groups of individuals in our method.
We gathered all the variables and functions to define the problem in Table 1, again. The definition of each one also is illustrated.
We can express the problem mathematically as:
maxf(x)=(l,support(x),similarity(x))
s.t.
support(x)≥δ
complexity(x)≥0.5
concordance(xi)≥0.5,i=1,2,..,n,xi≠0
xi=0,1,2,…,m−l+1,i=1,2,…,n
l=7,8,…,64
3.
Multi-objective problems
A single-objective optimization problem is defined as:
Maxf(x)
s.t
gj(x)≤0,j∈J
hk(x)=0,k∈K
Where f(x) is a single function and gj(x), hk(x) are its constraints. In multi-objective optimization problems (MOOP), we have a vector of functions which has to be optimized. In such problems, the aim is to find the best value for all components, though the components of multi-objective function may be in conflict with each other, such that increasing in one component may causes decreasing in some other component(s).
The general form of a MOOP can be written as:
s.t
gj(x)≤0,j∈J
hk(x)=0,k∈K
Where f(x) is a vector with n components and gj(x), hk(x) are its constraints. After solving a MOOP, we obtain multiple solutions which may not be better than other solutions. We call such solutions as non-dominated solutions. In fact, the value of x dominates the value of y, which we indicate as f(x)≻f(y) if and only if f(x) is better than f(y) in at least one component, which may also be not worse than the other components. We say x is pareto- optimal or non-dominated optimal if there is no y in feasible space such that f(y) dominates f(x). We call a set of pareto-optimal solutions or non-dominated optimal solutions as pareto-optimal set. In fact, after solving a MOOP, we have a pareto-optimal set [26]. We also call the value of the pareto-optimal set as pareto fronts. Our goal is to find the best pareto fronts.
A lot of metaheuristic algorithms based on natural phenomena have been defined to solve optimization problems like genetic algorithm inspired by gene evolution, ant colony algorithm mimiced by ant search behavior, fish swarm optimization based on fish behavior looking for food. Among the metaheuristic algorithms, ICA has attracted the researchers' attention due to its ability to find good solutions for NP-hard problems. In the next section, we explain the ICA in detail. This is the main part of our paper.
In swarm algorithms, a group of individuals work collaboratively to solve a problem. To start the algorithm, initial individuals (countries) are created randomly. The cost of each individual (country) is calculated on the basis of its objective function value. We can refer to ICA ability to simulate a wider exploration during the solution searching space as an advantage.
4.
The MOICA algorithm
The Imperialist Competition Algorithm proposed by Atashpaz et al. in 2007 [27] was inspired by the intelligent behaviour of imperialist competition in the real world. This algorithm has some simple parameters such as the number of countries, the number of imperialists, and the maximum number of iterations. To solve multi-objective MDP, we propose a new algorithm based on the Imperialist Competition Algorithm. Similar to the other evolutionary algorithms, the first part of this algorithm is the creation of initial population. Then, all countries are classified into two groups: Imperialists and colonies. In fact, some of the best countries are selected as imperialists and the rest of them are called colonies. Colonies are divided by imperialists on the basis of their power. Thus, a group of empires are created which challenge each other to catch more countries. Two main processes occur after this assimilation process: Intra competition and extra completion. In intra competition, each colony moves towards its own imperialist and the imperialist tries also to increase its power. During this process, a colony replaces its own imperialist if it has more power. The next process is extra competition. In this process, the algorithm finds the weakest colony in the weakest empire and adds it to one of the strongest empires. The total power of an empire depends on the power of its imperialist and a percentage of the mean power of its colonies.
These two main processes would repeat in a reasonable time until the empires gradually collapse and finally all countries converge into one empire.
In this work, a particular intelligent behaviour which causes countries to rise or collapse is considered. Individuals in this algorithm are similar to MOGAMOD [6] and MOABC [20]. The main steps of the algorithm are given below:
Algorithm MOICA:
1.
Input: n sequences, the selection probability (rate), the number of Population (nPop), the number of Empires (nEmp), and the Maximum Iteration (MaxIt).
2.Create nPop countries with a fixed length l∈[lmin, lmax] and compute support and similarity for each of them.
3.Use non-dominated sorting to sort all Motifs (countries).
4.Assimilation: Select nEmp of best Motifs (countries) as imperialists and divide the other nCol countries between them based on imperialists' positions in Step 3.
5.Intra Competition: Make a revolution in colonies and imperialists in each empire and replace each imperialist by a colony if it is better.
6.Use non-dominated sorting to sort all Motifs (countries).
7.Compute the fitness function of each empire and find the weakest.
8.Extra competition: Select the weakest Motif (country) from the weakest empire and give it to the empire that has the most likehood to possess it.
9.Repeat 5–8 MaxIt times.
10.Output: Non-dominated set.
MaxIt, n sequences, rate, nPop, and nEmp are given as input. We should know the minimum and maximum length of motifs, lmin and lmax respectively to search within this range. To start the algorithm, we create and evaluate the initial countries (item 2). This step repeats for each motif length. Here, we add two propositions to our algorithm in this line. The first proposition is that the support of each individual (country) cannot be less than 2 for n = 2, 3 and it cannot be less than 3 for n≥4. The second proposition is that we don't let an individual (country) with low complexity get produced. In fact, we require the program to reproduce a new individual instead of a previous one which didn't satisfy our two propositions. The main process of MOICA starts after item 2.
After non-dominate sorting (in item 3), all the countries assimilate into nEmp countries which are selected after the sorting process (in item 4). We can divide the rest of algorithm into three blocks: Intra competition, non-dominate sorting, and extra competition. In intra competition block, we create colonies on the basis of their distances from their own imperialists and also create a new imperialist (we explain the way of mutation and crossover at the end of this section). We replace the imperialist by each of its colonies or create a new imperialist if its support and similarity is better than the imperialist based on the dominant concept and if its complexity is not low (item 5). In the second block, we do non-dominated sorting to find the rank between all countries (item 6). Hence, we calculate the fitness value of each country by:
We use the fitness value of each country to calculate the fitness (total power) of an empire. The fitness value of an empire is the fitness value of its imperialist added to a ζ percent of average fitness value of its colonies. In our proposal, we take ζ = 30%.
In the last block, we do an extra competition to find the weakest colony in the weakest empire to add it to one of the strongest empires (items 7 and 8). We find both of them based on their fitness, the fitness value of empire, and the fitness value of each country. Finally, we repeat this process Maximum Iteration (MaxIt) times to reach to some non-dominated imperialists. Then, we report them as motifs.
At the end of this section, we explain how we make new colonies move towards an imperialist. We also explain how we mutate a country (imperialist or colony). Let Imp = (a1, a2, …, an) and Col = (b1, b2, …, bn). First of all, in order to make a Col move towards an Imp for the creation of a new colony (b1', b2', …, bn') we do as follows:
Where η~U(0, 1) that is a uniform number between 0 and 1. We take β = 2 and prev = 10% in MOICA. We also notice that if ai≠0, bi≠0 then we don't let b'i < 1 or b'i > m-l+1. If bi < 1 or bi > m-l+1, we replace it with one and m-l+1, respectively.
Mutation is to make a revolution in the country (imperialist or colony). We produce a new country (a1', a2', …, an') as follows:
Here we take θ~U(-1, 1) and σ = 0.1(m-l+1). We also notice that if ai≠0, then we don't let a'i < 1 or a'i > m-l+1. If a'i < 1 or a'i > m-l+1, we replace it with one and m-l+1, respectively.
5.
Experimental results
In this section, we compare our algorithm with other significant algorithms in the literature. In order to show the efficiency of our algorithm, we performed some experiments as in Kaya [6] and Gonzalez et al. [7,20], and on real dataset as TRANSFAC database [23]. We compare our algorithm with some previous significant methods in the literature such as, MEME [10], Weeder [14], AlignACE [11], MOABC [20], MO-VNS [28], DEPT [24], MO-FA [29], MO-GSA [30], SPEA2 [31], and NSGA-II [32]. The comparison is made according to three metrics: Hypervolume indicator, biological indicators, and motif finding. Our proposed algorithm is written in C++1. The computation has been performed on a laptop computer with an Intel(R) Core(TM) i3 CPU M 330 (2.13 GHz) and 4.0 GB memory.
1 The source code would be available upon request.
One important performance measure for comparing MOICA with other multi-objective algorithms for finding TFBs is hypervolume indicator [22]. Hypervolume was used by Gonzalez [20] to show that MOABC mostly produces better results than the other algorithms in the literature. Hypervolume is an indicator that indicates the volume of search space covered by the result of algorithm. To calculate the hypervolume, (0, 0, 0) is selected as the worst point. In order to obtain more accurate results, we ran our algorithm 31 times for each instance to show its statistical significance and reported its average and standard deviation in Table 3. Reference volume in each instance depends on the number of sequences, the maximum length of each sequence, and the maximum similarity that is 1 (100%). For example, a dataset with 4 sequences will have the reference volume of 4 × 64 × 1. Since other source codes are not available, to compare MOICA with algorithms of [6,7], we have approximately used the same runtimes. To assure the power of our algorithm, we selected a composition of 54 real, generic, and Markov chain from TRANSFAC dataset [23] (called as ending in "r", "g", and "m" respectively) with different sequence numbers and lengths.
The dataset specifications, algorithm parameters for each instance, and runtime(s) are reported in Table 2. The total size of each data is equal to the product of the number of sequence and the length of sequence. As it is seen, MOICA has 4 parameters: the probability of selection of each sequence (rate), the Maximum Iteration (MaxIt), the number of Population (nPop), and the number of Empires (nEmp). To reach the best result, we ran the program several times to find the best parameters for MOICA and reported all of them in Table 2.
Hypervolume indicator is the first indicator used to compare MOICA with MOABC [20], MO-VNS [28], DEPT [24], MO-FA [29], MO-GSA [30], SPEA2 [31], and NSGA-II [32].
The result of this comparison is shown in Table 3. We divide the results in four parts: Datasets with n = 2 sequences, datasets with n = 3, 4, 5, 6, 7 sequences, datasets with n = 8, 9 sequences, and datasets with n > 9 sequences. In datasets with n = 2 sequences, NSGA-II has the best hypervolume value among all algorithms which is specified in Table 2, though MOABC, MO-GSA and SPEA2 have a value close to that of NSGA-II. In datasets with n = 2, 3, 4, 5, 6, 7 sequences, MOABC gets the best results in different cases most of the time. MO-VNS, NSGA-II, and SPEA2 have close results in this interval. For example, NSGA-II has the best hypervolume in dm05g (n = 2), mus07g (n = 3), dm01g (n = 3), and yst04r (n = 7). On the other hand, MO-VNS's hypervolume and SPEA2's hypervolume decrease quickly for n > 5 and n > 4, respectively. DEPT, MO-FA, MO-GSA, and MOICA have very weak hypervolume in this interval in most cases, though MO-FA and MOICA have the best hypervolume for hm16g (n = 7) and yst10m (n = 5), respectively. DEPT, MO-FA and MOICA gets better hypervolume if we increase the number of sequences.
For datasets with n = 8, 9 sequences, DEPT has the best hypervolume in most cases. Also, MOICA and MO-FA have a value close to that of DEPT in this interval, but other algorithms have very weak results. For datasets with n > 9, MOICA has the best results and its hypervolume for hm10g (n = 18) and hm20r (n = 35) is significant. Other algorithms are very weak for datasets with more than 9 sequences except MO-FA that has a better result just for hm09g (n = 10).
In biological indicators, we examine the biological properties of our proposal with fifteen methods in TRANSFAC database. In this assessment, we just ran MOICA 5 times for each dataset to elicit its properties. This database contains a list of four species with different n and m. We first define these biological tools based on both the nucleotide level and the site level. Specifically, at the nucleotide level [33].
● nTP is the number of nucleotide positions in both known sites and predicted sites;
● nFN is the number of nucleotide positions in known sites but not in predicted sites;
● nFP is the number of nucleotide positions not in known sites but in predicted sites;
● nTN is the number of nucleotide positions in neither known sites nor predicted sites.
At the site level [33]:
● sTP is the number of known sites overlapped by predicted sites;
● sFN is the number of known sites not overlapped by predicted sites;
● sFP is the number of predicted sites not overlapped by known sites.
We ran MOICA on the selected TRANSFAC database and found the following results for Fly, Human, Mouse, and Yeast.
Like Table 4, these parameters were computed for AlignAce, ANN-Spec, Consensus, GLAM, Improbizer, MEME, MEME3, MITRA, MotifSampler, ologo/dyad-analysis, QuickScore, SeSiMCMC, Weeder, and YMF. They were reported in Tompa [33].
We need some biological indicators to show the performance of each method on different species. These biological indicators are defined at the nucleotide (x = n) and site (x = s) levels as follows [33]:
● Sensitivity:xSn=xTPxTP+xFN
● PositivePredictiveValue:xPPV=xTPxTP+xFP
● Specificity:nSp=nTNnTN+nFP
● PerformanceCoefficient:nPC=nTPnTP+nFN+nFP
● theCorrelationCoefficient:nCC=nTP.nTN−nFN.nFP√(nTP+nFN)(nTN+nFP)(nTP+nFP)(nTN+nFN)
● averageperformance:sASP=sSn+sPPV2
Add nTP, nFP, nFN, nTN, sTP, sFP, and sFN over the TRANSFAC database and compute each indicator based on the top values (Table 3). We can see that our algorithm improves all biological indicators for Mouse and Fly instances significantly. It also gets best results for Human instances except for nPPV indicator. We also ran our proposal on Yeast datasets, but its result is weak. Table 4 indicates that Weeder has the best performance on Yeast. These biological indicators show that MOICA gets good results in most instances. It is important to mention that some biological tools achieve good results just in some instances but fail to obtain reasonable motifs in others.
We also compared our proposal with MOABC in biological realm. The nTP, nFP, nFN, nTN, sTP, sFP, and sFN is not available for MOABC except a figure in [7] where nTP, nFP, nFN, nTN, sTP, sFP, and sFN of all species added up and then all biological indicators computed. We did not the same rule because it compares the mean results and may be unfair.
The last experiment is accomplished based on motif finding and its non-dominated solutions are reported in Table 6. We ran our algorithm on four datasets of dm04g, hm22m, mus03g, and yst01g; hm22m and mus03g have 6 and 5 sequences respectively and the sequence length of each one is 500 bps, dm04g has 4 sequences, each with length 2000 bps, and yst01g has 9 sequences each with length 1000 bps. We compared MOICA with MOABC [20], because MOABC almost had the best performance among all algorithms.
We used the reported results for these four datasets in [7]. We computed length, support, similarity, and complexity of the reported results for MOABC and compared them with our results. The comparative results are recorded in Table 6. Our goal and other researchers were not to maximize complexity, but we report it just to show a fair comparison. In fact, most of algorithms can find the best results for length, support, and similarity with a low complexity. Table 6 shows that MOICA has the best results. We almost fixed support, length, and complexity to find a motif with high similarity. The results confirm that MOICA beats MOABC in motif finding.
Notice that MOABC and MOICA are multi-objective, so we can find alternative answers with different support and similarity for each length. As we can see in Table 6, MOICA obtained the best results for all of these datasets.
In this experiment, we ran our algorithm so that only one or two empire(s) remained at the end. To reach this goal, we fixed the parameters of our algorithm at nPop = 200, nEmp = 50, nCol = 150 and MaxIt = 800. We also defined rate based on datasets. The selection probability of each sequence (rate) depends on the data and the kind of the motif that we want to find. For example, if the support of the desired motif is close to the number of sequences of the dataset, it is better to take rate from 70 to 100. Moreover, the selection probability of each sequence (rate) changes from 30 to 100.
6.
Discussion and conclusion
In this paper, we have proposed a metaheuristic algorithm for solving MDP considering a Multi-objective Imperialist Competition Algorithm (MOICA) based on three optimization functions. A big contribution of our method is that it gives alternative answers in a single run. Thus, the user can select useful ones among multiple answers.
In order to assess the performance of our algorithm, we ran MOICA on 54 sequence datasets from four species with different length and various numbers of sequences and compared the result with those obtained by previous methods. To facilitate comparing, we used the same criteria as used in multi-objective algorithms like hypervolume indicator. It is demonstrated that our algorithm gets a significant average hypervolume indicator in a set of instances with more than nine sequences. We also computed biological indicators (nCC, nPC, nSn, nPPV, sSn, sPPV, sASP, and nSp) for some selected instances in the benchmark that were mentioned in previous works. Its biological indicators have the best results in all instances except yeast. Furthermore, we also found motifs for 4 different datasets with different number of sequences and lengths. It can be concluded that the solutions found by our algorithm gives the best results among all algorithms in the literature. In future, we can modify our algorithm by composing other SI algorithms to make it more realistic with a better performance. Artificial Bee Colony (ABC) is a metaheuristic procedure which obtained good result for MDP considering a multi-objective framework.
As future works, we intend to design new approaches to discover common patterns in sequences. At first, we interest in integrating ICA and ABC to invent a new algorithm to improve results for a bigger set of the datasets. Other desirable research is directly related to model this problem as an optimization-programming problem to use the existing algorithms for solving it. Finally, we would like to try to find new methods with the aim of improving both optimization programming and biological results.
Financial support
This research did not receive any specific grant from funding agencies in the public, commercial, or not-for-profit sectors. The authors appreciate University of Guilan for partial financial support.
Conflict of interest
The authors declare that they have no conflict of interest.


 DownLoad: