Research article Special Issues

Land-use impacts on water resources and protected areas: applications of state-and-transition simulation modeling of future scenarios

  • Received: 28 January 2015 Accepted: 19 April 2015 Published: 21 April 2015
  • Human land use will increasingly contribute to habitat loss and water shortages in California, given future population projections and associated land-use demand. Understanding how land-use change may impact future water use and where existing protected areas may be threatened by land-use conversion will be important if effective, sustainable management approaches are to be implemented. We used a state-and-transition simulation modeling (STSM) framework to simulate spatially-explicit (1 km2) historical (1992-2010) and future (2011-2060) land-use change for 52 California counties within Mediterranean California ecoregions. Historical land use and land cover (LULC) change estimates were derived from the Farmland Mapping and Monitoring Program dataset and attributed with county-level agricultural water-use data from the California Department of Water Resources. Five future alternative land-use scenarios were developed and modeled using the historical land-use change estimates and land-use projections based on the Intergovernmental Panel on Climate Change's Special Report on Emission Scenarios A2 and B1 scenarios. Spatial land-use transition outputs across scenarios were combined to reveal scenario agreement and a land conversion threat index was developed to evaluate vulnerability of existing protected areas to proximal land conversion. By 2060, highest LULC conversion threats were projected to impact nearly 10,500 km2 of land area within 10 km of a protected area boundary and over 18,000 km2 of land area within essential habitat connectivity areas. Agricultural water use declined across all scenarios perpetuating historical drought-related land use from 2008-2010 and trends of annual cropland conversion into perennial woody crops. STSM is useful in analyzing land-use related impacts on water resource use as well as potential threats to existing protected land. Exploring a range of alternative, yet plausible, LULC change impacts will help to better inform resource management and mitigation strategies.

    Citation: Tamara S. Wilson, Benjamin M. Sleeter, Jason Sherba, Dick Cameron. Land-use impacts on water resources and protected areas: applications of state-and-transition simulation modeling of future scenarios[J]. AIMS Environmental Science, 2015, 2(2): 282-301. doi: 10.3934/environsci.2015.2.282

    Related Papers:

    [1] Zishuo Yan, Hai Qi, Yueheng Lan . The role of geometric features in a germinal center. Mathematical Biosciences and Engineering, 2022, 19(8): 8304-8333. doi: 10.3934/mbe.2022387
    [2] Mika Yoshida, Kinji Fuchikami, Tatsuya Uezu . Realization of immune response features by dynamical system models. Mathematical Biosciences and Engineering, 2007, 4(3): 531-552. doi: 10.3934/mbe.2007.4.531
    [3] Jinhu Xu, Yicang Zhou . Bifurcation analysis of HIV-1 infection model with cell-to-cell transmission and immune response delay. Mathematical Biosciences and Engineering, 2016, 13(2): 343-367. doi: 10.3934/mbe.2015006
    [4] Qian Ding, Jian Liu, Zhiming Guo . Dynamics of a malaria infection model with time delay. Mathematical Biosciences and Engineering, 2019, 16(5): 4885-4907. doi: 10.3934/mbe.2019246
    [5] Ting Guo, Zhipeng Qiu . The effects of CTL immune response on HIV infection model with potent therapy, latently infected cells and cell-to-cell viral transmission. Mathematical Biosciences and Engineering, 2019, 16(6): 6822-6841. doi: 10.3934/mbe.2019341
    [6] Yan Wang, Minmin Lu, Daqing Jiang . Viral dynamics of a latent HIV infection model with Beddington-DeAngelis incidence function, B-cell immune response and multiple delays. Mathematical Biosciences and Engineering, 2021, 18(1): 274-299. doi: 10.3934/mbe.2021014
    [7] A. M. Elaiw, Raghad S. Alsulami, A. D. Hobiny . Global dynamics of IAV/SARS-CoV-2 coinfection model with eclipse phase and antibody immunity. Mathematical Biosciences and Engineering, 2023, 20(2): 3873-3917. doi: 10.3934/mbe.2023182
    [8] Katrine O. Bangsgaard, Morten Andersen, Vibe Skov, Lasse Kjær, Hans C. Hasselbalch, Johnny T. Ottesen . Dynamics of competing heterogeneous clones in blood cancers explains multiple observations - a mathematical modeling approach. Mathematical Biosciences and Engineering, 2020, 17(6): 7645-7670. doi: 10.3934/mbe.2020389
    [9] Huan Kong, Guohong Zhang, Kaifa Wang . Stability and Hopf bifurcation in a virus model with self-proliferation and delayed activation of immune cells. Mathematical Biosciences and Engineering, 2020, 17(5): 4384-4405. doi: 10.3934/mbe.2020242
    [10] Tahir Khan, Fathalla A. Rihan, Muhammad Ibrahim, Shuo Li, Atif M. Alamri, Salman A. AlQahtani . Modeling different infectious phases of hepatitis B with generalized saturated incidence: An analysis and control. Mathematical Biosciences and Engineering, 2024, 21(4): 5207-5226. doi: 10.3934/mbe.2024230
  • Human land use will increasingly contribute to habitat loss and water shortages in California, given future population projections and associated land-use demand. Understanding how land-use change may impact future water use and where existing protected areas may be threatened by land-use conversion will be important if effective, sustainable management approaches are to be implemented. We used a state-and-transition simulation modeling (STSM) framework to simulate spatially-explicit (1 km2) historical (1992-2010) and future (2011-2060) land-use change for 52 California counties within Mediterranean California ecoregions. Historical land use and land cover (LULC) change estimates were derived from the Farmland Mapping and Monitoring Program dataset and attributed with county-level agricultural water-use data from the California Department of Water Resources. Five future alternative land-use scenarios were developed and modeled using the historical land-use change estimates and land-use projections based on the Intergovernmental Panel on Climate Change's Special Report on Emission Scenarios A2 and B1 scenarios. Spatial land-use transition outputs across scenarios were combined to reveal scenario agreement and a land conversion threat index was developed to evaluate vulnerability of existing protected areas to proximal land conversion. By 2060, highest LULC conversion threats were projected to impact nearly 10,500 km2 of land area within 10 km of a protected area boundary and over 18,000 km2 of land area within essential habitat connectivity areas. Agricultural water use declined across all scenarios perpetuating historical drought-related land use from 2008-2010 and trends of annual cropland conversion into perennial woody crops. STSM is useful in analyzing land-use related impacts on water resource use as well as potential threats to existing protected land. Exploring a range of alternative, yet plausible, LULC change impacts will help to better inform resource management and mitigation strategies.


    1. Introduction

    The production of high-affinity antibodies capable of broad neutralization, viral inactivation, and protection against viral infections or disease requires activation, expansion, and maturation of B-cells into virus specific long-lived plasma and memory cells [46]. Germinal centers (GC) are the anatomical structures in which B-cells undergo somatic hypermutation, immunoglobulin class switching, and antigen-specific selection [30]. Somatic hypermutations are random and, therefore, the emergence of non-autoreactive, high-affinity B-cell clones requires strong selection through competition for survival signals [48]. The exact nature of these survival signals is poorly understood. T follicular helper (Tfh) cells have been identified as an important factor in driving B-cell hypermutation inside germinal centers [45]. Indeed, recent experiments have identified correlations between the density, function, and infection status of Tfh cells and the development of mature germinal centers [18,31,32,33,44,43,36].

    Determining the characteristics of germinal centers such as their formation, size, and composition is important in understanding the protective mechanisms against pathogens that induce chronic infections. During HIV infections, only approximately 15-20% of chronically infected subjects develop antibodies with neutralization breadth [25,40]. These antibodies are highly mutated compared to antibodies induced by most viral infections in vivo [41] or through vaccination [26]. For example, the high-affinity human antibody VRC01, which neutralizes 90% of HIV-1, has 70-90 somatic mutations [47] compared to the natural 5-10 somatic mutations [14]. The mechanisms that allow for the production of protective antibodies in some patients but not others are still under investigation [15,39,7,16,3].

    Mathematical models have been used in the past to investigate the mechanisms responsible for B-cell somatic hypermutations inside the germinal centers [10,28,22,21,6,12,19,23,1,36,34]. Early studies hypothesized that re-entry into new GCs of B-cells from previous GCs may explain the affinity maturation process [10,28]. Others showed that affinity maturation requires cyclic transition of B-cells between the two anatomical structures of the germinal center: the dark and light zones [22,21,6,12,19,23,1]. The models that incorporate dark and light zones investigated the role of molecular mechanisms such as competition for Tfh cells [23,36,34], antigen on the surface of follicular dendritic cells [37], binding sites [12], and clonal competition [35] in facilitating movement between the two zones. Lastly, they investigated internal and external stimuli that lead to germinal center termination [20,27,1]. These studies have not considered the mechanisms behind the emergence of large number of B-cell somatic hypermutations inside germinal centers as seen in some HIV patients [47]. Nor did they present hypotheses behind the absence of broadly neutralizing antibodies in the majority of HIV patients. Understanding the mechanistic interactions inside GCs that lead to production of plasma cells capable of producing antibodies with neutralization breadth forms the focus of this paper.

    To address this, we develop mathematical models of germinal center formation that investigate the role of B-cell competition, Tfh cells, and antigen in inducing large numbers of B-cell somatic hypermutations, as seen in the few HIV patients that produce broadly neutralizing antibodies. We first develop a deterministic model of Tfh cell-B cell interactions to determine how B-cell selection and competition influences GC formation in acute infections. We fit the model to published germinal center B-cell data to estimate parameters. We then investigate the mechanisms that allow for emergence of highly mutated B-cell clones that are capable of protecting against chronic infections with non-mutating antigen, i.e. substances that do not mutate but stimulate antibody generation. Finally, we investigate how our predictions change when we consider antigenic mutation.

    For a non-mutating pathogen, we predict that when only a few rounds of somatic hypermutations are needed for the clearance of a pathogen, as in acute infections, the Tfh cells are not limiting the emergence of high affinity B-cell clones. When large numbers of somatic hypermutations arise, however, a limitation in the number of Tfh cells may prevent B-cell clones of higher affinity from emerging and becoming the dominant B-cell population inside the germinal centers. Moreover, we predict that for a mutating pathogen which drives the somatic hypermutation of B-cells, emergence of B clones of highest affinity may be hindered not only through a limitation in the number of Tfh cells but also by the speed of the viral mutation.


    2. Model of germinal center formation

    We develop a mathematical model of B-Tfh cell dynamics which considers the interaction between the naive CD4 T-cells ($N$), non-mutating antigen ($V$), pre-Tfh cells ($H$), Tfh cells ($G$), primed follicular B-cells ($B_0$), GC B-cells that have undergone $i$ rounds of somatic hypermutations ($B_i$), and plasma cells ($P$). Here $1\leq i\leq n$ and $n$ represents the maximum number of B-cell clones inside a single germinal center.

    $N$ cells are produced at rate $s_N$ and die at per capita rate $d_N$ and, upon encountering specific antigen $V$, migrate to the T:B cell border and become pre-Tfh cells $H$ at rate $\alpha_N$. $H$ cells either migrate to GCs following interaction with primed follicular B-cells $B_0$ and differentiate into Tfh cells $G$ at rate $\gamma$, or die at per capita rate $d_H$. $G$ cells are lost through natural death at per capita rate $d_G$. Moreover, we assume that competition between B-cell clones $B_i$ for Tfh cell-induced stimulation is limiting $G$ population growth at rate $\eta$. This competition, in return, will limit the number of B-cells inside GCs and their transition between clones of higher affinity for the pathogen.

    Primed follicular B-cells $B_0$ (B blasts) die at rate $d$ and, upon interaction with pre-follicular helper cells $H$, move inside germinal centers where they undergo affinity maturation. We assume that each stage of affinity maturation requires Tfh cell help at the same rate $\sigma$ and that each population $B_{i}$ produces $\alpha$ offsprings $B_{i+1}$, for $1\leq 1\leq n-1$ [45]. $B_i$s die at the same per capita rate $d$ as B blasts. Lastly, cells in clone $B_n$ leave germinal centers at rate $\kappa$ to become plasma cells $P$ capable of removing a non-mutating antigen $V$ at rate $\mu$.

    The system describing these interactions is given by:

    $ \frac{dN}{dt} = s_N -d_N N - \alpha_N V N, $ (1a)
    $ \frac{dH}{dt} = \alpha_N V N -d_H H - \gamma H B_0, $ (1b)
    $ \frac{dG}{dt} = \gamma H B_0 - d_G G - \eta G \sum\limits_{i=1}^n B_i, $ (1c)
    $ \frac{dB_0}{dt} = -d B_0 - \sigma B_0 H, $ (1d)
    $ \frac{dB_1}{dt} = \alpha \sigma B_{0} H - \sigma B_1 G - d B_1, $ (1e)
    $ \frac{dB_i}{dt} = \alpha \sigma B_{i-1} G - \sigma B_i G - d B_i, $ (1f)
    $ \frac{dB_n}{dt} = \alpha \sigma B_{n-1} G -d B_n - \kappa B_n, $ (1g)
    $ \frac{dP}{dt} = \kappa B_n, $ (1h)
    $ \frac{dV}{dt} = - \mu V P, $ (1i)

    for $1\leq i\leq n-1$ with initial conditions $N(0)=s_N/d_N$, $B(0)=B_0$, $V(0)=V_0$ and all other populations are initially absent. Our goal is to determine the dynamical evolution of the total B-cell population in a single germinal center based on the availability of Tfh cells. We focus on the size and composition of B-cells in the germinal center,

    $ B_t=\sum\limits^{n}_{i=1} B_i, \label{sum} $ (2)

    for acute infections and for chronic infections where many rounds of affinity maturation lead to development of broadly neutralizing antibody-producing plasma cells, as seen in a few HIV infections [25,40].


    3. Tfh-B-cell dynamics during acute infections

    In acute infections, B clones undergo between 5 and 10 steps of affinity maturation [14,29,27]. Without loss of generality, we set $n=8$. We assume that $N(0)=10^6$ naive CD4 T-cells per ml are recruited by the antigen $V$. Studies have shown that mature B-cell clones inside germinal centers are the progeny of as little as 3 precursor blasts [13,11]. Therefore, the initial blast population is $B(0)=3$ cells.

    The $B_t$ data was collected from young, pathogen free mice. The splenic germinal center B-cells' temporary responses to a T-dependent antigen were measured [9], therefore providing germinal center B-cell dynamics throughout an acute infection. The antigen $V$ is the density of sheep red blood cells (sRBC) per ml injected into the mouse, $V(0)=2\times 10^8$ sRBC per ml. It elicits a B-cell expansion inside a germinal center and subsequent antigen clearance. Lastly, we assume that at the time of the infection, all the other populations are absent, i.e. $H(0)=G(0)=0$ cells per ml and $P(0)=B_{i}(0)=0$ cells, for $1\leq i\leq n$.

    In our model, the per capita death rates of all CD4 T-cells are equal, $d_N=d_H=d_G=0.01$ per day [38], and the naive CD4 T-cell population is at equilibrium at the beginning of infection, i.e., $s_N=d_N \times N_0=10^4$ cells per ml per day. Naive CD4 T-cells $N$ are activated by antigen $V$ at rate $\alpha_N$ and move to the follicles and become pre-Tfh cells $H$. Since the pre-follicular T-cell density is around $10^4$ cells per ml and the ratio between $G$ and $H$ cells ranges between 2 and 4 in the first 10 days of germinal center formation [36], we adjust parameters $\alpha_N=1.8\times 10^{-11}$ ml per day per cell and $\gamma=2$ per cell per day to reflect this fact.

    B-cells in each B clone die at rate $d=0.8$ per day [11], independent of affinity maturation class $i$. Since the dynamics of $V$ and $P$ do not affect the Tfh-B-cell interactions, we arbitrarily assign values for parameters $\kappa=1.2$ per day and $\mu=2$ per cell per day, the plasma cell production rate and antigen removal rate, respectively. We will later analyze the effect of varying these rates. A summary of initial conditions and fixed parameters is presented in Table 1.

    Table 1. Variables and fixed parameter values.
    NameValueUnitsDescriptionCitation
    $s_N$$10^4$cells per ml per dayNaive CD4 T-cell recruitment rate[38]
    $d_N$$0.01$per dayNaive CD4 T-cell death rate[38]
    $\alpha_N$$1.8\times 10^{-11}$ml per day per cellPre-Tfh cell production rate
    $d_H$$0.01$per dayPre-Tfh cell death rate[38]
    $d_G$$0.01$per dayTfh cell death rate[38]
    $d$$0.8$per dayB-cell death rate[11]
    $\kappa$$1.2$per dayPlasma cells production rate
    $\gamma$$2$per cell per dayPre-Tfh cell differentiation rate[36]
    $\mu$$2$per cell per dayAntigen removal rate
    $\eta$$10^{-5}$per cell per dayTfh competition rate
    $N(0)$$10^6$cells per mlInitial amount of CD4 T cells[38]
    $H(0)$0cells per mlInitial amount of Pre-Tfh cells
    $G(0)$0cells per mlInitial amount of Tfh cells
    $B_0(0)$3cellsInitial amount of B-cells[13,11]
    $B_i(0)$0cellsInitial amount of B-cell clones
    $P(0)$0cellsInitial amount of plasma cells
    $V(0)$$2\times 10^8$per mlInitial amount of non-mutating antigen[9]
     | Show Table
    DownLoad: CSV

    We estimate the remaining parameters $\alpha$, the B-cell offspring production rate, and $\sigma$, the B-cell transition rate, by fitting the total $B_t$ population as given by (2), in the presence of competition for Tfh cell signaling, i.e. $\eta=10^{-5}$ per cell per day, to published germinal center B-cell data [27,9]. We used nlinfit in MATLAB R2014b (The MathWorks Inc., Natick, MA). The estimates and confidence intervals for $\alpha$ and $\sigma$ are presented in Table 2.

    Table 2. Parameter estimates and confidence intervals.
    Name Units Value Description Confidence Intervals
    $\alpha$ 27.469 B-cell offspring production rate [14.015 40.924]
    $\sigma$ ml per cell per day $1.1 \times 10^{-5}$ Affinity maturation rate [4.8 $\times 10^{-6}$ 1.7 $\times 10^{-5}$]
     | Show Table
    DownLoad: CSV

    3.1. Numerical results

    The dynamics of all variables of system (1) over time for parameters in Tables 1 and 2 are shown in Figure 1. The number of offspring produced by each B-cell clone is $\alpha=27.5$ and the transition rate is $\sigma=1.1\times 10^{-5}$ ml per cell per day. Competition for Tfh cell help does not affect the fit and $B_t$ dynamics. Indeed, when $\eta$, the competition parameter, is decreased from $10^{-5}$ to $0$ per cell per day and $\sigma=1.1\times 10^{-5}$ ml per cell per day the estimate for $\alpha$, the B-cell offspring production rate, decreases by less than $1.5%$ to $\alpha=27.1$. Therefore, we predict that the Tfh cell population is not inhibiting the emergence of B-cells that underwent the maximum $8$ rounds of somatic hypermutation.

    Figure 1. Dynamics of model (2) applied to an acute infection.
    (a) $B_t$ as given by (2) versus data (•); (b) B-cells that underwent different levels of somatic hypermutations and plasma cells, for $\mu=2$.; (c) Pre-Tfh cells $H$ per ml and Tfh cells $G$ per ml; and (d) Antigen per ml; for $\mu=2$ per cell per day (solid lines), $\mu=2\times 10^{-2}$ per cell per day (dashed lines) and $\mu=2\times 10^{-4}$ per cell per day (dotted lines). The dashed-dotted line is the antigen limit of detection of $3\times 10^{-4}$ sRBC per ml. The other parameter values are given in Tables 1 and 2.

    The total number of B-cells in the germinal center, $B_t$, reaches a maximum of $1147$ cells, eleven days after infection and the germinal center dies out 29 days after infection (see Figure 1, panel a). Over time, the germinal center is formed by B-cell clones of the highest somatic hypermutation, with the maximum ratio between the peaks of two consecutive clones $B_{i}/B_{i-1}=2.91$ occurring for $i=5$. There is a delay between the peaks of each clone ranging between 0.3 and 2.1 days. For the plasma cell production rate $\kappa=1.2$ per day, plasma cells emerge $4.5$ days following infection and reach a value of 4000 cells, 15 days following infection (see Figure 1, panel b).

    The pre-Tfh and Tfh populations, $H$ and $G$, reach their maximum density of $6.1 \times 10^3$ and $9.6\times 10^3$ cells per ml, 5 and 7 days following infection, respectively. The $G:H$ ratio increases to $2.5$, two days following infection and then levels off to 1.7 more Tfh than pre-Tfh cells (see Figure 1, panel c). A higher ratio, of as high as $4$-times more Tfh than pre-Tfh cells, as predicted by [36], can be obtained if we increase $\gamma$, the pre-Tfh cell differentiation rate, by $50%$ (not shown). Once the antigen is eliminated, both $H$ and $G$ populations disappear.

    For $\mu=2$ per cell per day, the antigen is lost $5.9$ days after infection. At that time $V$ reaches $3\times 10^{-4}$ sRBC per ml (or 1 sRBC in the body). A reasonable concern is that varying this rate would affect the dynamics of the total B-cell population, as a prolonged antigenic stimuli would potentially lead to a larger germinal center that lasts for a longer period of time. To gain a deeper understanding of the role of $\mu$, the antigen removal rate, in the $B_t$ dynamics, we decrease $\mu$ by two and four orders of magnitude. As expected, when we decrease $\mu$ to $2\times 10^{-2}$ and $2\times 10^{-4}$ per cell per day, the time needed for the removal of antigen increases to $10$ and $33$ days following infection, respectively (see Figure 1, panel d). The maximum $B_t$ increases by $28 %$ and $32 %$ respectively and germinal centers last for $30$ days (see Figure 1, panel a). The $\mu$ effect on $G$ population is not significant, but the $H$ increases and exceeds the $G$ population (see Figure 1, panel c).


    3.2. Sensitivity analysis

    We performed a focused analysis of the time-dependent sensitivity of model (1)'s trajectories to parameter variation, known as a semi-relative sensitivity analysis. We start by looking at the sensitivity of variables $B_t$ and $G$ to changes in the two fitted parameters $\alpha$, the B-cell offspring production rate, and $\sigma$, the B-cell transition rate, as follows. We define the absolute sensitivity variables $B_{t,q}=\frac{\partial B_t (t,q)}{\partial q}$ and $G_{q}=\frac{\partial G (t,q)}{\partial q}$. They are obtained by differentiating both sides of system (1) with respect to $q$, for $q=\{\alpha, \sigma\}$. The semi-relative sensitivity variables are calculated by multiplying the absolute sensitivity by the variables $q$.

    In Figure 2 we compared the semi-relative sensitivity curves $q B_{t, q}$ and $q G_q$ for $q=\sigma$ and $q=\alpha$. These parameters have complementary effects on both $B_t$ and $G$ populations. As such, if $\alpha$, the B-cell offspring production rate, and $\sigma$, the B-cell transition rate, are doubled, $B_t$ increases by a maximum of $6121.6$ and $5166.6$ cells at day 10 following infection (see Figure 2, top panel). Varying parameters $\alpha$ and $\sigma$ has no effect on $G$ for the first $5$ days. After that time, their effect is negative. In particular, if either of the two parameters is doubled, then the $G$ population decreases by 5366 or 5504 cells per ml at day $17$ for $\sigma$ and $\alpha$ respectfully (see Figure 2, bottom panel).

    Figure 2. Sensitivity Analysis.
    $B_t$ and $G$ (grey lines) and the semi-relative sensitivity curves, $q \frac{\partial B_t}{\partial q} $and $q \frac{\partial G}{\partial q}$, over time for $q=\alpha$ (solid lines), $q=\gamma$ (dotted lines) and $q=\sigma$ (dashed lines).

    We further looked for parameters that have antagonistic effects on the $G$ dynamics. We compared the semi-relative sensitivity curves $q B_{t, q}$ and $q G_q$ for $q=\sigma$ and $q=\gamma$ (see Figure 2). These parameters have complementary effects on $B_t$ (see Figure 2, top panel) and antagonistic effects on $G$ (see Figure 2, bottom panel). In particular, while $\sigma$, the B-cell transition rate, has no effect on $G$ four days following infection, doubling the value of $\gamma$, the pre-Tfh cell differentiation rate, leads to an increase in the $G$ population by $1.37 \times 10^4$ cells per ml at day 4 (see Figure 2, bottom panel).


    4. Tfh-B-cell dynamics during chronic infections

    We next want to understand the size and B-cell clone compositions of germinal centers during prolonged antigenic stimuli. During chronic virus infections with viruses like HIV, the development of broadly neutralizing antibodies, with high mutation levels, can occur after many years of infection. For example, the high-affinity human antibody VRC01 has 70-90 mutations [47]. We will use model (1) and parameters in Tables 1 and 2 as a starting point for understanding how the B-cell and Tfh cell dynamics change when many rounds of somatic hypermutations are allowed. Most importantly, we want to determine the mechanistic interactions that allow for the emergence of a large enough B-clone with the highest level of mutation, which is capable of removing the antigen.

    We represent highly mutated antibodies by increasing the level of admissible B-cell somatic hypermutations to $n=50$ in model (1). We start by keeping all other parameters as in Tables 1 and 2. As expected, increasing $n$ leads to an increase in the $B_t$ population, with the $B_t$ peak being two orders of magnitude higher and occurring two days earlier than in the $n=8$ case. Such large germinal centers are not uncommon in persistent infections such as HIV [42], and subsequently we assumed the B-cell size to be reasonable and did not attempt to refit model (1) with $n=50$ to the acute data. Under these assumptions, we predict that the germinal center terminates two days earlier, at 27 days following infection (see Figure 3, panel a).

    Figure 3. Comparison of model (1)'s dynamics when $n$, $\alpha$ and $\sigma$ are varied.
    (a) $B_t$ as given by (2) versus data (•); and (b) $G$ per ml as given by model (1) for $n=8$ (solid lines); $n=50$, $\alpha=27.5$, $\sigma=1.1\times 10^{-5}$ ml per cell per day (dashed lines); and $n=50$, $\alpha=1.6$, $\sigma=\times 10^{-3}$ ml per cell per day (dotted lines). The other parameters are given in Tables 1 and 2.

    We observe that the Tfh cell population is smaller compared to the acute case during the contraction time, i.e. past $9$ days following infection. This is due to competition between an increasing number of B-cell clones for Tfh cell stimuli as given by the term $\eta B_t G$ (see Figure 3, panel b).

    To gain an understanding on the role of competition for Tfh cell help we compute and plot the distribution of B-cell clones for $n=8$ and $n=50$ at $t=10$, $t=20$, and $t=30$ days after the germinal center initiation. For $n=8$ and the three times considered, the late clones dominate the $B_t$ population and, as time progresses, more and more of $B_t$ is dominated by $B_8$, which is the clone that underwent the maximum rounds of hypermutations and the only clone giving rise to plasma cells (see Figure 4, top row). For $n=50$, however, $B_t$ is dominated by the clones that underwent $15-35$ rounds of somatic hypermutations at all times considered, and the $B_{50}$ clone is never reached (see Figure 4, second row). Although there has been a slight movement to the later clones, there is very little change in the distribution between $t=20$ and $t=30$ days. Since only $B_{50}$ produces plasma cells capable of removing virus, we predict that $dV/dt=0$, and the virus remain at its initial value which was representative of a chronic infection.

    Figure 4. B clone distribution in acute and chronic infections.
    Clonal distribution $B_i/B_t$ for $0\leq i \leq n$, $t=10$, $t=20$, $t=30$ days following infection for $n=8$ (top row) and $n=50$ (second row). Note that for $n=8$ the germinal center contains the B clone with the highest level of somatic hypermutation $B_8$, while for $n=50$ case the germinal center is dominated by middle clones and the $B_{50}$ clone is absent. We then show two mechanisms to achieve the $B_{50}$ clone: (third row) $\eta=0$ and (bottom row) $\alpha=1.6$, $\sigma=10^{-3}$ ml per cell per day, $\eta=10^{-5}$ per cell per day. $B_t$ is given by (2), and the other parameters are given in Tables 1 and 2. In both situations clone $B_{50}$ dominates the germinal center B-cell population $20$ days following infection.

    Experimental data suggests that the key to developing therapies againstchronic HIV infection lies in creating B-cells of the highest allowed level of somatic hypermutation [30]. Such later clones are instrumental for creating plasma and memory cells that produce highly mutated antibodies capable of neutralizing HIV virus. Our model is such that only the B-cells in the last clone become plasma cells that remove the virus, and since few $B_{50}$ cells are being produced, the virus will persist. Therefore, we aim to understand what parameter changes will allow for the emergence of B-cell clones that underwent $50$ rounds of affinity maturation, currently not observed in our predictions.

    Not surprisingly, clone $B_{50}$ can be achieved if the Tfh cells $G$ are not a limiting value, in particular if we remove the competition term, i.e., $\eta=0$ per cell per day (see Figure 4, third row). Under this assumption, antigen $V$ is eliminated $11.1$ days following infection. In order to determine if additional interactions can lead to the same behavior, we keep $\eta=10^{-5}$ per cell per day and adjust two different parameters. As such, if we increase $91$-times the rate at which B-cell hypermutation is driven by interaction with Tfh cells, i.e. $\sigma=0.001$ ml per cell per day, and we decrease $17.2$-times the number of offspring produced during each clonal transition, i.e., $\alpha=1.6$ and keep the other parameters as in Tables 1 and 2, then the germinal center will contain the last clone $B_{50}$ at all times. Moreover, $B_{50}$ will become the dominant clone $t=20$ days following infection (see Figure 4, bottom row). That means that decreasing the number of B-cells in each clone and speeding their transition rate into the next affinity class is sufficient in driving affinity maturation towards clones of the highest level of somatic hypermutation.

    Under the adjusted values, $\alpha=1.6$, the B-cell offspring production rate, and $\sigma=10^{-3}$ ml per cell per day, the B-cell transition rate, the total germinal center B-cell population $B_t$ peaks 13 days following infection and reaches a maximum of $1.39 \times 10^4$ cells, $12$-times higher than in the acute case (see Figure 3, panel a). The Tfh population is $3.6$-times smaller than in the acute and chronic cases for the first ten days, due to the decrease in offspring production. After day $10$, the Tfh population decreases even further to $10^3$ cells per ml (see Figure 3, panel b). However, this population is one order of magnitude higher than in the non-adjusted chronic case. This population is sufficient to provide help to all B-cell clones, such that the $B_{50}$ clone can emerge, create plasma cells, and, most importantly, remove the antigen. For these adjusted parameters $V$ is removed $9.5$ days following infection.


    5. Modeling mutating antigen

    Our model does not consider the effect of a mutating antigen, nor does it consider the need of both antigenic stimuli and Tfh cell help at each stage of B-cell somatic hypermutation. Previous studies predict that B-cell hypermutation is dependent on not only the ability of B-cells to recruit Tfh cell help, but also on the ability of the B-cells to retrieve and present antigen deposited on follicular dendritic cells [42,4,23,34].

    We extend model (1) to account for a mutating virus. In particular, we model a sequential mutation from virus $V_0$ to $V_{n-1}$ at rate $0<f<1$. We only model the virus mutations that drive B-cell somatic hypermutations and all other mutations are ignored. Therefore, clone $B_{i-1}$ is mutating into clone $B_i$ due to stimuli from both Tfh cells and the respective virus variant $V_{i-1}$ at rate $\sigma V_{i-1} G$, for $1\leq i\leq n$. The T-cell populations, $N$, $H$ and $G$ are modeled as before with the addition that total viral load, $V_t=\sum_{i=0}^{n-1} V_i$, can recruit pre-Tfh cells inside germinal centers to give rise to Tfh cells. As before, only the last clone, $B_n$, produces plasma cells, $P$. Under the assumption that broadly neutralizing antibody producing plasma cells are formed [42], $P$ will remove all virus strains at rate $\mu$. The modified model becomes

    $ \frac{dV_0}{dt} = - f V_0 -\mu V_0 P, $ (3a)
    $ \frac{dV_i}{dt} = f V_{i-1}-f V_i -\mu V_i P, $ (3b)
    $ \frac{dV_{n-1}}{dt} =f V_{n-2}-\mu V_{n-1} P, $ (3c)
    $ \frac{dN}{dt} = s_N -d_N N - \alpha_N^\phi \sum\limits_{i=0}^{n-1} V_i N, $ (3d)
    $ \frac{dH}{dt} = \alpha_N^\phi \sum\limits_{i=0}^{n-1} V_i N -d_H H - \gamma H B_0, $ (3e)
    $ \frac{dG}{dt} = \gamma H B_0 - d_G G - \eta G \sum\limits_{i=1}^n B_i, $ (3f)
    $ \frac{dB_0}{dt} = -d_0 B_0 - \sigma B_0 H V_0, $ (3g)
    $ \frac{dB_1}{dt} =\alpha \sigma B_0 H V_0 -\sigma V_1 B_1 G -d B_1, $ (3h)
    $ \frac{dB_j}{dt} = \alpha \sigma B_{j-1} G V_{j-1} - \sigma B_j V_j G - d B_j, $ (3i)
    $ \frac{dB_n}{dt} = \alpha \sigma B_{n-1} G V_{n-1} -d B_n - \kappa B_n, $ (3j)
    $ \frac{dP}{dt} = \kappa B_n, $ (3k)

    for $1\leq i\leq n-2$ and $2\leq j\leq n-1$. The initial conditions are $N(0)=s_N/d_N$, $B(0)=B_0$, $V(0)=V_0^\phi$ and all other populations are initially zero.

    We numerically solve model (3), using parameters in Tables 1 and 2, $\alpha_N^\phi=3.6 \times 10^{-6}$ ml per day per cell and $V_0^\phi=10^3$ copies per ml (to account for an HIV-like antigen level). We vary mutation rate, $f$, to determine the effects of fast and slow mutating viruses on the GC's ability to produce broadly neutralizing antibodies and hence clear the virus. We compare the dynamics of $B_t$, $V_t$ and $G$ for $n=8$ rounds of somatic hypermutation and varying mutation rates $f$. We see that fast viral mutation leads to the development of germinal centers containing large $B_t$ populations. Indeed, for $f=0.9$, germinal centers contain $B_t=6.3 \times 10^4$ cells (see Figure 5, panel a, solid black lines). Moreover, fast mutation leads to fast production of clones with the highest degree of somatic hypermutation and consequently to plasma cell production (see Figure 5, panel a, solid grey line). As a result, virus is eliminated in the first two days after challenge (see Figure 5, panel c, solid line). For intermediate mutation rate, $f=0.1$, the germinal center contains $B_t=120$ cells (see Figure 5, panel a, dashed black line), plasma population is small and delayed (see Figure 5, panel a, grey dashed line), and, consequently, virus removal is delayed (see Figure 5, panel c, dashed line). Lastly, for slow mutation, $f=0.01$, the germinal center contains $B_t=55$ cells (see Figure 5, panel a, dotted black line), plasma population is not produced at biological levels (cannot be seen in Figure 5, panel a) and, consequently, virus persists (see Figure 5, panel c, dotted line).

    Figure 5. Comparison of model (3)'s dynamics when $f$ is varied.
    (a) $B_t$ and $P$, (b) $G$ per ml, and (c) $V_t=\sum_{i=0}^{n-1} V_i$ as given by (3) for $n=8$ and $f=0.9$ (solid lines); $f=0.1$ (dashed lines); $f=0.01$ dotted lines. The other parameters are given in Tables 1, 2, $\alpha_N^\phi=3.6 \times 10^{-6}$ and $V_0^\phi=10^3$. Note that $P$ for $f=0.01$ is negligible.

    We look in detail at the slow mutation case. For $f=0.01$, $B_8$, the clone with the highest affinity maturation level, is not produced. That is due to the fact that virus strain $V_7$, which is needed for $B_8$ activation, increases above the limit of detection (of 50 copies per ml) only at 230 days after infection (see Figure 6, panel a, black line). By that time, the germinal center has been terminated (see Figure 6, panel b). This is due to faster clearance of B-cells through natural death compared to B-cell production in the presence of antigenic stimulation, i.e. $d >> \alpha \sigma V_{i-1}G$. Therefore, higher order B-cell clones and, consequently, plasma cells are not produced and virus will persist. This result is independent of the competition between B-cell clones for T follicular helper cell stimulation and is maintained even when $\eta=0$. To produce later B-cell clones, antigen-independent B-cell proliferation is needed. Such proliferation will compensate for B-cell loss. A possible form for the $B_j$ population is:

    Figure 6. Virus strains and B clone dynamics for slow mutating virus.
    (a) $V_i$ per ml, (b) $B_i$ as given by (3) for $n=8$ and $f=0.01$. The other parameters are given in Tables 1, 2, $\alpha_N^\phi=3.6 \times 10^{-6}$ and $V_0^\phi=10^3$.
    $ \frac{dB_j}{dt}=\alpha \sigma B_{j-1} G V_{j-1} - \sigma B_j V_j G +r B_j- d B_j, $ (4)

    where $1\leq j\leq n$ and $r$ is the per capita B-cell growth rate. If the antigen-independent proliferation rate is high enough, i.e. $r=0.75<d$ or $r=0.8=d$ per day, model (3) with adjusted equations (4) predicts plasma cell production for $n=8$ and $f=0.01$ (see Figure 7, panel c, dashed and dotted lines).

    Figure 7. Models (3)-(4)'s dynamics.
    (a) $B_t$, (b) $G$ per ml, and (c) $V_t=\sum_{i=0}^{n-1} V_i$ as given by (3) and (4) for $n=8$, $f=0.01$ and $r=0$ (solid lines); $r=0.75$ (dashed lines); and $r=0.8$ (dotted lines); for $n=50$, $f=0.1$ and $r=0.75$ (dashed-dotted line). The other parameters are given in Tables 1, 2, $\alpha_N^\phi=3.6 \times 10^{-6}$ and $V_0^\phi=10^3$.

    Lastly, when we consider that the number of somatic hypermutations needed to produce plasma cells is $n=50$ (as in HIV patients that produce broadly neutralizing antibody [25,40]), plasma cell production requires both the antigen-independent B-cell proliferation given by (4) and lack of competition between B-cell clones for Tfh cell stimuli, i.e., $\eta=0$, for all $0.1\leq f\leq 0.9$ (see Figure 7, panel c, dashed-dotted line).


    6. Discussion

    We developed a mathematical model of germinal center formation that includes competition between B-cell clones for Tfh cell stimulation. When we model responses to an acute pathogen requiring eight rounds of somatic hypermutations, the model reproduces the dynamics observed during germinal center formation, such as the size of the B-cell population, the time of germinal center termination, and the ratio between pre-Tfh and Tfh populations following antigenic challenge. We fit the model to data, and found that there are enough Tfh cells to allow for B-cell clones of the highest level of somatic hypermutations to emerge.

    We then extended our model to allow for as many as $50$-rounds of somatic hypermutations which are needed to fight chronic infections such as HIV. By expanding the model to chronic infections we aimed to determine the possible mechanisms that regulate or limit germinal center dynamics during persistent disease. Our study predicts that, under the acute $B_t$ and Tfh parameter values, B clones that undergo $50$ rounds of somatic hypermutation cannot emerge, and the germinal center B-cell population is composed of cells that underwent a maximum of $35$-rounds of somatic hypermutations. This is due to loss of specific Tfh cells due to interaction with an increasing number of B-cell clones. This effect can be reversed and B-cell protection can be achieved either through removal of competition between the B-cell clones or through emergence of smaller size clones that mutate at a faster pace.

    When modeling a mutating antigen that drives the rate of B-cell somatic hypermutations, plasma cell production is dependent on the speed of viral mutation. For eight rounds of somatic hypermutations, fast and intermediate mutating plasma cells capable of removing the virus are always produced. A slow mutating virus, however, requires an additional antigen-independent B-cell expansion that maintains enough B-cells inside germinal centers to induce the next round of somatic hypermutation even when the antigenic stimulus is delayed. As in the non-mutating case Tfh are not limiting the emergence of all B-cell clones. For $50$-rounds of somatic hypermutation, however, competition among the B-cell clones for Tfh cell stimuli prevents the emergence of plasma cell production regardless of the speed of virus mutation. In this case, both antigen-independent B-cell proliferation and the removal of competition for Tfh stimuli between the B-cell clones, as in the non-mutating case are needed for plasma cells to emerge.

    Our models assume that the B-cell division rate is exponentially distributed (as in [2]), and disregarded the inherent cell cycle delay shown experimentally and considered in previous modeling studies [24,5,17]. One of the reasons for this assumption is the fact that the $B_0$ population represents primed pre-follicular B-cells, rather than naive B-cells. These cells take less than two days to transition into the $B_1$ class (given our parameters and model assumptions). This is consistent with the observation in [8], which states that the first B-cell division occurred at 48 h. If a delayed model is considered, where the $\alpha \sigma B_{i-1} G$ terms are replaced by $f(t) \alpha \sigma B_{i-1} G$ with

    $f(t)=\left\{0,t<τ,1,tτ,
    \right.$
    (5)

    and $\tau=2$ days as in [8], than the results of model (1) presented in Figures 1, 3 and 4 are preserved with limited change in the parameter values (not shown).

    Our work assumes that B-cells must undergo a strict number of mutations before maturing into plasma cells. We found that modeling the breadth of the response, through creating plasma cells of different affinities at each stage of B-cell somatic hypermutations did not change our results. Further work is needed to determine the tradeoff between the need of high mutation numbers and the breadth of the immune response in fighting chronic infections.

    In summary, we have developed models of Tfh-B-cell interactions to examine the dynamics of germinal centers in both acute and chronic infections. We found that T follicular helper cells are a limiting factor in the emergence of extremely high rounds of B-cell somatic hypermutations for both non-mutating and mutating virus. Moreover, we found that this limitation can be removed by inducing faster transition between clones and limiting the sizes of individual clones. Lastly, for a mutating virus that drives the somatic hypermutations, additional factors such as antigen-independent B-cell proliferation may be needed for plasma cell production and virus neutralization. These results may provide insight into the germinal center role during chronic infections.


    Acknowledgments

    We would like to thank the anonymous reviewers for the valuable comments and suggestions.


    [1] Turner BL, Clark WC, Kates RM, et al. (1993) The Earth as Transformed by Human Action: Global and Regional Changes in the Biosphere over the Past 300 Years. Cambridge University Press.
    [2] Theobald DM (2010) Estimating natural landscape changes from 1992 to 2030 in the conterminous US. Landsc Ecol 25: 999-1011. doi: 10.1007/s10980-010-9484-z
    [3] Lewis DJ, Radeloff VC, Nelson E, et al. (2012) Economic-Based Projections of Future Land-Use Under Alternative Economic Policy Scenarios in the Conterminous US. Ecol Appl 22: 1036-1049. doi: 10.1890/11-0306.1
    [4] U.S. Census Bureau (2013) State and County QuickFacts. U.S. Census Bureau. Available from: http://quickfacts.census.gov/qfd/index.html.
    [5] State of California (2013) State and County Total Population Projections, 2010-2060. State of California, Department of Finance.
    [6] Tanaka SK, Zhu T, Lund JR, et al. (2006) Climate Warming and Water Management Adaptation for California. Clim Change 76: 361-387. doi: 10.1007/s10584-006-9079-5
    [7] Ault TR, Cole JE, Overpeck JT, et al. (2014) Assessing the Risk of Persistent Drought Using Climate Model Simulations and Paleoclimate Data. J Clim 27: 7529-7549. doi: 10.1175/JCLI-D-12-00282.1
    [8] Seabloom EW, Dobson AP, Stoms DM (2002) Extinction rates under nonrandom patterns of habitat loss. Proc Natl Acad Sci U S A 99: 11229-11234. doi: 10.1073/pnas.162064899
    [9] Davies RG, Orme CDL, Olson V, et al. (2006) Human impacts and the global distribution of extinction risk. Proc R Soc B 273: 2127-2133. doi: 10.1098/rspb.2006.3551
    [10] Rittenhouse CD, Pidgeon AM, Albright TP, et al. (2012) Land-Cover Change and Avian Diversity in the Conterminous United States: Land-Cover Change and Avian Diversity. Conserv Biol 26: 821-829. doi: 10.1111/j.1523-1739.2012.01867.x
    [11] Ross Z, English PB, Scalf R, et al. (2006) Nitrogen dioxide prediction in Southern California using land use regression modeling: potential for environmental health analyses. J Expo Sci Environ Epidemiol 16: 106-114. doi: 10.1038/sj.jea.7500442
    [12] Foley JA (2005) Global Consequences of Land Use. Science 309: 570-574. doi: 10.1126/science.1111772
    [13] Houghton RA, Hackler JL (2008) Carbon Flux to the Atmosphere from Land-Use Changes 1850-2005. Carbon Dioxide Information Analysis Center, Oak Ridge National Laboratory, ORNL/CDIAC-131 NDP-050/R1, Oak Ridge, Tennessee.
    [14] Lawrence PJ, Chase TN (2010) Investigating the climate impacts of global land cover change in the community climate system model. Int J Climatol 30: 2066-2087. doi: 10.1002/joc.2061
    [15] Pitman AJ, Avila FB, Abramowitz G, et al. (2011) Importance of background climate in determining impact of land-cover change on regional climate. Nat Clim Change 1: 472-475. doi: 10.1038/nclimate1294
    [16] Dale VH (1997) The relationship between land-use change and climate change. Ecol Appl 7: 753-769. doi: 10.1890/1051-0761(1997)007[0753:TRBLUC]2.0.CO;2
    [17] Sala OE (2000) Global Biodiversity Scenarios for the Year 2100. Science 287: 1770-1774. doi: 10.1126/science.287.5459.1770
    [18] Orang MN, Matyac S, Snyder RL (2008) Survey of Irrigation Methods in California in 2001. J Irrig Drain Eng 134: 96-100. doi: 10.1061/(ASCE)0733-9437(2008)134:1(96)
    [19] U.S. Department of Agriculture (1994) 1992 Census of Agiculture: California, state and county data. U.S. Department of Commerce, Economics and Statistics Administration, Bureau of the Census.
    [20] U.S. Department of Agriculture (1999) 1997 Census of Agiculture: California, state and county data. U.S. Department of Agriculture, National Agricultural Statistics Service.
    [21] U.S. Department of Agriculture (2004) 2002 Census of Agiculture: California, state and county data. U.S. Department of Agriculture, National Agricultural Statistics Service.
    [22] U.S. Department of Agriculture (2009) 2007 Census of Agiculture: California, state and county data. U.S. Department of Agriculture, National Agricultural Statistics Service.
    [23] U.S. Department of Agriculture (2014) 2012 Census of Agiculture: California, state and county data. U.S. Department of Agriculture, National Agricultural Statistics Service.
    [24] Tanaka SK, Zhu T, Lund JR, et al. (2006) Climate Warming and Water Management Adaptation for California. Clim Chang 76: 361-387. doi: 10.1007/s10584-006-9079-5
    [25] Margules CR, Pressey RL (2000) Systematic conservation planning. Nature 405: 243-253. doi: 10.1038/35012251
    [26] Wilson TS, Sleeter BM, Sleeter RR, et al. (2014) Land-Use Threats and Protected Areas: A Scenario-Based, Landscape Level Approach. Land 3: 362-389. doi: 10.3390/land3020362
    [27] Wilson TS, Sleeter BM, Davis AW (2014) Potential future land use threats to California's protected areas. Reg Environ Change 1-14.
    [28] Piekielek NB, Hansen AJ (2012) Extent of fragmentation of coarse-scale habitats in and around U.S. Neational Parks. Biol Conserv 155: 13-22.
    [29] Radeloff VC, Stewart SI, Hawbaker TJ, et al. (2009) Housing growth in and near United States protected areas limits their conservation value. Proc Natl Acad Sci 107:940-945.
    [30] Fleishman E, Blockstein DE, Hall JA, et al. (2011) Top 40 Priorities for Science to Inform US Conservation and Management Policy. BioScience 61: 290-300. doi: 10.1525/bio.2011.61.4.9
    [31] Ricketts T, Imhoff M (2003) Biodiversity, urban areas, and agriculture: locating priority ecoregions for conservation. Conserv Ecol 8: 1-15.
    [32] U.S. Environmental Protection Agency (2013) Level III ecoregions of the continental United States, Digital map. http://www.epa.gov/wed/pages/ecoregions/level_iii_iv.htm.
    [33] Omernik JM (1987) Ecoregions of the conterminous United States. Ann Assoc Am Geograghers 77: 118-125. doi: 10.1111/j.1467-8306.1987.tb00149.x
    [34] Gallant AL, Loveland TR, Sohl TL (2004) Using a geographic framework for analyzing land cover issues. Environ Manage 34: 89-110. doi: 10.1007/s00267-003-0145-3
    [35] Vogelmann JE, Howard SM, Yang L, et al. (2001) Completion of the 1990's national land cover data set for the conterminous United States. Photogramm Eng Remote Sens 61: 650-662.
    [36] Protected Areas Database of the United States (PAD-US) (2012) version 1.3 Combined Feature Class. Available from: http://gapanalysis.usgs.gov/padus/.
    [37] U.S. Department of Agriculture (2010) National Agricultural Statistics Service, 2010 California Cropland Data Layer. Available from: http://www.nass.usda.gov/research/Cropland/metadata/metadata_ca10.htm.
    [38] California Department of Conservation (2014) Farmland Mapping and Monitoring Program. Available from: ftp://ftp.consrv.ca.gov/pub/dlrp/FMMP/.
    [39] Nakicenovic N, Swart R (2000) IPCC Special Report on Emission Scenarios. Cambridge University Press, Cambridge, UK.
    [40] Heistermann M, Müller C, Ronneberger K (2006) Land in sight? Achievements, deficits and potentials of continental to global scale land-use modeling. Agric Ecosyst Environ 114: 141-158.
    [41] Rounsevell MDA, Reginster I, Araújo MB, et al. (2006) A coherent set of future land use change scenarios for Europe. Agric Ecosyst Environ 114: 57-68. doi: 10.1016/j.agee.2005.11.027
    [42] Sleeter BM, Sohl TL, Bouchard MA, et al. (2012) Scenarios of land use and land cover change in the conterminous United States: Utilizing the special report on emission scenarios at ecoregional scales. Glob Environ Change 22: 896-914. doi: 10.1016/j.gloenvcha.2012.03.008
    [43] Sleeter BM, Wilson TS, Soulard CE, et al. (2010) Estimation of late twentieth century land-cover change in California. Environ Monit Assess 173: 251-266.
    [44] Sleeter BM, Sohl TL, Loveland TR, et al. (2013) Land-cover change in the conterminous United States from 1973 to 2000. Glob Environ Change 23: 733-748. doi: 10.1016/j.gloenvcha.2013.03.006
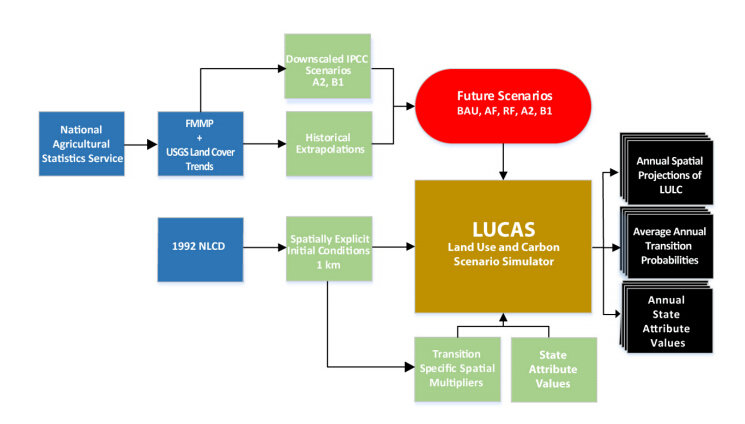
    [45] Daniel CJ, Frid L. ST-Sim - State-and-Transition Simulation Model. Apex Resource Management Solutions. Available from: http://www.apexrms.com/stsm
    [46] Kerns BK, Shlisky AJ, Daniel CJ (2012) Proceedings of the First Landscape State-and-Transition Simulation Modeling Conference, June 14-16, 2011, Portland, Oregon.
    [47] Soil Survey Staff, Natural Resources Conservation Service Web Soil Survey (SSURGO). Available from: http://www.nrcs.usda.gov/wps/portal/nrcs/detail/soils/survey/geo/?cid=nrcs142p2_053627.
    [48] Sleeter RR, Gould M (2007) Geographic Information System Software to Remodel Population Data Using Dasymetric Mapping Methods. U.S. Geological Survey Techniques and Methods 11-C2. Reston, Virginia. Available from: http://pubs.usgs.gov/tm/tm11c2/.
    [49] Sleeter RR, Acevedo C, Soulard CE, et al. (2015) Methods used to parameterize the spatially-explicit components of a state-and-transition simulation model. AIMS Environ Sci [submitted].
    [50] Spencer WD, Beier P, Penrod K, et al. (2010) California Essential Habitat Connectivity Project: A Strategy for Conserving a Connected California. Prepared for California Department of Transportation, California Department of Fish and Game, and Federal Highways Administration. Available from: https://www.wildlife.ca.gov/Conservation/Planning/Connectivity/CEHC.
    [51] Norum K (2011) Agricultural Water Use in California: A 2011 Update. The Center for Irrigation Technology, California State University, Fresno.
    [52] Theobald DM (2003) Targeting Conservation Action through Assessment of Protection and Exurban Threats. Conserv Biol 17: 1624-1637. doi: 10.1111/j.1523-1739.2003.00250.x
    [53] Wade AA, Theobald DM, Laituri MJ (2011) A multi-scale assessment of local and contextual threats to existing and potential U.S. protected areas. Landsc Urban Plan 101: 215-227. doi: 10.1016/j.landurbplan.2011.02.027
  • This article has been cited by:

    1. Samantha Erwin, Lauren M. Childs, Stanca M. Ciupe, Mathematical model of broadly reactive plasma cell production, 2020, 10, 2045-2322, 10.1038/s41598-020-60316-8
    2. Zishuo Yan, Hai Qi, Yueheng Lan, The role of geometric features in a germinal center, 2022, 19, 1551-0018, 8304, 10.3934/mbe.2022387
    3. Komlan Atitey, Benedict Anchang, Mathematical Modeling of Proliferative Immune Response Initiated by Interactions Between Classical Antigen-Presenting Cells Under Joint Antagonistic IL-2 and IL-4 Signaling, 2022, 9, 2296-889X, 10.3389/fmolb.2022.777390
  • Reader Comments
  • © 2015 the Author(s), licensee AIMS Press. This is an open access article distributed under the terms of the Creative Commons Attribution License (http://creativecommons.org/licenses/by/4.0)
通讯作者: 陈斌, bchen63@163.com
  • 1. 

    沈阳化工大学材料科学与工程学院 沈阳 110142

  1. 本站搜索
  2. 百度学术搜索
  3. 万方数据库搜索
  4. CNKI搜索

Metrics

Article views(6792) PDF downloads(1566) Cited by(9)

Article outline

Figures and Tables

Figures(9)  /  Tables(3)

/

DownLoad:  Full-Size Img  PowerPoint
Return
Return

Catalog