Research article Topical Sections

Capacity enhancement and flexible operation of unified power quality conditioner in smart and microgrid network

  • This paper presents a new approach to design Unified Power Quality Conditioner (UPQC), termed as distributed UPQC (D-UPQC), for smart or microgrid network where capacity enhancement and flexible operation of UPQC are the important issues. This paper shows the possibility of capacity enhancement and operational flexibility of UPQC through a coordinated control of existing resources. This UPQC consists of a single unit series active power filter (APFse) and multiple shunt APF (APFsh) units in a distributed (parallel) mode. These units can be connected with a common/separate dc linked capacitor(s). The requirement of capacity enhancement arises from the flexibility to cope up with the increased harmonic load demand at low voltage (LV) distribution network. This can be accomplished by a coordinated control where multiple APFsh units are operated by utilizing the capacity of APFse while it is in idle/low mode using. Operational flexibility can be accomplished by compensating (i) the reactive and harmonic current individually or (ii) splitting the combined reactive and harmonic current/power among the APFsh units. Design and control issues have been discussed to identify the capacity enhancement limit with the possibility of operational flexibility. A system then has been simulated in MATLAB to show the effectiveness of D-UPQC in capacity enhancement and flexible operation by applying its existing resource utilization capability.

    Citation: Shafiuzzaman Khan Khadem, Malabika Basu, Michael F. Conlon. Capacity enhancement and flexible operation of unified power quality conditioner in smart and microgrid network[J]. AIMS Energy, 2018, 6(1): 49-69. doi: 10.3934/energy.2018.1.49

    Related Papers:

    [1] Sphiwe Madiba, Ntaoleng Mohlabane . Attendance of psychosocial teen clubs and self-reported antiretroviral medication adherence: a cross section study of adolescents with perinatal HIV in the Kingdom of Lesotho. AIMS Public Health, 2021, 8(3): 541-552. doi: 10.3934/publichealth.2021044
    [2] Itse Olaoye, Aniebet Ekong, Abiona Samuel, Eirini Kelaiditi, Kyriaki Myrissa, Tsemaye Jacdonmi, Famokun Gboyega . Public beliefs and willingness to accept COVID-19 vaccines among adults in South-Western Nigeria: A cross-sectional study. AIMS Public Health, 2023, 10(1): 1-15. doi: 10.3934/publichealth.2023001
    [3] Pamela Payne Foster, Martina Thomas, Dwight Lewis . Reverse Migration, the Black Church and Sexual Health: Implications for Building HIV/AIDS Prevention Capacity in the Deep South. AIMS Public Health, 2016, 3(2): 242-254. doi: 10.3934/publichealth.2016.2.242
    [4] Carol L. Stone . A population-based measure of chronic disease severity for health planning and evaluation in the United States. AIMS Public Health, 2020, 7(1): 44-65. doi: 10.3934/publichealth.2020006
    [5] Heitham Awadalla, Fateh El-Samani, Mohammed A. Soghaier, Mahgoub Makki . Risk Factors Associated with the Development of Tuberculosis Among HIV-Infected Patients in Khartoum in 2010. AIMS Public Health, 2015, 2(4): 784-792. doi: 10.3934/publichealth.2015.4.784
    [6] Allison DaSantos, Carlisle Goddard, Dalip Ragoobirsingh . Diabetes distress in Barbadian adults with type 2 diabetes. AIMS Public Health, 2022, 9(3): 471-481. doi: 10.3934/publichealth.2022032
    [7] Robert Bagngmen Bio, Patricia Akweongo, Augustine Adomah-Afari, Augustina Koduah . Determinants of tuberculosis treatment support costs to the treatment supporters in rural Ghana. AIMS Public Health, 2023, 10(1): 78-93. doi: 10.3934/publichealth.2023007
    [8] Mathieu Philibert, Mark Daniel . Predictors of Residential Mobility among Older Canadians and Impact on Analyses of Place and Health Relationships. AIMS Public Health, 2015, 2(1): 115-131. doi: 10.3934/publichealth.2015.1.115
    [9] Simone K. Malik, Jerome Kouame, Mory Gbane, Madikiny Coulibaly, Michèle D. Ake, Odile Ake . Prevalence of abdominal obesity and its correlates among adults in a peri-urban population of West Africa. AIMS Public Health, 2019, 6(3): 334-344. doi: 10.3934/publichealth.2019.3.334
    [10] Eduardo Sánchez-Sánchez, Nuria Trujillo-Garrido, Jara Díaz-Jimenez, Alejandro García-García, Miguel A Rosety, Manuel Bandez, Manuel Rosety-Rodriguez, Francisco J Ordonez, Ignacio Rosety, Antonio J Diaz . Attitudes and consumption habits of energy drinks among adolescents and young adults in a Spanish population. AIMS Public Health, 2025, 12(1): 16-32. doi: 10.3934/publichealth.2025002
  • This paper presents a new approach to design Unified Power Quality Conditioner (UPQC), termed as distributed UPQC (D-UPQC), for smart or microgrid network where capacity enhancement and flexible operation of UPQC are the important issues. This paper shows the possibility of capacity enhancement and operational flexibility of UPQC through a coordinated control of existing resources. This UPQC consists of a single unit series active power filter (APFse) and multiple shunt APF (APFsh) units in a distributed (parallel) mode. These units can be connected with a common/separate dc linked capacitor(s). The requirement of capacity enhancement arises from the flexibility to cope up with the increased harmonic load demand at low voltage (LV) distribution network. This can be accomplished by a coordinated control where multiple APFsh units are operated by utilizing the capacity of APFse while it is in idle/low mode using. Operational flexibility can be accomplished by compensating (i) the reactive and harmonic current individually or (ii) splitting the combined reactive and harmonic current/power among the APFsh units. Design and control issues have been discussed to identify the capacity enhancement limit with the possibility of operational flexibility. A system then has been simulated in MATLAB to show the effectiveness of D-UPQC in capacity enhancement and flexible operation by applying its existing resource utilization capability.


    The HIV epidemic continues to pose a challenge to both public health and socioeconomic well-being [1]. Antiretroviral medication was available to 28.2 million patients in 2021. There were 37.7 million persons living with HIV in the world in 2020, of which 36 million were adults [2],[3]. AIDS has been identified as one of the leading causes of mortality among adults in sub-Saharan Africa [4]. According to a published report [3], the year 2020 witnessed 150,000 fatalities attributed to AIDS, while 3.5 million individuals sought medical intervention.

    The World Health Organization defines viral suppression as viral load (VL) less than 1000 copies/ml and virological failure less than 1000 copies/ml [5],[6]. Viral failure or non-suppression is a consistently detectable viremia of more than 1000 copies/ml after a minimum of 6 months of antiretroviral therapy [6],[7]. To identify viral replication and confirm treatment failure, the World Health Organization recommends that people receiving antiretroviral therapy have their VL checked every six (6) months if possible [6],[8],[9].

    Attaining a target of 90% of patients receiving antiretroviral therapy and achieving viral suppression was among the key goals of the United Nations Program on HIV/AIDS (UNAIDS) 90:90:90 initiative, which was slated to be accomplished by the year 2020 [10],[11]. However, this objective was not achieved due to the consequences of COVID-19, and the new global objectives are 95–95–95 by 2030 [12]. Globally, 47% of people living with HIV are virally suppressed, while the remaining 53% are not [10].

    Ghana has an HIV population of 346,120 people as of 2020, with 19,267 new infections and 11,797 AIDS-related deaths [13]. HIV prevalence is 1.7% in the general population [13],[14]. Of the 346,120, 34% are male, 66% are female, and 245,223 were currently on treatment as of December 2021 [13]. To guarantee optimal viral load suppression, facilitate immunological reconstitution, limit HIV drug resistance development, avoid HIV-related mortality, and prevent treatment-resistant HIV variant transmission, patients with HIV need frequent HIV care and medication availability [15][17]. According to the 2020 estimate report, 25,620 people lived with HIV in the western region of Ghana. This represents 7.37% of the country's HIV population, and 18,930 people were on treatment in December 2021 [18].

    Notwithstanding the increasing accessibility of free antiretroviral medication, several hindrances constrain the achievement of viral suppression. As per Ghana's 90–90–90 goal, the proportion of individuals who were aware of their HIV-positive status in 2020 was 64%, while 96% received antiretroviral therapy, and 73% achieved viral suppression [18]. Nonetheless, it is worth noting that there exists a dearth of reliable information pertaining to adults who are living with HIV and are either virally suppressed or not suppressed [19]. Furthermore, only a limited number of studies have been conducted to identify the predictors of non-viral suppression among adults residing in Ghana. The existence of research and data gap rendered it imperative to study and determine the prevalence rate of viral suppression and the factors associated with non-viral suppression.

    A cross-sectional study was conducted at the Sekondi Public Health Laboratory (SPHL) from March 2020 to February 2021. This is the only testing laboratory in Ghana where viral load testing is done for the western and some parts of the western north regions. Each HIV-positive person who had been on antiretroviral therapy for at least six months and had sent blood samples to SPHL for VL testing between November 2019 and October 2020 was used as a data source. The study was done using records of 7199 patients.

    Ethical clearance and approval for this study were obtained from Kwame Nkrumah University of Science and Technology, College of Health Sciences, School of Medicine and Dentistry, Human Research, Publication, and Ethics Committee (CHRPE). The reference number for the approval was CHRPE/AP/429/21. The entirety of the data provided by the study site was anonymous.

    Patients who were on treatment for at least six months.

    Repeated test results were excluded, and only recent VL test results were included for each patient. Patients under 15 years of age were excluded from the research.

    The data in the SPHL database were checked, and any samples collected from other regions were removed before analyzing the data. Finally, the study provided all the data that met the eligibility requirements (Figure 1).

    Figure 1.  Schematic diagram of sampling procedures.

    The HIV viral load data were retrieved from the SPHL database following a data extraction form. The following variables were included in the form: specimen identification (facility name, district), patient information (age, sex, pregnancy status, date of ART initiation, ARV adherence, and current regimen, and) indication for viral load testing (routine monitoring, viral load testing for repeat after detectable viremia and 3 to 6 months of enhanced adherence counseling and suspected treatment failure), and laboratory information (results). The viral load result was the dependent variable, part of the data extraction form. Before exporting to STATA 16.1, all data in the database were transferred to Microsoft Excel, and data verification and filtration were applied.

    In Microsoft Excel, the completeness and accuracy of the data were verified. The normality of the data set was confirmed using histogram plots and normal probability distributions. Controls were carried out before testing viral load samples at the SPHL.

    The statistical analysis was conducted utilizing STATA 16.1. The classification of the result component of viral suppression status was based on the categorization of low- and middle-income countries by the World Health Organization. We measured the viral load (VL) test results in patients who had been on ART for at least six months. If the VL was less than or equal to 1000 copies/ml, it was considered viral non-suppression, while less than 1000 copies/ml was regarded as viral suppression. Adherence to medication was assessed through self-report, with good adherence defined as greater than or equal to 95%, fair adherence as between 85–94%, and poor adherence as less than 85% [5],[6],[20],[21]. The response variable was dichotomous, with a value of 1 indicating viral load not suppressed and a value of 0 indicating viral load suppressed. The study incorporated the following explanatory variables: age group, sex, facility type, facility ownership, district, pregnancy status, breastfeeding status, regimen, ARV adherence level, duration of treatment before viral load testing, and indication for viral load testing.

    We used logistic regression to determine the relationship between the factors that affect viral load suppression. This statistical measure was expressed as an odds ratio (OR) with a 95% confidence interval. First, we conducted a bivariate analysis to assess the association between the independent and dependent variables. In the second step, we employed multivariable analysis, incorporating all variables into a single model. Finally, we included all significant variables at a P-value of ≤ 0.05 in the multivariable analysis into the final model. Our study utilized multivariable logistic regression to identify the factors independently associated with viral non-suppression.

    The research included a total of 7199 people. The median age of the research participants (IQR-interquartile range) was 43 (35–52) years. A suppression in viral load was observed in 5465 (75.91%) of the total research participants who received antiretroviral therapy. However, 1734 people (24.09%) did not achieve viral suppression.

    Table 1.  Characteristics of the Participants by Viral Load Suppression Status.
    Variables N (%) Suppressed n (%) Non-Suppressed n (%)
    Age Category
    15–19 101 (1.40) 65 (1.19) 36 (2.08)
    20–24 190 (2.64) 150 (2.74) 40 (2.31)
    25–29 502 (6.97) 384 (7.03) 118 (6.81)
    30–34 831 (11.54) 619 (11.33) 212 (12.23)
    35–39 1159 (16.10) 873 (15.97) 286 (16.49)
    40–44 1158 (16.09) 881 (16.12) 277 (15.97)
    45–50 1205 (16.74) 928 (16.98) 277 (15.97)
    >50 2053 (28.52) 1565 (28.64) 488 (28.14)
    Gender
    Female 3690 (76.46) 2814 (76.97) 876 (74.87)
    Male 1136 (23.54) 842 (23.03) 294 (25.13)
    Facility Type
    Clinic 131 (1.82) 96 (1.76) 35 (2.02)
    District Hospital 4282 (59.48) 3067 (56.12) 1215 (70.07)
    Health Centre 656 (9.11) 458 (8.38) 198 (11.42)
    Hospital 279 (3.88) 225 (4.12) 54 (3.11)
    Regional Hospital 1851 (25.71) 1619 (29.62) 232 (13.38)
    Facility Ownership
    CHAG 1202 (16.70) 829 (15.17) 373 (21.51)
    Government 5773 (80.19) 4450 (81.43) 1323 (76.30)
    Private 49 (0.68) 45 (0.82) 4 (0.23)
    Quasi-Government 175 (2.43) 141 (2.58) 34 (1.96)
    District
    Ahanta West 361 (5.01) 246 (4.50) 115 (6.63)
    Ellembelle 885 (12.29) 651 (11.91) 234 (13.49)
    Jomoro 460 (6.39) 359 (6.57) 101 (5.82)
    Mpohor 5 (0.07) 5 (0.09) 0 (0.00)
    Nzema East 263 (3.65) 167 (3.06) 96 (5.54)
    Prestia Huni Valley 220 (3.06) 143 (2.62) 77 (4.44)
    Sekondi-Takoradi 2954 (41.03) 2501 (45.76) 453 (26.12)
    Shama 303 (4.21) 180 (3.29) 123 (7.09)
    Tarkwa-Nsuaem 1052 (14.61) 716 (13.10) 336 (19.38)
    Wassa Amenfi Central 6 (0.08) 3 (0.05) 3 (0.17)
    Wassa Amenfi East 308 (4.28) 240 (4.39) 68 (3.92)
    Wassa Amenfi West 331(4.60) 218 (3.99) 113 (6.52)
    Wassa East 51(0.71) 36 (0.66) 15 (0.87)
    Pregnancy Status
    No 1240(95.61) 879 (95.65) 361 (95.50)
    Yes 57 (4.39) 40 (4.35) 17 (4.50)
    Breastfeeding Status
    No 1327 (93.98) 944 (93.47) 383 (95.27)
    Yes 85 (6.02) 66 (6.53) 19 (4.73)
    Current Regimen
    DTG-based 2 (0.13) 2 (0.18) 0 (0.00)
    D4T-based 6 (0.38) 4 (0.36) 2 (0.43
    ABC-based 16 (1.01) 7 (0.63) 9 (1.92)
    AZT-based 59 (3.72) 27 (2.42) 32 (6.84)
    TDF-based 1503 (94.77) 1078 (96.42) 425 (90.81)
    ARV Adherence Level
    Good 69 (4.18) 34 (2.97) 35 (6.93)
    Poor 804 (47.09) 523 (45.68) 281 (55.64)
    Fair 777 (48.73) 588 (51.35) 189 (37.43)
    Duration on ART
    6–10 years 318 (18.49) 222 (18.32) 96 (18.90)
    3–5 years 459 (26.69) 313 (25.83) 146 (28.74)
    6 months–2 years 943 (54.83) 677 (55.86) 266 (52.36)
    Indication for VL Testing
    Routinea 1972 (94.99) 1,422 (95.82) 550 (92.91)
    Treatment failureb 10 (0.48) 5 (0.34) 5 (0.84)
    Repeatc 94 (4.53) 57 (3.84) 37 (6.25)

    *Note: aRoutine Monitoring; bSuspected treatment failure; cRepeat viral load test after detectable viremia and 3–6 months of enhanced adherence counseling.

    Abbreviations: CHAG = Christian Health Association of Ghana; ABC = Abacavir; AZT = Azidothymidine; TDF = Tenofovir Disoproxil Fumarate; DTG = Dolutegravir; D4T = Stavudine.

     | Show Table
    DownLoad: CSV

    The bivariate analysis revealed a significant association between viral non-suppression and age category, regional hospital, facility ownership, Ellembelle, Jomoro, Sekondi-Takoradi, Shama and Wassa Amenfi East District, ABC, and AZT-based regimen, ARV adherence level and repeat viral load test.

    However, in the final model, patients with poor adherence to ARV (AOR 0.30; 95% CI 0.16, 0.58), patients with fair adherence to ARV (AOR 0.23; 95% CI 0.12, 0.45) were associated with a lower chance of viral non-suppression. Patients with 6 months to 2 years of duration of treatment before viral load testing (AOR 0.67; 95% CI 0.46, 0.98) were also associated with a lower probability of non-suppression of the virus (Table 2).

    Table 2.  Predictors of Viral Non-Suppression among Adults Living with HIV.
    Characteristic OR (95% CI) p-value AOR (95% CI) p-value
    Facility Type
    Clinic 1 1
    District Hospital 1.08(0.73, 1.61) 0.678 1.46(0.60, 3.51) 0.402
    Health Centre 1.18(0.78, 1.81) 0.428 1.67(0.67, 4.16) 0.274
    Hospital 0.65(0.40, 1.07) 0.093 0.82(0.28, 2.44) 0.723
    Regional Hospital 0.39(0.26, 0.59) <0.001 0.44(0.17, 1.45) 0.093
    ARV Adherence Level
    Good 1 1
    Fair 0.52(0.32, 0.86) 0.010 0.23(0.12, 0.45) <0.001
    Poor 0.31(0.19, 0.51) <0.001 0.30(0.16, 0.58) <0.001
    Duration on ART
    6–10 years 1 1
    3–5 years 1.07(0.79, 1.47) 0.632 0.85(0.57, 1.27) 0.436
    6 months–2 years 0.91(0.69, 1.20) 0.500 0.67(0.46, 0.98) 0.038
    Indication for VL Testing
    Routine 1 1
    Treatment failure 2.59(0.75, 8.97) 0.134 2.11(0.13, 33.90) 0.599
    Repeat 1.68(1.10, 2.57) 0.017 1.18(0.72, 1.96) 0.511

     | Show Table
    DownLoad: CSV

    The results reveal that 5465 individuals (75.91%) had viral suppression. Compared to the goal of the United Nations AIDS of 95% viral suppression, the proportion of viral suppression in this research is low [22][24]. It emerged from the analysis that viral non-suppression was 0.30 times more common in patients with poor adherence to antiretroviral treatment than in patients with good adherence (adjusted odds ratio [AOR] = 0.30, 95% confidence interval [CI]: 0.16, 0.58). Patients who had a fair adherence to their ARV treatment had a lower odd of viral non-suppression (adjusted odds ratio [AOR] of 0.23; 95 percent confidence interval [CI]: 0.12, 0.45). It was also observed that patients with six (6) months to two (2) years of duration on treatment before viral load testing were 0.67 times (odds ratio 0.67; 95% confidence interval (0.46, 0.98) likely to have viral non-suppression than those with six (6) to ten (10) years of duration on treatment. This study appears to be the first to find the factors associated with viral non-suppression among adult HIV-positive patients in the Western region.

    These proportions of non-suppression among pregnant and breastfeeding women align with those obtained in a study in the Democratic Republic of the Congo [25]. The findings of this study suggest an even greater need to improve the quality of care for pregnant and breastfeeding women in Ghana. The male non-suppression rate of 25.13% is in line with those of [26][28], who found that males were more likely than females to be virally non-suppressed. Compared to research conducted in Ghana, the Ashanti region, in three ART clinics, the overall percentage of non-suppression was nearly the same as that found in this study [21]. Another study in Ethiopia discovered almost the same proportion of non-suppression [15]. Another research carried out in Ghana found that viral load non-suppression was very high [9]. The findings on the association between sex and viral load suppression status confirm those of earlier studies [21],[29][31] where there was no association between sex and viral load success or failure, just as this study did not find any association. Several other studies have also shown that low adherence to therapy is associated with long-term virological treatment failure [32][36]. This association is because when the concentration of medications in the blood decreases, HIV RNAs may not be suppressed, leading to an increase in the patient's viral load [15].

    Additionally, it has been confirmed that people who remain on treatment and take their antiretroviral therapy have suppressed viral load [16]. However, a high VL indicates poor adherence to the medication [37],[38]. The results of the six (6) months to two (2) years duration of treatment before viral load testing are consistent with studies by [35],[39].

    In contrast to the findings of [36],[40], this study did not find any association between age category and viral non-suppression. However, the age category was significant in the bivariate analysis. These results do not align with those of [36],[40], who found that the ART regimen was associated with viral non-suppression. Contrary to what has been reported by [21],[36], these results indicate no association between viral non-suppression and sex. Although [36] found that facility type has a significant association with viral non-suppression, this study's results suggest no association between facility type and viral non-suppression.

    Although the study has its benefits, there are also some drawbacks to consider. The use of a single test result in the viral load study may not accurately show treatment failure. Additionally, the study did not take into account factors such as comorbidities, co-infections, educational level, treatment lines among HIV-positive individuals, and the potential for viral load testing to improve adherence. These limitations are important to remember when interpreting the study's results.

    In summary, the research findings indicate a high rate of virological failure, with a suppression rate that falls below the 90% target set by UNAIDS. Possible obstacles to achieving viral load suppression were identified as inadequate adherence to antiretroviral (ARV) medication and a treatment duration ranging from 6 months to 2 years before viral load testing. The research findings appear to suggest that viral load testing supports viral non-suppression. Therefore, using viral load tests to monitor medication's effects on health can motivate people to adhere to their prescribed medication regimen. However, the research did not comprehensively clarify the factors that impact adherence. Additional research is required to investigate this topic more thoroughly and examine the potential of viral load testing to improve adherence. Furthermore, the study underscores the importance of determining the pattern of antiretroviral resistance in light of the substantial proportion of patients who did not achieve virologic suppression.

    [1] Seme S, Lukač N, Štumberger B, et al. (2017) Power quality experimental analysis of grid-connected photovoltaic systems in urban distribution networks. Energy 139: 1261–1266. doi: 10.1016/j.energy.2017.05.088
    [2] Efkarpidis N, Rybel TD, Driesen J (2016) Technical assessment of centralized and localized voltage control strategies in low voltage networks. Sust Energ Grids Netw 8: 85–97. doi: 10.1016/j.segan.2016.09.003
    [3] Khadem SK, Basu M, Conlon MF (2010) Power quality in grid connected renewable energy systems: Role of custom power devices. J Renew Energ Power Qual 8: 505.
    [4] Ghosh A, Ledwich G (2002) Power quality enhancement using custom power devices. AH Dordrecht: Kluwer Academic Publisher Group.
    [5] Khadkikar V (2012) Enhancing electric power quality using UPQC: A comprehensive overview. IEEE T Power Electr 27: 2284–2297. doi: 10.1109/TPEL.2011.2172001
    [6] Han B, Bae B, Kim H, et al. (2006) Combined operation of unified power-quality conditioner with distributed generation. IEEE T Power Deliver 21: 330–338. doi: 10.1109/TPWRD.2005.852843
    [7] Khadem SK, Basu M, Conlon MF (2015) Intelligent islanding and seamless reconnection technique for microgrid with UPQC. IEEE J Em Sel Top P 3: 483–492. doi: 10.1109/JESTPE.2014.2326983
    [8] Khadem SK, Basu M, Conlon MF (2013) A new placement and integration method of UPQC to improve the power quality in DG network. Power Engineering Conference. IEEE, 1–6.
    [9] Khadem SK, Basu M, Conlon MF (2011) A review of parallel operation of active power filters in the distributed generation system. Renew Sust Energ Rev 15: 5155–5168. doi: 10.1016/j.rser.2011.06.011
    [10] 
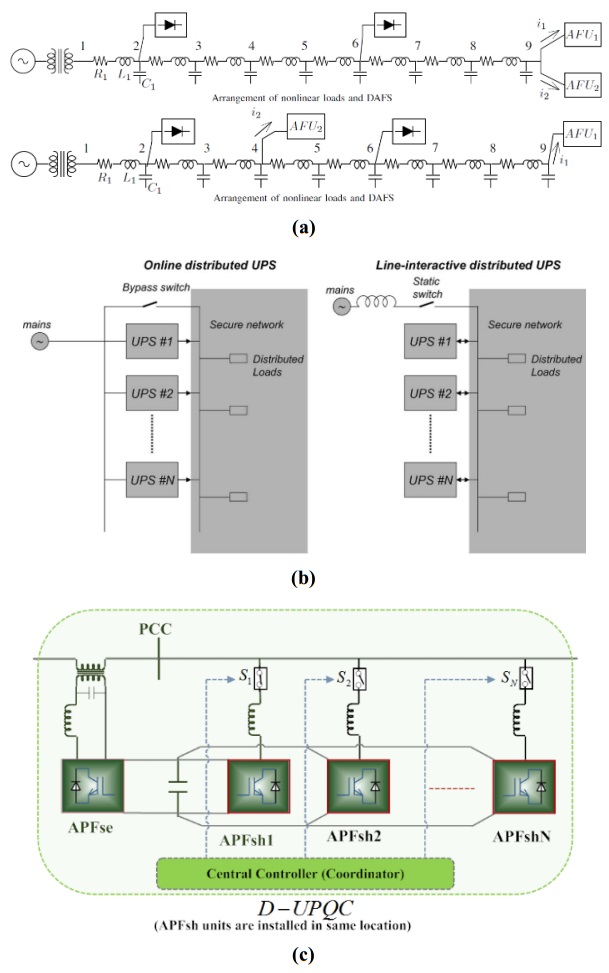
Cheng PT, Lee TL (2006) Distributed active filter systems (DAFSs): A new approach to power system harmonics. IEEE T Ind Appl 42: 1301–1309. doi: 10.1109/TIA.2006.880856
    [11] Guerrero JM, Hang L, Uceda J (2008) Control of distributed uninterruptible power supply systems. IEEE T Ind Electron 55: 2845–2859. doi: 10.1109/TIE.2008.924173
    [12] Lai J, Peng FZ (1996) Multilevel converters-a new breed of power converters. IEEE T Ind Appl 32: 509–517. doi: 10.1109/28.502161
    [13] Munoz JA, Espinoza JR, Moran LA, et al. (2009) Design of a modular UPQC configuration integrating a components economical analysis. IEEE T Power Deliver 24: 1763–1772. doi: 10.1109/TPWRD.2009.2028795
    [14] Peng FZ, Mckeever JW, Adams DJ (1998) A power line conditioner using cascade multilevel inverters for distribution systems. IEEE T Ind Appl 34: 1293–1298. doi: 10.1109/28.739012
    [15] Han B, Bae B, Baek S, et al. (2006) New configuration of UPQC for medium-voltage application. IEEE T Power Deliver 21: 1438–1444. doi: 10.1109/TPWRD.2005.860235
    [16] Han B, Baek S, Kim H, et al. (2006) Dynamic characteristic analysis of SSSC based on multibridge inverter. IEEE Power Eng Rev 22: 62–63.
    [17] Han BM, Mattavelli P (2003) Operation analysis of novel UPFC based on 3-level half-bridge modules. IEEE Power Tech Conference Proceedings, Bologna. IEEE 4: 307–312. doi: 10.1109/PTC.2003.1304740
    [18] Munoz JA, Espinoza JR, Baier CR, et al. (2011) Design of a discrete-time linear control strategy for a multi-cell UPQC. IEEE T Ind Electron 59: 3797–3807.
    [19] Khadem MSK, Basu M, Conlon MF (2012) UPQC for power quality improvement in dg integrated smart grid network-a review. Int J Emerg Electr Power Syst 13: 3.
    [20] Basu M, Das SP, Dubey GK (2008) Investigation on the performance of UPQC-Q for voltage sag mitigation and power quality improvement at a critical load point. IET Gener Transm Dis 2: 414–423. doi: 10.1049/iet-gtd:20060317
    [21] Khadem S, Basu M, Conlon M (2014) Harmonic power compensation capacity of shunt apf and its relationship to design parameters. IET Power Electron 7: 418–430. doi: 10.1049/iet-pel.2013.0098
    [22] Corradini L, Mattavelli P, Corradin M, et al. (2010) Analysis of parallel operation of uninterruptible power supplies loaded through long wiring cables. IEEE T Power Electr 25: 1046–1054. doi: 10.1109/TPEL.2009.2031178
    [23] Guerrero JM, Matas J, Castilla M, et al. (2006) Wireless-control strategy for parallel operation of distributed-generation inverters. IEEE T Ind Electron 53: 1461–1470. doi: 10.1109/TIE.2006.882015
    [24] Khadem SK, Basu M, Conlon MF (2011) A review of parallel operation of active power filters in the distributed generation system. European Conference on Power Electronics and Applications. IEEE, 1–10.
    [25] Arrillaga J, Liu YH, Watson NR (2007) Self-commutating conversion, in flexible power transmission: The HVDC options. John Wiley & Sons, Ltd, Chichester, UK.
    [26] Khadem SK, Basu M, Conlon MF (2013) Selection of design parameters to reduce the zero-sequence circulating current flow in parallel operation of DC linked multiple shunt APF units. Adv Power Electron 2013: 13.
    [27] Asiminoaei L, Aeloiza E, Enjeti PN, et al. (2008) Shunt active-power-filter topology based on parallel interleaved inverters. IEEE T Ind Electron 55: 1175–1189. doi: 10.1109/TIE.2007.907671
    [28] Chen TP (2012) Zero-sequence circulating current reduction method for parallel HEPWM inverters between AC bus and DC bus. IEEE T Ind Electron 59: 290–300. doi: 10.1109/TIE.2011.2106102
    [29] Ye Z, Boroyevich D, Choi JY, et al. (2006) Control of circulating current in parallel three-phase boost rectifiers. Applied Power Electronics Conference and Exposition, 2000. IEEE 1: 506–512.
    [30] Chen TP (2006) Circulating zero-sequence current control of parallel three-phase inverters. IEE P-Elect Pow Appl 153: 282–288. doi: 10.1049/ip-epa:20050231
    [31] Abdelli Y, Machmoum M, Khoor MS (2004) Control of a multi module parallel able three phase active power filters. International Conference on Harmonics and Quality of Power. IEEE, 543–548.
    [32] Wei X, Dai K, Fang X, et al. (2006) Parallel control of three-phase three-wire shunt active power filters. Automat Electr Power Syst 31: 70–74.
  • This article has been cited by:

    1. Rudi Wisaksana, Yovita Hartantri, Elisabeth Hutajulu, Risk Factors Associated with Unsuppressed Viral Load in People Living with HIV Receiving Antiretroviral Treatment in Jawa Barat, Indonesia, 2024, Volume 16, 1179-1373, 1, 10.2147/HIV.S407681
    2. Mobolaji Modinat Salawu, Yusuff Akinkunmi Olasunkanmi, Omowumi Omolola Okedare, Gloria Bosede Imhonopi, Clinical predictors and correlates of viral suppression among adults accessing care at the HIV clinic in federal medical center, Abeokuta, Ogun state, Nigeria: a retrospective cohort study, 2024, 24, 1471-2334, 10.1186/s12879-024-10237-y
    3. Sekyibea Nana Ama Appiedu-Addo, Mark Appeaning, Edwin Magomere, Gloria Akosua Ansa, Evelyn Yayra Bonney, Peter Kojo Quashie, The urgent need for newer drugs in routine HIV treatment in Africa: the case of Ghana, 2025, 5, 2674-1199, 10.3389/fepid.2025.1523109
  • Reader Comments
  • © 2018 the Author(s), licensee AIMS Press. This is an open access article distributed under the terms of the Creative Commons Attribution License (http://creativecommons.org/licenses/by/4.0)
通讯作者: 陈斌, bchen63@163.com
  • 1. 

    沈阳化工大学材料科学与工程学院 沈阳 110142

  1. 本站搜索
  2. 百度学术搜索
  3. 万方数据库搜索
  4. CNKI搜索

Metrics

Article views(5958) PDF downloads(1034) Cited by(6)

Figures and Tables

Figures(10)  /  Tables(3)

/

DownLoad:  Full-Size Img  PowerPoint
Return
Return

Catalog