Recently, researchers have proposed a lot of methods to boost the performance of convolutional neural networks (CNNs) for classifying remote sensing images (RSI). However, the methods' performance improvements were insignificant, while time and hardware costs increased dramatically due to re-modeling. To tackle this problem, this study sought a simple, lightweight, yet more accurate solution for RSI semantic classification (RSI-SC). At first, we proposed a set of mathematical derivations to analyze and identify the best way among different technical roadmaps. Afterward, we selected a simple route that can significantly boost a single CNN's performance while maintaining simplicity and reducing costs in time and hardware. The proposed method, called RE-EfficientNet, only consists of a lightweight EfficientNet-B3 and a concise training algorithm named RE-CNN. The novelty of RE-EfficientNet and RE-CNN includes the following: First, EfficientNet-B3 employs transfer learning from ImageNet-1K and excludes any complicated re-modeling. It can adequately utilize the easily accessible pre-trained weights for time savings and avoid the pre-training effect being weakened due to re-modeling. Second, RE-CNN includes an effective combination of data augmentation (DA) transformations and two modified training tricks (TTs). It can alleviate the data distribution shift from DA-processed training sets and make the TTs more effective through modification according to the inherent nature of RSI. Extensive experimental results on two RSI sets prove that RE-EfficientNet can surpass all 30 cutting-edge methods published before 2023. It gives a remarkable improvement of 0.50% to 0.75% in overall accuracy (OA) and a 75% or more reduction in parameters. The ablation experiment also reveals that RE-CNN can improve CNN OA by 0.55% to 1.10%. All the results indicate that RE-EfficientNet is a simple, lightweight and more accurate solution for RSI-SC. In addition, we argue that the ideas proposed in this work about how to choose an appropriate model and training algorithm can help us find more efficient approaches in the future.
Citation: Huaxiang Song, Yong Zhou. Simple is best: A single-CNN method for classifying remote sensing images[J]. Networks and Heterogeneous Media, 2023, 18(4): 1600-1629. doi: 10.3934/nhm.2023070
[1] | Raili Kajaste, Markku Hurme, Pekka Oinas . Methanol-Managing greenhouse gas emissions in the production chain by optimizing the resource base. AIMS Energy, 2018, 6(6): 1074-1102. doi: 10.3934/energy.2018.6.1074 |
[2] | Zubairu Ismaila, Olugbenga A. Falode, Chukwuemeka J. Diji, Omolayo M. Ikumapayi, Adetokunbo A. Awonusi, Sunday A. Afolalu, Esther T. Akinlabi . A global overview of renewable energy strategies. AIMS Energy, 2022, 10(4): 718-775. doi: 10.3934/energy.2022034 |
[3] | Muhammad Amir Raza, M. M. Aman, Abdul Ghani Abro, Muhammad Shahid, Darakhshan Ara, Tufail Ahmed Waseer, Mohsin Ali Tunio, Nadeem Ahmed Tunio, Shakir Ali Soomro, Touqeer Ahmed Jumani . The role of techno-economic factors for net zero carbon emissions in Pakistan. AIMS Energy, 2023, 11(2): 239-255. doi: 10.3934/energy.2023013 |
[4] | John G Rogers . Paper making in a low carbon economy. AIMS Energy, 2018, 6(1): 187-202. doi: 10.3934/energy.2018.1.187 |
[5] | Ladislas Mutunda Kangaji, Atanda Raji, Efe Orumwense . Cutting-edge progress in offshore wind and tidal stream power technology—State-of-the-Art. AIMS Energy, 2025, 13(1): 188-230. doi: 10.3934/energy.2025007 |
[6] | Jialin Song, Haoyi Zhang, Yanming Zhang, Zhongjiao Ma, Mingfei He . Research progress on industrial waste heat recycling and seasonal energy storage. AIMS Energy, 2025, 13(1): 147-187. doi: 10.3934/energy.2025006 |
[7] | Jonathan B. Norman, Marcelle McManus . The techno-economic viability of bio-synthetic natural gas production utilising willow grown on contaminated land. AIMS Energy, 2019, 7(3): 285-312. doi: 10.3934/energy.2019.3.285 |
[8] | Austin Bushur, Kevin Ward, Tommy Flahaven, Tom Kelly, Jin H. Jo, Matt Aldeman . Techno-economic evaluation of installing EV and PV combined infrastructure on Academic Institution’s Parking Garages in Illinois, USA. AIMS Energy, 2019, 7(1): 31-45. doi: 10.3934/energy.2019.1.31 |
[9] | Gustavo Aguilar, Pranjali D. Muley, Charles Henkel, Dorin Boldor . Effects of biomass particle size on yield and composition of pyrolysis bio-oil derived from Chinese tallow tree (Triadica Sebifera L.) and energy cane (Saccharum complex) in an inductively heated reactor. AIMS Energy, 2015, 3(4): 838-850. doi: 10.3934/energy.2015.4.838 |
[10] | Gul Ahmad Ludin, Mohammad Amin Amin, Assadullah Aminzay, Tomonobu Senjyu . Theoretical potential and utilization of renewable energy in Afghanistan. AIMS Energy, 2017, 5(1): 1-19. doi: 10.3934/energy.2017.1.1 |
Recently, researchers have proposed a lot of methods to boost the performance of convolutional neural networks (CNNs) for classifying remote sensing images (RSI). However, the methods' performance improvements were insignificant, while time and hardware costs increased dramatically due to re-modeling. To tackle this problem, this study sought a simple, lightweight, yet more accurate solution for RSI semantic classification (RSI-SC). At first, we proposed a set of mathematical derivations to analyze and identify the best way among different technical roadmaps. Afterward, we selected a simple route that can significantly boost a single CNN's performance while maintaining simplicity and reducing costs in time and hardware. The proposed method, called RE-EfficientNet, only consists of a lightweight EfficientNet-B3 and a concise training algorithm named RE-CNN. The novelty of RE-EfficientNet and RE-CNN includes the following: First, EfficientNet-B3 employs transfer learning from ImageNet-1K and excludes any complicated re-modeling. It can adequately utilize the easily accessible pre-trained weights for time savings and avoid the pre-training effect being weakened due to re-modeling. Second, RE-CNN includes an effective combination of data augmentation (DA) transformations and two modified training tricks (TTs). It can alleviate the data distribution shift from DA-processed training sets and make the TTs more effective through modification according to the inherent nature of RSI. Extensive experimental results on two RSI sets prove that RE-EfficientNet can surpass all 30 cutting-edge methods published before 2023. It gives a remarkable improvement of 0.50% to 0.75% in overall accuracy (OA) and a 75% or more reduction in parameters. The ablation experiment also reveals that RE-CNN can improve CNN OA by 0.55% to 1.10%. All the results indicate that RE-EfficientNet is a simple, lightweight and more accurate solution for RSI-SC. In addition, we argue that the ideas proposed in this work about how to choose an appropriate model and training algorithm can help us find more efficient approaches in the future.
It has been estimated that the global middle class will rise from 1.8 billion in 2009 to 4.9 billion in 2030 [1]. Assuming that they will aspire to a western consumerist lifestyle this will result in a proportional rise in the demand for goods and services needing industrial products. This will have a severe impact on the demand for primary materials (steel, aluminum, plastics, cement etc.) and the industrial energy required to make them into finished goods. At the same time there is a general consensus that something needs to be done to reduce global greenhouse gas emissions (GHG) [2]. The International Energy Agency (IEA) estimate that to avoid damaging climate change GHG, emissions will need to be lowered by 50% from today’s level by 2050. Some sectors of the global economy are easier to decarbonise than others. It is recognized that industrial production is hard to decarbonise and this is reflected in the IEA’s de-carbonisation target, a 23% reduction for this sector [3].
It is hard to see how these two aspirations, for increased demand in goods and services and for adequate reduction in GHG emissions, can be reconciled with current business practices. This paper estimates the extent of the problem and demonstrates the insufficiency of production-side measures alone to meet them, introduces techniques that can help ameliorate it through improving product utilisation and reports on the finding of a workshop that discussed opportunities, drivers and barriers to changing business practices so that they can prosper in a world where there are limits to expansion.
E total global greenhouse gas emissions from global industry.
N is the number of a hypotheticaltypical goods that the manufacture of would produce the same global environmental impact as global industry.
C is the GHG emissions associated with typical goods so E=NC
U is utilisation, a multi-dimensional measure of how much use is made of a particular good.
S is a multi-dimensional measure of the global demand for the service provided by goods so S=NU
The followingsuffixes are used:
D for direct emissions
P for emissions associated with primary material production
M for emissions associated with the manufacturing, distribution and retailing of goods
I for indirect emissions
Numerical suffixes represent years
Industrial emissions are made up of direct emissions (ED) that are emitted from the industrial plants themselves and indirect emissions (EI) which are those associated with providing energy for industrial process and transporting materials and fuel to production facilities. The IEA estimate that 56% of direct industrial GHG emissions come from the production of primary materials that are used to make other goods. Manufacturing processes account for the remaining emissions [3]. Indirect emissions account for 31% of all industrial emissions. The principle source of indirect emissions is electricity generation. Electricity generation and transport are subject to different emission targets from industry.
If we consider emissions in 2010
|
(1) |
applying the IEA energy distribution fractions
|
(2) |
the values of each component of the industrial emissions are
|
(3) |
Industrial plants and processes are subject to ongoing improvements which will result in reductions of GHG emissions. For the majority of industries most of the emissions associated with their products come from the production of the primary material used to make the product rather than the manufacturing process. Not all industrial plants are designed or operated to minimise emissions. Estimates of the GHG savings that may be made by adopting world’s best practice in individual primary material sectors are given in [4,5]. An emissions weighted average of potential GHG saving that could be achieved by bringing all operations up to world’s best practice across all primary material sectors produced an estimate of 24%. Primary materials tend not to be used in their basic form and it has been estimated that through improvements in manufacturing practice to reduce manufacturing waste and product design optimisation it should be possible to improve material efficiency by 30% [6,7] i.e. the amount of primary material needed to make goods could be reduced by 30%. If these improvements in the production and use of primary materials were made it would reduce direct industrial emissions by 47%.
An estimation of the potential GHG emissions savings for the manufacturing sector can be inferred from estimations of potential energy saving. The IEA estimate that by adopting best practices it should be possible to reduce specific industrial energy demand by 20 to 30% [3] by improved process efficiency and operational practice. This is consistent with estimates in other literature [5,6].
Electricity accounts for the majority of energy used by industry. From the IEA world Energy Outlook [8] it looks likely that the reduction in carbon intensity of electricity generation could be in the order of 30% to 60% by 2030. This would give a combined GHG emissions saving from indirect emissions in the range of 44-72%. As the GHG intensity of electricity varies considerably with location, it was decided to use the lower estimate of potential savings.
If we assume that the savings identified above have been made by 2030 we have:
|
(4) |
Which if the ratios between direct and indirect emissions remain constant gives:
|
(5) |
The IEA reduction target for industrial emissions is 23% which appears to be achievable by adopting world’s best industrial practices and partial decarbonisation of the electricity sector. However, this disregards the effect of rising demand for goods. To stay within the emissions target:
|
So
|
It can be implied from equation 5 that:
So the limit for the increase in production that is possible within these constraints is:
|
(6) |
If the utilisation of goods remains the same, and the increase in the number of goods is proportional with the increase in the global middle class, then @{{N}_{2030}}=2.7 {{N}_{2010}}@. This presents additional challenges including massive investment in new production plants and an increase in the supply of raw materials, some of which are already considered to be scarce [6]. This increase in production is much higher than the maximum amount permitted under equation 4. Clearly even if the best available practice is adopted across the World’s industry it will not be possible to produce enough goods to meet this demand and stay within the IEA’s industrial emission target.
An alternative strategy is to see if the utility provided by goods can be maintained with a reduced supply of new goods. There are two ways that this can be achieved, by making goods last longer so they don’t need replacing so often and sharing infrequently used items amongst groups of users to reduce demand for actual goods.
If the service supplied by the goods is defined as:
|
|
If the production is limited to the value from equation 4 and the demand for service increased in line with the growth in consumers:
|
(7) |
This looks like a high target. However, if cars are considered as an example, in a 2008 report on UK car ownership, (published before the car scrappage scheme was introduced) prepared for the RAC foundation [9], it was reported that cars were scrapped at a steady rate from 9 to 20 years old with 50% of cars being scrapped by the time they were 14 years old. To get the required improvement in utilisation by increasing product life would require an increase in the average life to 29 years. Although this is a considerable extension it is technically possible as demonstrated by the number of classic cars in everyday use [10,11]. Alternatively as most of the growth in the middle class is predicted to be in urban areas, vehicle utilisation can be improved by joining car clubs. It has been reported that car clubs have around 4.3 members per cars [12] so a doubling of car utilisation could be achieved if 33% of people used car clubs rather than owning their own cars. Either of these approaches could be adopted, but would appear to be a major change in the way we approach car ownership. However in combination, they become less extreme and the same outcome is achieved by extending the average car life to 20 years and 15% of the population using car clubs. There are a number of ways to achieve longer product life and higher utilisation. In most cases there will need to be new business models developed to enable these strategies to be adopted in a way that is advantageous to the business community, consumers and the wider community.
The following environmental benefits of increased product longevity have been recognized [7,13]:
· Reduction in the need for replacement products leading to reduced requirements for raw materials,
· Lower industrial energy requirements,
· Lower industrial greenhouse gas emissions,
· Reduced volumes of end of life waste to deal with.
There are a number of different strategies for increasing product life and the appropriate one needs to be selected for each type of good. The following strategies: product durability, serviceability, upgradability refurbishment/remanufacture and alternative use are outlined in the following sections.
Most products have components that suffer wear or are prone to damage. The impact of this can be mitigated during design through the provision of more durable components, resulting in a product with a longer life span. This approach could have some of the following drawbacks:
· uses more material or more sophisticated materials resulting in a higher production cost and impact
· increased weight may increase operational energy requirement
· increased weight and bulkiness may make the object harder to use
· locks the user into an old design with limited opportunity to improve performance
· limited repeat sales for manufacture
An alternative approach, is designing the product to be deconstructed and maintained so that parts that are susceptible to wear and damage can be readily replaced.
This strategy has the following potential drawbacks:
· higher cost associated with a undoable fixtures
· repair by poorly trained staff or the use of substandard replacement components reduce reliability
· locks the user into an old design with opportunity to improve performance limited to the replaceable components
· limited repeat sales for manufacturer, although this can be offset by increase in business for the manufacturers’ authorisedservice agents
Historically most complex goods were serviceable, but improved manufacturing techniques and lubricants allowed sealed for life systems to become prevalent as a way to overcome the need to maintain a service infrastructure. However, providing servicing is carried out within a manufacturer’s controlled environment it can be used to provide valuable intelligence into how the product degrades with use which can be fed back into new designs.
Until recently the ability to upgrade the performance of products has been limited to those that consist of a collection of modules or components that can be replaced with ones of an improved specification during the product’s operational life. However, as more functionality is achieved by embedded intelligent and electronic controls there is a widening scope for in-service upgrades. Upgradability is a strategy that reduces the risk of technological redundancy for the consumer, but this reduces the opportunity for the manufacturer to make repeat sales. However, if the cost of materials and manufacturing represent a high proportion of the cost of a new product, the manufacturer’s profit margin on the sale may be quite small and vulnerable to outside influences. Whereas, the cost associated with an in-house upgrade are likely to be under the manufacturers’ control and the profit margins can be much higher (while still representing a saving for the consumer). Consequently product upgrading can be as profitable as manufacture in the case of rapidly developing high technology products. The problem with designing for upgrade is that it depends on the designer having a good idea of the developments that are likely to happen. Likewise if consideration has been made for a future upgrade it constrains the designer of the upgrade to fit it within the accommodation made.
Refurbishment is the process of replacing or repairing worn parts of a product to considerably increase its service life. A product must be serviceable to be refurbished, whereas serviceability is about dealing with premature failure caused by a weak component, refurbishment is undertaken on a wider range of components to increase the service life beyond its initial design life.
Remanufacture is the process of disassembly, cleaning, inspection, replacement of worn components and reassembly into a new product that is indistinguishable from one made of new components. This is an expensive procedure but can be cost effective on high value items that have components that wear at different rates. Assessment tools have been developed to evaluate the suitability of remanufacturing as a strategy for a particular item [14,15]. There are established refurbishment businesses for a wide range of products including white goods and wind turbines [16,17]. Remanufacturing is carried out on high value items such as aero engines and construction equipment where in-service failures are either unacceptable or expensive [16,18].
The construction sector showcases many examples of alternative uses of materials, including reuse of salvaged steel beams, stone work, bricks, telegraph poles and railway sleepers [7,19,20]. The main niche for alternative use is as a way of utilising obsolete or hard to recycle products. It is a mindset that treats old goods as a resource to be exploited rather than as a collection of materials to be recycled back into primary materials. Sometimes the alternative use may be in a different field for example the production of thermal insulation from a variety of waste goods [21] or the production of craft goods from discarded products. Improved coordination between the waste sector and product supply chain could expand this market and open up currently unforeseen opportunities.
There are clearly a number of tradeoffs to be considered when setting the design life for a product. The parameters that need to be considered have been grouped under six domains:
· Economic
o purchase price
o annualised purchase price
o annual running cost
o refurbishment cost
· Material consideration
o common material use
o rare material use
o ease of material recovery at end of life
o material required for maintenance
· Energy consideration
o energy embodied in the construction of the good
o annualised embodied energy
o annual operational energy
o energy needed for maintenance
o energy needed to recycle
· Environmental impacts
o life time emissions to land, water & air
o annualised emission to land, water & air
o local environment impact from manufacture
o local environmental impact from use
o local environmental impact from recycling
o consequential environmental impact from energy and material use
· Functional evolution
o sensitivity to change in technology
o sensitivity to fashion
· Fragility
o susceptibility to loose functionality over time
o degradation of appearance over time
It is recognisedthat it is not possible to quantify each of these parameters to the same extent but as the purpose is to compare alternative strategies it may be sufficient to use a five point scale for many of the parameters. The utilisation of a product can be improved by product sharing schemes like car clubs or plant hire and selling or donating unwanted goods to new owners. The potential for these strategies is still under investigation, and is part of further research in this area.
Although there are a number of current and historic examples of businesses that use these life extension strategies it is likely that new business models will be needed to fully exploit a low material future (i.e. a future with a low demand for new primary materials). In particular if products last longer manufacturing and retail businesses will get less repeat sales. This means that they will have to either chase the developing markets or get involved with all phases of a product life so that they can get future income from the goods they sell. This shift from pure manufacturing into a broader provision of services where the manufacture provides an ongoing facility to their customers rather than just the equipment to realize a facility is known as servitizationq. This can allow companies to maintain their profits without having to maintain their sales of new goods. A trend towards the servitization of industry has been witnessed over recent years [22,23,24], this strategy could help businesses thrive in a low material economy. Figure 1 shows the framework of activities that constitute a product life cycle in a low material future including those needed to enhance product life. It should be noted that Figure 1 shares features of circular economic models [25,26] i.e. very high rates of primary material recycling. However it is not considered practical for global industry to be solely reliant on recycled and renewable raw material in times of rapidly rising demand. The main difference between the framework shown in figure 1 and the traditional linear or circular economy models is a difference on the emphasis placed on maintenance, renovation and repair at the expense of manufacturing. This is to minimize the energy used to produce primary materials and reduce the need for raw material.
This would involve a shift from centralised high volume, highly specialised, mass production facilities into smaller, localised, flexible batch production facilities. Many people may consider this a giant step backwards but advances in additive manufacturing, improved flexibility of robots and machine tools means that many of the original drivers for large scale production are diminishing in importance [22,27,28,29]. A move towards more localisedproduction would allow increased customer involvement with the specification and design of the goods they buy, and keep a higher proportion of the economic added value resulting from production in the region where the goods are purchased, produced and serviced.
Although advancement in flexible manufacturing facilities and servitization will encourage the adoption of practices which are consistent with a low material economy there are still a number of barriers inhibiting its adoption. Issues relating to the adoption of strategies discussed in this paper formed the basis of a workshop in the “Industry seminar on optimising product lifetimes” held at Nottingham Trent University on 25 June 2014 [30]. Representatives of manufacturers, retailers, consultants, academics, government advisors and government department were asked to consider list of potential benefits, drivers and barriers and participants asked to rank them in order of importance. The participant were additionally asked to suggest other benefits, drivers or barriers that were absent from the original list. The participants were split into seven groups of 7 or 8 people to encourage discussion following guidelines in “Qualitative Research Skills Workshop: A Facilitators Reference Manual” [31]. The results of the ranking exercise are shown in Tables 1,2 & 3. As the point of the exercise was to identify those factors that were considered significant, it was decided to record all factors that at least one participant thought was in their top 5 these are shown in the “mentioned” column with those that were identified as being in the top 3 by any group shown in the “in top 3” column.
Benefits of reduced material demand | mentioned | in top 3 |
Reduced risk of material supply disruption | TRUE | TRUE |
Less price volatility of materials | TRUE | TRUE |
Potential for new business models | TRUE | FALSE |
Reduced environmental impacts | TRUE | TRUE |
Potential profits | TRUE | TRUE |
Reduced material costs | TRUE | TRUE |
Greener company image | TRUE | FALSE |
Prolonged commercial relationship with customer | TRUE | TRUE |
Opportunities for collaborative partnerships | TRUE | TRUE |
Benefit for society | TRUE | FALSE |
Drivers to move industry towards reduced material demand | mentioned | in top 3 |
Material Scarcity | TRUE | FALSE |
Disruption of material flows | TRUE | TRUE |
Disruption of energy supply | TRUE | FALSE |
User demand/attitudes | TRUE | TRUE |
Policy | TRUE | TRUE |
Carbon tax | TRUE | FALSE |
Impacts on profitability | TRUE | TRUE |
Future price and cost uncertainty for materials | TRUE | TRUE |
Future price and cost uncertainty for energy | TRUE | TRUE |
Reduced waste disposal cost | TRUE | FALSE |
Potential Barriers to reduced material demand | mentioned | in top 3 |
Intellectual Property | FALSE | FALSE |
Cost restraints | TRUE | TRUE |
Lack of investment capital to develop & build new facilities | TRUE | FALSE |
Lack of operational capital e.g. to store reused materials | TRUE | FALSE |
Time constraints | TRUE | FALSE |
Current policy requirements | TRUE | FALSE |
Lack of knowledge | TRUE | TRUE |
Lack of certification procedures for alternative practices i.e. reused steel | TRUE | FALSE |
Complex supply chains | TRUE | TRUE |
Complex information flows within the supply chain | TRUE | TRUE |
Consumer perception | TRUE | TRUE |
Consumer behavior | TRUE | TRUE |
Producers/consumers locked-into the current economic/market system | TRUE | TRUE |
The amount of price subsidies in key materials, gas and petrol | FALSE | FALSE |
Cultural expectation for new models | TRUE | TRUE |
Take back process limits reuse due to unknown supply quality and quantities | TRUE | FALSE |
Close loop supply chains & reverse loop supply chain could increase cost of logistics, transportation and energy | TRUE | TRUE |
Factors that were mentioned but did not make the top 3 are likely to be issues for particular industries. It was noticeable that intellectual property was not considered to be a barrier. This may be due to the presentation given in the workshop that showed refurbishment and remanufacturing activities being carried out by the manufacturers or their licensed agents. Cost issues were seen as key barriers, but the ability to remove exposure and save material cost were also identified as potential benefits. The fact that subsidizes were not mentioned indicates that the participants did not consider these to have a major influence on costs. Likewise, user demand / attitudes were seen as drivers and consumer perception, behavior and expectation for new models were seen as barriers. There is a rich literature on the drivers and influences on consumers and it would be wrong to assume that they are fixed. Further work is needed to explore this aspect.
While Tables 1 and 2 identify advantages for businesses in adopting business models that reduce the need for new goods while still providing a service to consumers, our research has not addressed the additional challenges for business to meet the rising global demand for goods by simply increasing production without improving product utilisation. We did not do this as we have identified that it is not a sustainable option from a GHG perspective. However, individual businesses may consider GHG emissions reduction as a matter for regulators not themselves. In this scenario, the challenges of conducting business as usual should not be underestimated, these may include the following considerations:
· Fluctuating growth rates for specific developing markets,
· Changing governments attitudes to foreign investment,
· Availability of finance,
· Inadequacy of industrial infrastructure,
· Shortage of trained workforce.
If these challenges are added to the factors identified in Tables 1 and 2,the business cases for adopting the strategies discussed in this paper become stronger. There is also evidence that new business models that include through life product support are beginning to be implemented [23,32,33,34].
The number of goods in the world and their intensity of use is currently unknown; however, material flow analysis (MFA) can be used at enterprise and national level to give annual consumptions of key materials [35,36]. These can be used with measures of economic activity like GDP or company turnover to produce an estimate of the Material Intensity of an economy or enterprise. If companies adopt the strategies proposed in this paper their material intensity should drop over time.
The demand for goods from the expanding global middle class cannot be met using the predominant manufacturing business model without seriously compromising industrial emission targets. However, if product life and utilisationis improved it should be able to meet the demand for service and stay within emission targets. The fact that the risk of disruption in material supply was considered to be a more significant driver than absolute material scarcity is revealing. It indicates that even if new sources of key materials are found they will only have an impact if they become globally available and if trade in key material is not considered to be at risk of political interference.
A number of benefits, drivers and barriers have been identified. It is noticeable that cost issues and consumer attitudes are considered to be both barriers and drivers indicating that more research is needed into these aspects to reveal their true impact. The lack of knowledge relating to business models that incorporate life extension and product sharing was also identified as a barrier so further work in this field would also be a benefit to business. Policy was identified as a driver and although current policy requirements were identified as an issue they were not considered to be a key one.
This work was conducted by the UK INDEMAND Centre which is funded by the Engineering and Physical Sciences Research Council Grant number EP/K011774/1 to do research into reducing industrial energy consumption and reducing the consumption of energy intensive materials.
All authors declare no conflicts of interest in this paper.
[1] |
A. P. Plageras, K. E. Psannis, C. Stergiou, H. Wang, B. B. Gupta, Efficient IoT-based sensor BIG Data collection–processing and analysis in smart buildings. Future Gener Comput Syst, 82 (2018), 349–357. https://doi.org/10.1016/j.future.2017.09.082 doi: 10.1016/j.future.2017.09.082
![]() |
[2] |
Z. Ahmed, M. Ayaz, M. A. Hijji, M. Z. Abbas, A. Rahim, AUV-Based efficient data collection scheme for underwater linear sensor networks. Int J Semant Web Inf Syst, 18 (2022), 1–19. https://doi.org/10.4018/IJSWIS.299858 doi: 10.4018/IJSWIS.299858
![]() |
[3] |
D. Tian, Y. Han, B. Wang, T. Guan, H. Gu, W. Wei, Review of object instance segmentation based on deep learning, J. Electron. Imag., 31 (2021), 041205. https://doi.org/10.1117/1.JEI.31.4.041205 doi: 10.1117/1.JEI.31.4.041205
![]() |
[4] |
K. S. Arikumar, A. D. Kumar, T. R. Gadekallu, S. B. Prathiba, K. Tamilarasi, Real-Time 3D Object detection and classification in autonomous driving environment using 3D LiDAR and camera sensors, Electronics, 11 (2022), 4203. https://doi.org/10.3390/electronics11244203 doi: 10.3390/electronics11244203
![]() |
[5] |
H. Song, A more efficient approach for remote sensing image classification, Comput. Mater. Contin., 74 (2023), 5741–5756. https://doi.org/10.32604/cmc.2023.034921 doi: 10.32604/cmc.2023.034921
![]() |
[6] |
H. Song, FST-EfficientNetV2: exceptional image classification for remote sensing, Comput. Sci. Eng., 46 (2023), 3959–3978. https://doi.org/10.32604/csse.2023.038429 doi: 10.32604/csse.2023.038429
![]() |
[7] | H. Touvron, A. Vedaldi, M. Douze, H. Jégou, Fixing the train-test resolution discrepancy, arXiv: 1906.06423, [preprint], (2019)[cited 2023 September 05]. Available from: http://arXiv.org/abs/1906.06423 |
[8] |
H. Song, A Leading but Simple Classification Method for Remote Sensing Images, AETiC, 7 (2023), 1–20. https://doi.org/10.33166/AETiC.2023.03.001 doi: 10.33166/AETiC.2023.03.001
![]() |
[9] | M. Tan, Q. V. Le, EfficientNet: Rethinking Model Scaling for Convolutional Neural Networks, arXiv: 1905.11946, [preprint], (2019)[cited 2023 September 05]. Available from: http://arXiv.org/abs/1905.11946 |
[10] |
G. Cheng, C. Yang, X. Yao, L. Guo, J. Han, When deep learning meets metric learning: remote sensing image scene classification via learning discriminative CNNs, IEEE Trans Geosci Remote Sens, 56 (2018), 2811–2821. https://doi.org/10.1109/TGRS.2017.2783902 doi: 10.1109/TGRS.2017.2783902
![]() |
[11] |
Y. Guo, J. Ji, X. Lu, H. Huo, T. Fang, D. Li, Global-Local attention network for aerial scene classification, IEEE Access, 7 (2019), 67200–67212. https://doi.org/10.1109/ACCESS.2019.2918732 doi: 10.1109/ACCESS.2019.2918732
![]() |
[12] |
R. Minetto, M. P. Segundo, S. Sarkar, Hydra: An ensemble of convolutional neural networks for geospatial land classification, IEEE Trans Geosci Remote Sens, 57 (2019), 6530–6541. https://doi.org/10.1109/TGRS.2019.2906883 doi: 10.1109/TGRS.2019.2906883
![]() |
[13] |
W. Tong, W. Chen, W. Han, X. Li, L. Wang, Channel-Attention-Based DenseNet network for remote sensing image scene classification, IEEE J Sel Top Appl Earth Obs Remote Sens, 13 (2020), 4121–4132. https://doi.org/10.1109/JSTARS.2020.3009352 doi: 10.1109/JSTARS.2020.3009352
![]() |
[14] | J. Li, D. Lin, Y. Wang, G. Xu, C. Ding, Deep discriminative representation learning with attention map for scene classification, arXiv: 1902.07967, [preprint], (2019)[cited 2023 September 05]. Available from: http://arXiv.org/abs/1902.07967 |
[15] |
H. Alhichri, A. S. Alswayed, Y. Bazi, N. Ammour, N. A. Alajlan, Classification of remote sensing images using efficientnet-b3 cnn model with attention, IEEE Access, 9 (2021), 14078–14094. https://doi.org/10.1109/ACCESS.2021.3051085 doi: 10.1109/ACCESS.2021.3051085
![]() |
[16] |
B. Li, Y. Guo, J. Yang, L. Wang, Y. Wang, W. An, Gated recurrent multiattention network for VHR remote sensing image classification, IEEE Trans Geosci Remote Sens, 60 (2022), 1–13. https://doi.org/10.1109/TGRS.2021.3093914 doi: 10.1109/TGRS.2021.3093914
![]() |
[17] |
W. Chen, S. Ouyang, W. Tong, X. Li, X. Zheng, L. Wang, GCSANet: A global context spatial attention deep learning network for remote sensing scene classification, IEEE J Sel Top Appl Earth Obs Remote Sens, 15 (2022), 1150–1162. https://doi.org/10.1109/JSTARS.2022.3141826 doi: 10.1109/JSTARS.2022.3141826
![]() |
[18] |
Q. Zhao, Y. Ma, S. Lyu, L. Chen, Embedded Self-Distillation in compact multibranch ensemble network for remote sensing scene classification, IEEE Trans Geosci Remote Sens, 60 (2022), 1–15. https://doi.org/10.1109/TGRS.2021.3126770 doi: 10.1109/TGRS.2021.3126770
![]() |
[19] |
H. Song, A consistent mistake in remote sensing images' classification literature, Intell. Autom. Soft Comput., 37 (2023), 1381–1398. https://doi.org/10.32604/iasc.2023.039315 doi: 10.32604/iasc.2023.039315
![]() |
[20] |
S. Chaib, H. Liu, Y. Gu, H. Yao, Deep feature fusion for vhr remote sensing scene classification, IEEE Trans Geosci Remote Sens, 55 (2017), 4775–4784. https://doi.org/10.1109/TGRS.2017.2700322 doi: 10.1109/TGRS.2017.2700322
![]() |
[21] |
Y. Liu, C. Y. Suen, Y. Liu, L. Ding, Scene classification using hierarchical wasserstein CNN, IEEE Trans Geosci Remote Sens, 57 (2019), 2494–2509. https://doi.org/10.1109/TGRS.2018.2873966 doi: 10.1109/TGRS.2018.2873966
![]() |
[22] |
Y. Liu, Y. Liu, L. Ding, Scene classification by coupling convolutional neural networks with wasserstein distance, IEEE Geosci. Remote Sensing Lett., 16 (2019), 722–726. https://doi.org/10.1109/LGRS.2018.2883310 doi: 10.1109/LGRS.2018.2883310
![]() |
[23] |
Y. Bazi, M. M. Al Rahhal, H. Alhichri, N. Alajlan, Simple yet effective fine-tuning of deep CNNs using an auxiliary classification loss for remote sensing scene classification, Remote Sensing, 11 (2019), 2908. https://doi.org/10.3390/rs11242908 doi: 10.3390/rs11242908
![]() |
[24] |
W. Zhang, P. Tang, L. Zhao, Remote sensing image scene classification using CNN-CapsNet, Remote Sensing, 11 (2019), 494. https://doi.org/10.3390/rs11050494 doi: 10.3390/rs11050494
![]() |
[25] |
J. Xie, N. He, L. Fang, A. Plaza, Scale-Free convolutional neural network for remote sensing scene classification, IEEE Trans Geosci Remote Sens, 57 (2019), 6916–6928. https://doi.org/10.1109/TGRS.2019.2909695 doi: 10.1109/TGRS.2019.2909695
![]() |
[26] |
H. Sun, S. Li, X. Zheng, X. Lu, Remote sensing scene classification by gated bidirectional network, IEEE Trans Geosci Remote Sens, 58 (2020), 82–96. https://doi.org/10.1109/TGRS.2019.2931801 doi: 10.1109/TGRS.2019.2931801
![]() |
[27] |
D. Guo, Y. Xia, X. Luo, Scene classification of remote sensing images based on saliency dual attention residual network, IEEE Access, 8 (2020), 6344–6357. https://doi.org/10.1109/ACCESS.2019.2963769 doi: 10.1109/ACCESS.2019.2963769
![]() |
[28] |
X. Tang, Q. Ma, X. Zhang, F. Liu, J. Ma, L. Jiao, Attention consistent network for remote sensing scene classification, IEEE J Sel Top Appl Earth Obs Remote Sens, 14 (2021), 2030–2045. https://doi.org/10.1109/JSTARS.2021.3051569 doi: 10.1109/JSTARS.2021.3051569
![]() |
[29] |
Y. Bazi, L. Bashmal, M. M. A. Rahhal, R. A. Dayil, N. A. Ajlan, Vision transformers for remote sensing image classification, Remote Sensing, 13 (2021), 516. https://doi.org/10.3390/rs13030516 doi: 10.3390/rs13030516
![]() |
[30] |
J. Zhang, H. Zhao, J. Li, TRS: transformers for remote sensing scene classification, Remote Sensing, 13 (2021), 4143. https://doi.org/10.3390/rs13204143 doi: 10.3390/rs13204143
![]() |
[31] | D. Wang, J. Zhang, B. Du, G. S. Xia, D. Tao, An empirical study of remote sensing pretraining, arXiv: 2204.02825, [preprint], (2022)[cited 2023 September 06]. Available from: http://arXiv.org/abs/2204.02825 |
[32] |
C. Shi, X. Zhang, J. Sun, L. Wang, Remote sensing scene image classification based on Self-Compensating convolution neural network, Remote Sensing, 14 (2022), 545. https://doi.org/10.3390/rs14030545 doi: 10.3390/rs14030545
![]() |
[33] |
S. B. Chen, Q. S. Wei, W. Z. Wang, J. Tang, B. Luo, Z. Y. Wang, Remote sensing scene classification via Multi-Branch local attention network, IEEE Trans. on Image Process., 31 (2022), 99–109. https://doi.org/10.1109/TIP.2021.3127851 doi: 10.1109/TIP.2021.3127851
![]() |
[34] |
P. Deng, K. Xu, H. Huang, When CNNs meet vision transformer: a joint framework for remote sensing scene classification, IEEE Geosci. Remote Sensing Lett., 19 (2022), 1–5. https://doi.org/10.1109/LGRS.2021.3109061 doi: 10.1109/LGRS.2021.3109061
![]() |
[35] |
W. Miao, J. Geng, W. Jiang, Multigranularity decoupling network with pseudolabel selection for remote sensing image scene classification, IEEE Trans Geosci Remote Sens, 61 (2023), 1–13. https://doi.org/10.1109/TGRS.2023.3244565 doi: 10.1109/TGRS.2023.3244565
![]() |
[36] |
H. Song, W. Yang, GSCCTL: a general semi-supervised scene classification method for remote sensing images based on clustering and transfer learning, Int J Remote Sens., 43 (2022), 5976–6000. https://doi.org/10.1080/01431161.2021.2019851 doi: 10.1080/01431161.2021.2019851
![]() |
[37] |
W. Wang, Y. Chen, P. Ghamisi, Transferring CNN with adaptive learning for remote sensing scene classification, IEEE Trans Geosci Remote Sens, 60 (2022), 1–18. https://doi.org/10.1109/TGRS.2022.3190934 doi: 10.1109/TGRS.2022.3190934
![]() |
[38] |
K. Xu, P. Deng, H. Huang, Vision transformer: an excellent teacher for guiding small networks in remote sensing image scene classification, IEEE Trans Geosci Remote Sens, 60 (2022), 1–15. https://doi.org/10.1109/TGRS.2022.3152566 doi: 10.1109/TGRS.2022.3152566
![]() |
[39] | T. He, Z. Zhang, H. Zhang, Z. Zhang, J. Xie, M. Li, Bag of tricks for image classification with convolutional neural networks, Proceedings of the IEEE/CVF conference on computer vision and pattern recognition, (2019), 558–567. |
[40] | S. Yun, D. Han, S. J. Oh, S. Chun, J. Choe, Y. Yoo, CutMix: Regularization strategy to train strong classifiers with localizable features, Proceedings of the IEEE/CVF international conference on computer vision, (2019), 6023–6032. |
[41] |
C. B. Zhang, P. T. Jiang, Q. Hou, Y. Wei, Q. Han, Z. Li, et al., Delving deep into label smoothing, IEEE Trans. on Image Process., 30 (2021), 5984–5996. https://doi.org/10.1109/TIP.2021.3089942 doi: 10.1109/TIP.2021.3089942
![]() |
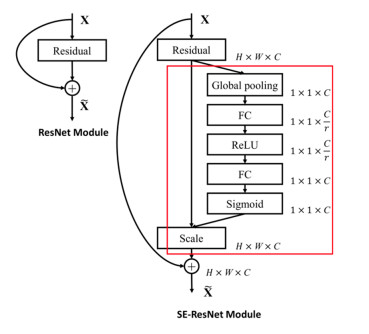
[42] | J. Hu, L. Shen, S. Albanie, G. Sun, E. Wu, Squeeze-and-Excitation Networks, Proceedings of the IEEE conference on computer vision and pattern recognition, (2018), 7132–7141. |
[43] | R. R. Selvaraju, M. Cogswell, A. Das, R. Vedantam, D. Parikh, D. Batra, Grad-CAM: visual explanations from deep networks via Gradient-Based localization, Proceedings of the IEEE international conference on computer vision, (2017), 618–626. |
[44] | I. Loshchilov, F. Hutter, Decoupled weight decay regularization, arXiv: 1711.05101v3, [preprint], (2017)[cited 2023 September 05]. Available from: http://arXiv.org/abs/1711.05101v3 |
[45] | C. Szegedy, V. Vanhoucke, S. Ioffe, J. Shlens, Z. Wojna, Rethinking the inception architecture for computer vision, Proceedings of the IEEE conference on computer vision and pattern recognition, 2016, 2818–2826. |
[46] | H. Zhang, M. Cisse, Y. N. Dauphin, D. Lopez-Paz, Mixup: beyond empirical risk minimization, arXiv: 1710.09412, [preprint], (2017)[cited 2023 September 05]. Available from: http://arXiv.org/abs/1710.09412 |
[47] | Y. H. Liu, E. Sangineto, W. Bi, N. Sebe, B. Lepri, M. Nadai, Efficient training of visual transformers with small datasets, NIPS, 34 (2021), 23818–23830. |
[48] | A. Hassani, S. Walton, N. Shah, A. Abuduweili, J. Li, H. Shi, Escaping the big data paradigm with compact transformers, arXiv: 2104.05704, [preprint], (2021)[cited 2023 September 05]. Available from: http://arXiv.org/abs/2104.05704 |
[49] |
Z. Li, F. Liu, W. Yang, S. Peng, J. Zhou, A survey of convolutional neural networks: analysis, applications, and prospects, IEEE Trans. Neural Netw. Learning Syst., 33 (2022), 6999–7019. https://doi.org/10.1109/TNNLS.2021.3084827 doi: 10.1109/TNNLS.2021.3084827
![]() |
[50] | F. Liu, D. Chen, Z. Guan, X. Zhou, J. Zhu, J. Zhou, RemoteCLIP: A vision language foundation model for remote sensing, arXiv: 2306.11029, [preprint], (2023)[cited 2023 September 05]. Available from: http://arXiv.org/abs/2306.11029 |
[51] | L van der Maaten, G. Hinton, Visualizing data using t-SNE, J Mach Learn Res, 9 (2008), 2579–2605. |
[52] |
Y. Long, G. S. Xia, S. Li, W. Yang, M. Y. Yang, X. X. Zhu, et al., On creating benchmark dataset for aerial image interpretation: reviews, guidances, and Million-AID, IEEE J Sel Top Appl Earth Obs Remote Sens, 14 (2021), 4205–4230. https://doi.org/10.1109/JSTARS.2021.3070368 doi: 10.1109/JSTARS.2021.3070368
![]() |
1. | Anders Haug, Defining ‘Resilient Design’ in the Context of Consumer Products, 2018, 21, 1460-6925, 15, 10.1080/14606925.2018.1395265 | |
2. | D. Lilley, B. Bridgens, A. Davies, A. Holstov, Ageing (dis)gracefully: Enabling designers to understand material change, 2019, 220, 09596526, 417, 10.1016/j.jclepro.2019.01.304 | |
3. | Samuel J.G. Cooper, Jannik Giesekam, Geoffrey P. Hammond, Jonathan B. Norman, Anne Owen, John G. Rogers, Kate Scott, Thermodynamic insights and assessment of the ‘circular economy’, 2017, 162, 09596526, 1356, 10.1016/j.jclepro.2017.06.169 | |
4. | María Fernanda Godoy León, Jo Dewulf, Data quality assessment framework for critical raw materials. The case of cobalt, 2020, 157, 09213449, 104564, 10.1016/j.resconrec.2019.104564 | |
5. | Ben Bridgens, Mark Powell, Graham Farmer, Claire Walsh, Eleanor Reed, Mohammad Royapoor, Peter Gosling, Jean Hall, Oliver Heidrich, Creative upcycling: Reconnecting people, materials and place through making, 2018, 189, 09596526, 145, 10.1016/j.jclepro.2018.03.317 | |
6. | Vijay Kumar, Niina Hernández, Michelle Jensen, Rudrajeet Pal, Deep learning based system for garment visual degradation prediction for longevity, 2023, 144, 01663615, 103779, 10.1016/j.compind.2022.103779 | |
7. | Peter Byrial Jensen, Louise Møller Haase, Tim Cooper, Joseph Steward, Phillipa Marsh, Linda Nhu Laursen, 2023, Chapter 85, 978-3-031-28838-8, 757, 10.1007/978-3-031-28839-5_85 | |
8. | Feiyan Peng, Anhua Long, Juan Chen, Khloe Qi Kang, A narrative review of Environmentally Oriented Anti-consumption: Definitions, dimensions, and research framework, 2024, 51, 23525509, 199, 10.1016/j.spc.2024.07.001 |
Benefits of reduced material demand | mentioned | in top 3 |
Reduced risk of material supply disruption | TRUE | TRUE |
Less price volatility of materials | TRUE | TRUE |
Potential for new business models | TRUE | FALSE |
Reduced environmental impacts | TRUE | TRUE |
Potential profits | TRUE | TRUE |
Reduced material costs | TRUE | TRUE |
Greener company image | TRUE | FALSE |
Prolonged commercial relationship with customer | TRUE | TRUE |
Opportunities for collaborative partnerships | TRUE | TRUE |
Benefit for society | TRUE | FALSE |
Drivers to move industry towards reduced material demand | mentioned | in top 3 |
Material Scarcity | TRUE | FALSE |
Disruption of material flows | TRUE | TRUE |
Disruption of energy supply | TRUE | FALSE |
User demand/attitudes | TRUE | TRUE |
Policy | TRUE | TRUE |
Carbon tax | TRUE | FALSE |
Impacts on profitability | TRUE | TRUE |
Future price and cost uncertainty for materials | TRUE | TRUE |
Future price and cost uncertainty for energy | TRUE | TRUE |
Reduced waste disposal cost | TRUE | FALSE |
Potential Barriers to reduced material demand | mentioned | in top 3 |
Intellectual Property | FALSE | FALSE |
Cost restraints | TRUE | TRUE |
Lack of investment capital to develop & build new facilities | TRUE | FALSE |
Lack of operational capital e.g. to store reused materials | TRUE | FALSE |
Time constraints | TRUE | FALSE |
Current policy requirements | TRUE | FALSE |
Lack of knowledge | TRUE | TRUE |
Lack of certification procedures for alternative practices i.e. reused steel | TRUE | FALSE |
Complex supply chains | TRUE | TRUE |
Complex information flows within the supply chain | TRUE | TRUE |
Consumer perception | TRUE | TRUE |
Consumer behavior | TRUE | TRUE |
Producers/consumers locked-into the current economic/market system | TRUE | TRUE |
The amount of price subsidies in key materials, gas and petrol | FALSE | FALSE |
Cultural expectation for new models | TRUE | TRUE |
Take back process limits reuse due to unknown supply quality and quantities | TRUE | FALSE |
Close loop supply chains & reverse loop supply chain could increase cost of logistics, transportation and energy | TRUE | TRUE |