It is becoming increasingly evident that educators need to prioritize the welfare of their students, particularly those who are underperforming academically, also known as "students at risk". By analyzing learning behaviors, including attendance records, past academic results, and online interactions, we can identify students at risk and provide them with timely support. Therefore, this study aimed to develop a prediction model for identifying students at risk in an actuarial science course and suggest an intervention strategy. Our study was comprised of five components of learning analytics: data collection, reporting, prediction, intervention, and reassessment. Prior to applying a prediction model, correlation analysis was utilized to identify variables impacting students' academic performance. Three variables, including CGPA, pre-requisite subject marks, and assessment marks were considered due to their rather strong correlation with the final marks of the course. Then, quadratic discriminant analysis (QDA) was applied to predict students classified as "at risk" and "not as risk". Out of 69 students from the course, 15 students identified as "at risk" and 40 students participated in the Peer Assisted Learning Program (PALP) as an intervention strategy to reduce the course's failure rate. We cannot conclude whether PALP was an effective intervention strategy for students at risk because a majority of them failed to attend. However, we observed that those who attended PALP had a higher likelihood of passing the course. Our prediction model had high rates of accuracy, precision, sensitivity, and specificity, which were 91%, 98%, 91%, and 91%, respectively. Therefore, QDA could be considered a robust model for predicting students at risk. We have outlined some limitations and future studies at the end of our study.
Citation: Lay Guat Chan, Qian Yun Ng. Using learning analytics in higher education: Assessing students' learning experience in an actuarial science course[J]. STEM Education, 2024, 4(2): 151-164. doi: 10.3934/steme.2024010
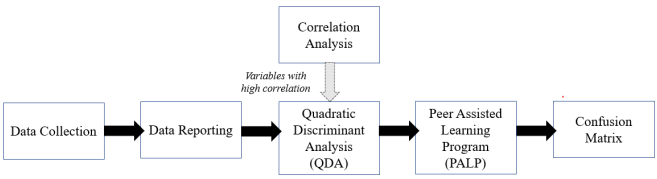
It is becoming increasingly evident that educators need to prioritize the welfare of their students, particularly those who are underperforming academically, also known as "students at risk". By analyzing learning behaviors, including attendance records, past academic results, and online interactions, we can identify students at risk and provide them with timely support. Therefore, this study aimed to develop a prediction model for identifying students at risk in an actuarial science course and suggest an intervention strategy. Our study was comprised of five components of learning analytics: data collection, reporting, prediction, intervention, and reassessment. Prior to applying a prediction model, correlation analysis was utilized to identify variables impacting students' academic performance. Three variables, including CGPA, pre-requisite subject marks, and assessment marks were considered due to their rather strong correlation with the final marks of the course. Then, quadratic discriminant analysis (QDA) was applied to predict students classified as "at risk" and "not as risk". Out of 69 students from the course, 15 students identified as "at risk" and 40 students participated in the Peer Assisted Learning Program (PALP) as an intervention strategy to reduce the course's failure rate. We cannot conclude whether PALP was an effective intervention strategy for students at risk because a majority of them failed to attend. However, we observed that those who attended PALP had a higher likelihood of passing the course. Our prediction model had high rates of accuracy, precision, sensitivity, and specificity, which were 91%, 98%, 91%, and 91%, respectively. Therefore, QDA could be considered a robust model for predicting students at risk. We have outlined some limitations and future studies at the end of our study.

| [1] | Lewis, R. and McCann, T., Teaching "at risk" students: Meeting their needs, in International Handbook of Research on Teachers and Teaching, Saha, L.J., Dworkin, A.G, Ed. 2009. Springer International Handbooks of Education. |
| [2] |
Alyahyan, E. and Düştegör, D., Predicting academic success in higher education: literature review and best practices. International Journal of Educational Technology in Higher Education, 2020, 17(1): 3. https://doi.org/10.1186/s41239-020-0177-7 doi: 10.1186/s41239-020-0177-7

|
| [3] | Rienties, B., Nguyen, Q., Holmes, W. and Reedy, K., A review of ten years of implementation and research in aligning learning design with learning analytics at the Open University UK. Journal of Interaction Design and Architecture, 2017, 33: 134‒154. |
| [4] | Choi, S.P.M., Lam, S.S., Li, K.C. and Wong, B.T.M., Learning analytics at low cost: At-risk student prediction with clicker data and systematic proactive interventions. Educational Technology & Society, 2018, 21(2): 273–290. |
| [5] |
Wilkinsona, K., McNamaraa, I., Wilsonb, D. and Riggsa, K., Using learning analytics to evaluate course design and student behaviour in an online wine business course. International Journal of Innovation in Science and Mathematics Education, 2019, 27(4): 97‒108. https://doi.org/10.30722/IJISME.27.04.008 doi: 10.30722/IJISME.27.04.008
|
| [6] | Abdul Jalil, N. and Wong Ei Leen, M., Learning analytics in higher education: The student expectations of learning analytics. Proceedings of the 2021 5th International Conference on Education and E-Learning (ICEEL '21). New York, NY, USA, 2021,249–254. https://doi.org/10.1145/3502434.3502463 |
| [7] | Arnold, K.E., Signals: Applying academic analytics. Educause Quarterly, 2010, 33(1): n1. |
| [8] |
Ramli, I.S., Maat, S.M. and Khalid, F., Learning analytics in mathematics: A systematic review. International Journal of Academic Research in Progressive Education and Development, 2019, 8(4): 436‒449. http://dx.doi.org/10.6007/IJARPED/v8-i4/6563 doi: 10.6007/IJARPED/v8-i4/6563
|
| [9] |
Akçapınar, G., Altun, A. and Aşkar, P., Using learning analytics to develop early-warning system for at-risk students. International Journal of Educational Technology in Higher Education, 2019, 16(1): 1‒20. https://doi.org/10.1186/s41239-019-0172-z doi: 10.1186/s41239-019-0172-z
|
| [10] | Campbell, J.P. and Oblinger, D.G., Academic analytics. EDUCAUSE Review, 2007, 42(4): 40–57. |
| [11] |
Finch, H. and Schneider, M.K., Classification Accuracy of Neural Networks vs. Discriminant Analysis, Logistic Regression, and Classification and Regression Trees. Methodology, 2007, 3(2): 47–57. https://doi.org/10.1027/1614-2241.3.2.47 doi: 10.1027/1614-2241.3.2.47
|
| [12] |
Mubarak, A.A., Cao, H. and Zhang, W., Prediction of students' early dropout based on their interaction logs in online learning environment. Interactive Learning Environments, 2020, 30(8): 1414–1433. https://doi.org/10.1080/10494820.2020.1727529 doi: 10.1080/10494820.2020.1727529
|
| [13] |
Mueen, A., Zafar, B. and Manzoor, U., Modeling and predicting students' academic performance using data mining techniques. International Journal Modern Education and Computer Science, 2016, 11: 36–42. https://doi.org/10.5815/ijmecs.2016.11.05 doi: 10.5815/ijmecs.2016.11.05
|
| [14] |
Ha, D.H., Nguyen, P.T., Costache, R., Al-Ansari, N., Van Phong, T., Nguyen, H.D., et al., Quadratic Discriminant Analysis based ensemble machine learning models for groundwater potential modeling and mapping. Water Resources Management, 2021, 35(13): 4415–4433. https://doi.org/10.1007/s11269-021-02957-6 doi: 10.1007/s11269-021-02957-6
|
| [15] | McLachlan, G.J., Discriminant Analysis and Statistical Pattern Recognition. 2nd ed. 2004, Hoboken, NJ, USA: Wiley. |
| [16] | Hastie, T., Tibshirani, R. and Friedman, J., The Elements of Statistical Learning: Data Mining, Inference, and Prediction. 2nd ed. 2009, New York, NY, USA: Springer. |
| [17] | Lakkaraju, H., Aguiar, E., Shan, C., Miller, D., Bhanpuri, N., Ghani, R., et al., A Machine Learning Framework to Identify Students at Risk of Adverse Academic Outcomes. Proceedings of the 21st ACM SIGKDD International Conference on Knowledge Discovery and Data Mining. Australia, 2015, 1909‒1918. https://doi.org/10.1145/2783258.2788620 |
| [18] |
Yang, S., Lu, O., Huang, A., Huang, J., Ogata, H. and Lin, A., Predicting students' academic performance using multiple linear regression and principal component analysis. Journal of Information Processing, 2018, 26: 170–176. https://doi.org/10.2197/ipsjjip.26.170 doi: 10.2197/ipsjjip.26.170
|
| [19] |
Shah, R.K. and Barkas, L.A., Analysing the impact of e-learning technology on students' engagement, attendance and performance. Research in Learning Technology, 2018, 26. https://doi.org/10.25304/rlt.v26.2070 doi: 10.25304/rlt.v26.2070
|
| [20] |
Stewart, M., Stott, T. and Nuttall, A-M., Student engagement patterns over the duration of level 1 and level 3 Geography modules: influences on student attendance, performance and use of online resources. Journal of Geography in Higher Education, 2011, 35(1): 47‒65. https://doi.org/10.1080/03098265.2010.498880 doi: 10.1080/03098265.2010.498880
|
| [21] |
Nepal, R. and Rogerson, A.M., From theory to practice of promoting student engagement in business and law-related disciplines: the case of undergraduate economics education. Education Sciences, 2020, 10(8): 205. https://doi.org/10.3390/educsci10080205 doi: 10.3390/educsci10080205
|
| [22] |
Makala, Q., Peer-assisted learning programme: Supporting students in high-risk subjects at the mechanical engineering department at Walter Sisulu University. Journal of Student Affairs in Africa, 2017, 5(2): 17‒31. https://doi.org/10.24085/jsaa.v5i2.2700 doi: 10.24085/jsaa.v5i2.2700
|
| [23] | Cheng, D. and Walters, M., Peer-assisted learning in mathematics: An observational study of student success. Journal of Peer Learning, 2009, 2: 23‒39. |
| [24] |
Hyde, J.S., Fennema, E. and Lamon. S.J., Gender differences in mathematics performance: a meta-analysis. Psychological Bulletin, 1990,107(2): 139‒155. https://doi.org/10.1037/0033-2909.107.2.139 doi: 10.1037/0033-2909.107.2.139
|
| [25] |
Else-Quest, N.M., Hyde, J.S. and Linn, M.C., Cross-national patterns of gender differences in mathematics: a meta-analysis. Psychological Bulletin, 2012,136(1): 103–127. https://doi.org/10.1037/a0018053 doi: 10.1037/a0018053
|
| [26] |
Arias, O., Canals, C., Mizala, A. and Meneses, F., Gender gaps in Mathematics and Language: The bias of competitive achievement tests. PLoS ONE, 2023, 18(3): e0283384. https://doi.org/10.1371/journal.pone.0283384 doi: 10.1371/journal.pone.0283384
|
| [27] |
McSporran, M. and Young, S., Does gender matter in online learning? Research in Learning Technology, 2001, 9(2): 3‒15. https://doi.org/10.1080/0968776010090202 doi: 10.1080/0968776010090202
|
| [28] | Mukaka, M., Statistics corner: A guide to appropriate use of correlation coefficient in medical research. Malawi Medical Journal, 2012, 24(3): 69‒71. |
| [29] | Dancey, C.P. and Reidy, J., Statistics Without Maths for Psychology: Using SPSS for Windows. 4th ed. 2008. Prentice Hall. |
| [30] |
Karalar, H., Kapucu, C. and Gürüler, H., Predicting students at risk of academic failure using ensemble model during pandemic in a distance learning system. International Journal of Educational Technology in Higher Education, 2021, 18(1): 63. https://doi.org/10.1186/s41239-021-00300-y doi: 10.1186/s41239-021-00300-y
|
| [31] | Tsakirtzis, S. and Georgakopoulos, I., Developing a risk model to identify factors which critically affect secondary school students' performance in mathematics. Journal for the Mathematics Education and Teaching Practices, 2020, 1(2): 63‒72. |
| [32] | Tabachnick, B.G. and Fidell, L.S., Using Multivariate Statistics. 6th ed. 2012, Boston, MA, USA: Person Education. |
| [33] | Lachenbruch, P.A., Discriminant Analysis. Biometrics, 1979, 35: 69‒85. |
Figures(1) / Tables(11)
Lay Guat Chan, Qian Yun Ng. Using learning analytics in higher education: Assessing students' learning experience in an actuarial science course[J]. STEM Education, 2024, 4(2): 151-164. doi: 10.3934/steme.2024010


 DownLoad: