Dengue transmission in Mexico exhibits substantial spatial and temporal variability driven by climatic and environmental conditions. We investigated the relationship between climate variability and weekly dengue incidence using epidemiological, demographic, geographic, and environmental data from 2475 municipalities between 2011 and 2021. A multiscale statistical framework was developed by integrating national scale models (NSMs) and local scale models (LSMs). At the national level, generalized linear and Bayesian hierarchical spatial models were evaluated under different probability distributions, lag structures, and random-effect specifications. Municipality-level Bayesian models were subsequently used to characterize local transmission dynamics. National analyses showed that climatic covariates, together with municipality-level heterogeneity, explained a large proportion of the observed variation in dengue incidence. In contrast, local models revealed considerable regional differences in the contribution of individual climatic predictors, indicating that climate–dengue relationships are spatially heterogeneous. Moreover, shorter lag structures generally improved non-spatial models, whereas longer lags were more competitive in spatial models. These findings highlight the importance of integrating national and local analyses to better characterize dengue transmission and support geographically targeted surveillance and control strategies.
Citation: Inder Tecuapetla-Gómez, Héctor De la Torre Gutiérrez, Mayra Núñez-López, L. Leticia Ramírez-Ramírez. A multiscale statistical analysis of the relationship between climate variability and dengue incidence in Mexico[J]. Mathematical Biosciences and Engineering, 2026, 23(11): 3436-3469. doi: 10.3934/mbe.2026118
Dengue transmission in Mexico exhibits substantial spatial and temporal variability driven by climatic and environmental conditions. We investigated the relationship between climate variability and weekly dengue incidence using epidemiological, demographic, geographic, and environmental data from 2475 municipalities between 2011 and 2021. A multiscale statistical framework was developed by integrating national scale models (NSMs) and local scale models (LSMs). At the national level, generalized linear and Bayesian hierarchical spatial models were evaluated under different probability distributions, lag structures, and random-effect specifications. Municipality-level Bayesian models were subsequently used to characterize local transmission dynamics. National analyses showed that climatic covariates, together with municipality-level heterogeneity, explained a large proportion of the observed variation in dengue incidence. In contrast, local models revealed considerable regional differences in the contribution of individual climatic predictors, indicating that climate–dengue relationships are spatially heterogeneous. Moreover, shorter lag structures generally improved non-spatial models, whereas longer lags were more competitive in spatial models. These findings highlight the importance of integrating national and local analyses to better characterize dengue transmission and support geographically targeted surveillance and control strategies.

| [1] |
S. Bhatt, P. W. Gething, O. J. Brady, J. P. Messina, A. W. Farlow, C. L. Moyes, et al., The global distribution and burden of dengue, Nature, 496 (2013), 504–507. https://doi.org/10.1038/nature12060 doi: 10.1038/nature12060
|
| [2] |
World Health Organization, Dengue and Severe Dengue, 2025. Available from: https://www.who.int/health-topics/dengue-and-severe-dengue#tab=tab_1. |
| [3] |
E. A. Mordecai, J. M. Cohen, M. V. Evans, P. Gudapati, L. R. Johnson, C. A. Lippi, et al., Detecting the impact of temperature on transmission of Zika, dengue, and chikungunya using mechanistic models, PLoS Negl. Trop. Dis., 11 (2017), e0005568. https://doi.org/10.1371/journal.pntd.0005568 doi: 10.1371/journal.pntd.0005568
|
| [4] |
O. J. Brady, M. A. Johansson, C. A. Guerra, S. Bhatt, N. Golding, D. M. Pigott, et al., Modelling adult Aedes Aegypti and Aedes Albopictus survival at different temperatures, Parasites Vectors, 6 (2014), 351. https://doi.org/10.1186/1756-3305-6-351 doi: 10.1186/1756-3305-6-351
|
| [5] |
L. Feng, C. Caminade, S. A. Müller, E. A. Mordecai, T. K. Yamana, M. U. G. Kraemer, et al., Temperature-driven dengue transmission in a changing climate: Patterns, trends, and future projections, GeoHealth, 8 (2024), e2024GH001059. https://doi.org/10.1029/2024GH001059 doi: 10.1029/2024GH001059
|
| [6] |
A. G. Lemma, G. T. Tilahun, B. T. Bekele, Modeling the impact of climate change on dengue transmission dynamics in Dire Dawa, Afar, and Somali, Ethiopia: An African regional perspective, Sci. Rep., 15 (2025), 33979. https://doi.org/10.1038/s41598-025-10648-0 doi: 10.1038/s41598-025-10648-0
|
| [7] |
M. A. Johansson, F. Dominici, G. E. Glass, Local and global effects of climate on dengue transmission in Puerto Rico, PLoS Negl. Trop. Dis., 3 (2009), e382. https://doi.org/10.1371/journal.pntd.0000382 doi: 10.1371/journal.pntd.0000382
|
| [8] |
Z. Xu, H. Bambrick, L. Yakob, G. Devine, J. Lu, F. D. Frentiu, et al., Spatiotemporal patterns and climatic drivers of severe dengue in Thailand, Sci. Total Environ., 656 (2019), 889–901. https://doi.org/10.1016/j.scitotenv.2018.11.395 doi: 10.1016/j.scitotenv.2018.11.395
|
| [9] |
G. Li, P. Lu, P. Weinstein, A. Urban, S. Tong, N. Ryti, et al., The burden of El Niño–Southern Oscillation-related dengue attributable to anthropogenic climate change: A multicountry modelling study, Lancet Planet. Heath, 10 (2026), 101454. https://doi.org/10.1016/j.lanplh.2026.101454 doi: 10.1016/j.lanplh.2026.101454
|
| [10] |
M. Hurtado-Díaz, H. Riojas-Rodríguez, S. J. Rothenberg, H. Gomez-Dantés, E. Cifuentes, Impact of climate variability on the incidence of dengue in Mexico, Trop. Med. Int. Health, 12 (2007), 1327–1337. https://doi.org/10.1111/j.1365-3156.2007.01930.x doi: 10.1111/j.1365-3156.2007.01930.x
|
| [11] |
M. Gharbi, P. Quenel, J. Gustave, S. Cassadou, G. L. Ruche, L. Girdary, et al., Time series analysis of dengue incidence in Guadeloupe, French West Indies: Forecasting models using climate variables as predictors, BMC Infect. Dis., 11 (2011), 166. https://doi.org/10.1186/1471-2334-11-166 doi: 10.1186/1471-2334-11-166
|
| [12] |
O. J. Brady, P. W. Gething, S. Bhatt, J. P. Messina, J. S. Brownstein, A. G. Hoen, et al., Refining the global spatial limits of dengue virus transmission by evidence-based consensus, PLoS Negl. Trop. Dis., 6 (2012), e1760. https://doi.org/10.1371/journal.pntd.0001760 doi: 10.1371/journal.pntd.0001760
|
| [13] |
J. P. Messina, O. J. Brady, N. Golding, M. U. G. Kraemer, G. R. W. Wint, S. E. Ray, et al., The current and future global distribution and population at risk of dengue, Nat. Microbiol., 4 (2019), 1508–1515. https://doi.org/10.1038/s41564-019-0476-8 doi: 10.1038/s41564-019-0476-8
|
| [14] |
M. H. Bukhari, M. Y. Shad, U. S. D. T. Nguyen, C. J. A. Treviño, W. Jung, W. U. Bajwa, et al., A Bayesian spatiotemporal approach to modelling arboviral diseases in Mexico, Trans. R. Soc. Trop. Med. Hyg., 117 (2023), 867–874. https://doi.org/10.1093/trstmh/trad064 doi: 10.1093/trstmh/trad064
|
| [15] |
R. Lowe, C. Barcellos, C. A. S. Coelho, T. C. Bailey, G. E. Coelho, R. Graham, et al., Dengue outlook for the World Cup in Brazil: An early warning model framework driven by real-time seasonal climate forecasts, Lancet Infect. Dis., 14 (2014), 619–626. https://doi.org/10.1016/S1473-3099(14)70781-9 doi: 10.1016/S1473-3099(14)70781-9
|
| [16] |
C. Mills, C. A. Donnelly, Climate-based modelling and forecasting of dengue in three endemic departments of Peru, PLoS Negl. Trop. Dis., 18 (2024), e0012596. https://doi.org/10.1371/journal.pntd.0012596 doi: 10.1371/journal.pntd.0012596
|
| [17] |
S. Wu, A. G. Meyer, L. Clemente, L. M. Stolerman, F. Lu, A. Majumder, et al., Ensemble approaches for short-term dengue fever forecasts, Proc. Natl. Acad. Sci. U.S.A., 122 (2025), e2422335122. https://doi.org/10.1073/pnas.2422335122 doi: 10.1073/pnas.2422335122
|
| [18] |
X. Chen, P. Moraga, Assessing dengue forecasting methods: A comparative study of statistical models and machine learning techniques in Rio de Janeiro, Brazil, Trop. Med. Health, 53 (2025), 52. https://doi.org/10.1186/s41182-025-00723-7 doi: 10.1186/s41182-025-00723-7
|
| [19] |
J. M. Caldwell, A. D. LaBeaud, E. F. Lambin, A. M. Stewart-Ibarra, B. A. Ndenga, F. M. Mutuku, et al., Climate predicts geographic and temporal variation in mosquito-borne disease dynamics on two continents, Nat. Commun., 12 (2021), 1233. https://doi.org/10.1038/s41467-021-21496-7 doi: 10.1038/s41467-021-21496-7
|
| [20] |
Y. Li, Q. Dou, Y. Lu, H. Xiang, X. Yu, S. Liu, Effects of ambient temperature and precipitation on the risk of dengue fever: A systematic review and updated meta-analysis, Environ. Res., 191 (2020), 110043. https://doi.org/10.1016/j.envres.2020.110043 doi: 10.1016/j.envres.2020.110043
|
| [21] |
CONAPO, Población a Mitad de Año por Municipio y Grupos Quinquenales de Edad (1990–2040), 2025. Available from: https://www.datos.gob.mx/dataset/proyecciones-de-poblacion/resource/3c3092be-583e-4490-8c23-67ef9a64b198. |
| [22] |
INEGI, Marco de Referencia ITRF en México y su Relación con WGS84 y NAD27, 2019. Available from: https://www.inegi.org.mx/contenidos/temas/gnss/doc/702825109226.pdf. |
| [23] |
J. Muñoz-Sabater, E. Dutra, A. Agustí-Panareda, A. Albergel, G. Arduini, G. Balsamo, et al., ERA5-Land: A state-of-the-art global reanalysis dataset for land applications, Earth Syst. Sci. Data, 13 (2021), 4349–4383. https://doi.org/10.5194/essd-13-4349-2021 doi: 10.5194/essd-13-4349-2021
|
| [24] |
European Centre for Medium-Range Weather Forecasts (ECMWF), European Centre for Medium-Range Weather Forecasts, 2025. Available from: https://www.ecmwf.int/. |
| [25] |
C. J. Willmott, K. Matsuura, Smart interpolation of annually averaged air temperature in the United States, J. Appl. Meteorol. Climatol., 34 (1995), 2577–2586. https://doi.org/10.1175/1520-0450(1995)034<2577:SIOAAA>2.0.CO;2 doi: 10.1175/1520-0450(1995)034<2577:SIOAAA>2.0.CO;2
|
| [26] |
P. Zhao, Z. He, A first evaluation of ERA5-land reanalysis temperature product over the Chinese Qilian mountains, Front. Earth Sci., 10 (2022), 907730. https://doi.org/10.3389/feart.2022.907730 doi: 10.3389/feart.2022.907730
|
| [27] |
R. J. Hijmans, Cross-validation of species distribution models: Removing spatial sorting bias and calibration with a null model, Ecology, 93 (2012), 679–688. https://doi.org/10.1890/11-0826.1 doi: 10.1890/11-0826.1
|
| [28] |
J. Zou, N. Lu, H. Jiang, J. Qin, L. Yao, Y. Xin, F. Su, Performance of air temperature from ERA5-Land reanalysis in coastal urban agglomeration of Southeast China, Sci. Total Environ., 828 (2022), 154459. https://doi.org/10.1016/j.scitotenv.2022.154459 doi: 10.1016/j.scitotenv.2022.154459
|
| [29] |
Y. R. Wang, D. O. Hessen, B. H. Samset, F. Stordal, Evaluating global and regional land warming trends in the past decades with both MODIS and ERA5-Land land surface temperature data, Remote Sens. Environ., 280 (2022), 113181. https://doi.org/10.1016/j.rse.2022.113181 doi: 10.1016/j.rse.2022.113181
|
| [30] |
N. Gorelick, M. Hancher, M. Dixon, S. Ilyushchenko, D. Thau, R. Moore, Google Earth Engine: Planetary-scale geospatial analysis for everyone, Remote Sens. Environ., 202 (2017), 18–27. https://doi.org/10.1016/j.rse.2017.06.031 doi: 10.1016/j.rse.2017.06.031
|
| [31] |
M. Chan, M. A. Johansson, The incubation periods of dengue viruses, PLoS One, 7 (2012), e50972. https://doi.org/10.1371/journal.pone.0050972 doi: 10.1371/journal.pone.0050972
|
| [32] |
J. A. Nelder, R. W. M. Wedderburn, Generalized linear models, J. R. Stat. Soc. A, 135 (1972), 370–384. https://doi.org/10.2307/2344614 doi: 10.2307/2344614
|
| [33] |
C. E. McCulloch, J. M. Neuhaus, Generalized linear mixed models: Estimation and inference, SAGE Handb. Multilevel Model., 2013 (2013), 271–286. |
| [34] |
P. McCullagh, J. A. Nelder, Generalized Linear Models, 2nd Edition, Chapman and Hall, London, 1989. |
| [35] |
A. C. Cameron, P. K. Trivedi, Regression Analysis of Count Data, 2nd Edition, Cambridge University Press, Cambridge, 2013. |
| [36] |
J. M. Hilbe, Negative Binomial Regression, 2nd Edition, Cambridge University Press, Cambridge, 2011. |
| [37] |
H. Rue, S. Martino, N. Chopin, Approximate Bayesian inference for latent Gaussian models by using integrated nested Laplace approximations, J. R. Stat. Soc. B, 71 (2009), 319–392. https://doi.org/10.1111/j.1467-9868.2008.00700.x doi: 10.1111/j.1467-9868.2008.00700.x
|
| [38] |
F. Lindgren, H. Rue, J. Lindström, An explicit link between Gaussian fields and Gaussian Markov random fields: the stochastic partial differential equation approach, J. R. Stat. Soc. B, 73 (2011), 423–498. https://doi.org/10.1111/j.1467-9868.2011.00777.x doi: 10.1111/j.1467-9868.2011.00777.x
|
| [39] |
J. Besag, J. York, A. Mollié, Bayesian image restoration, with two applications in spatial statistics, Ann. Inst. Stat. Math., 43 (1991), 1–20. https://doi.org/10.1007/BF00116466 doi: 10.1007/BF00116466
|
| [40] |
P. C. Bürkner, brms: An R package for Bayesian multilevel models using Stan, J. Stat. Software, 80 (2017), 1–28. https://doi.org/10.18637/jss.v080.i01 doi: 10.18637/jss.v080.i01
|
| [41] |
P. C. Bürkner, Advanced Bayesian multilevel modeling with the R package brms, R J., 10 (2018), 395–411. https://doi.org/10.32614/RJ-2018-017 doi: 10.32614/RJ-2018-017
|
| [42] |
P. C. Bürkner, Bayesian item response modeling in R with brms and Stan, J. Stat. Software, 100 (2021), 1–54. https://doi.org/10.18637/jss.v100.i05 doi: 10.18637/jss.v100.i05
|
| [43] |
J. Escobar-Mesa, H. Gomez-Dantes, Dengue fever transmission in Veracruz, Mexico: An ecological approach to disease control, Salud Publ. Mex., 45 (2003), 43–53. |
| [44] |
O. Mendoza-Cano, R. Danis-Lozano, X. Trujillo, M. Huerta, M. Rios-Silva, A. Lugo-Radillo, et al., Spatial patterns and clustering of dengue incidence in Mexico: Analysis of Moran's index across 2471 municipalities from 2022 to 2024, PLoS One, 20 (2025), e0324754. https://doi.org/10.1371/journal.pone.0324754 doi: 10.1371/journal.pone.0324754
|
 mbe-23-11-118-Supplementary.pdf |
 |
Figures(11) / Tables(4)

Inder Tecuapetla-Gómez, Héctor De la Torre Gutiérrez, Mayra Núñez-López, L. Leticia Ramírez-Ramírez. A multiscale statistical analysis of the relationship between climate variability and dengue incidence in Mexico[J]. Mathematical Biosciences and Engineering, 2026, 23(11): 3436-3469. doi: 10.3934/mbe.2026118

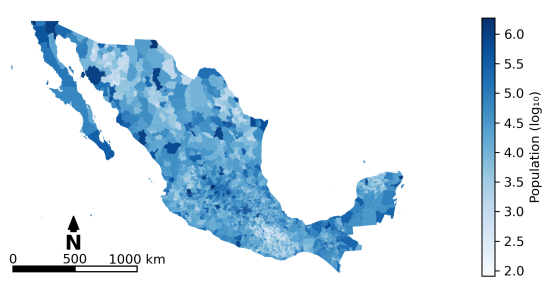
Map of Mexico that displays the logarithm of the population in each municipality, according to the Population and Housing Census 2020, INEGI. Source:
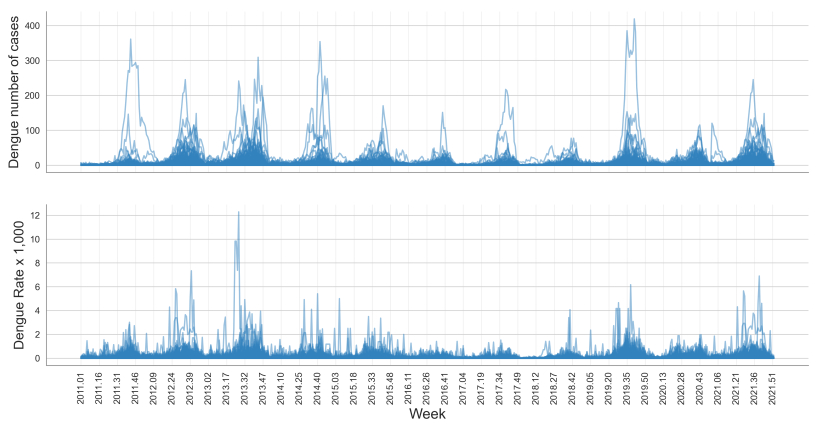
Weekly dengue number of cases and rate (per 1000 people) by municipality for the period 2011–2021. Source: General Directorate of Epidemiology of the Mexican Ministry of Health:
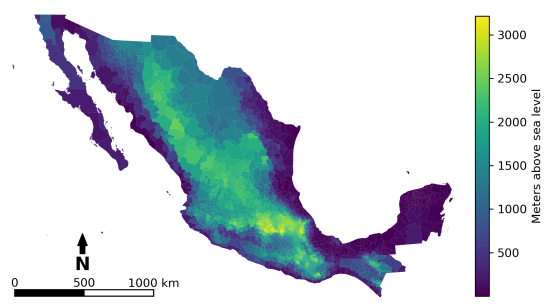
Average municipal elevation in meters above sea level. Source: Mexican Elevation Continuum and Digital Elevation Models, INEGI.
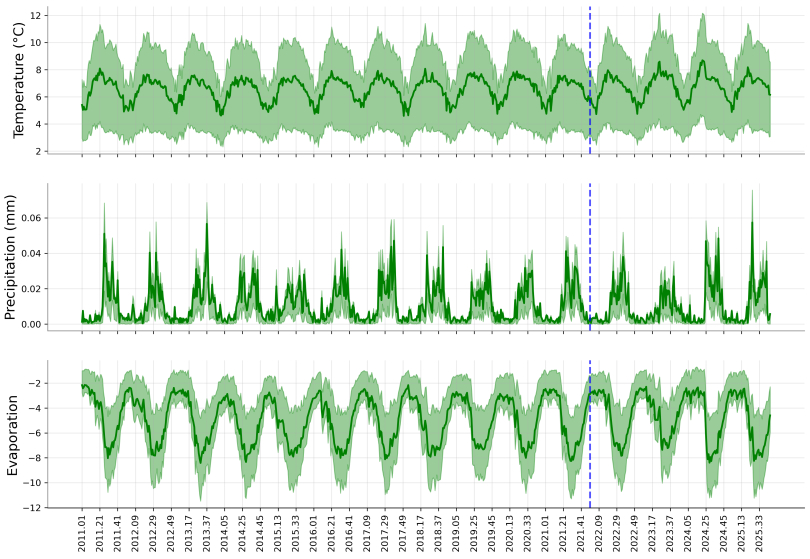
Weekly environmental variables: mean (green lines) and interquartile range (green shaded areas) of the municipality series (2011–2025). The blue dashed lines indicate the series from 2011 to 2021
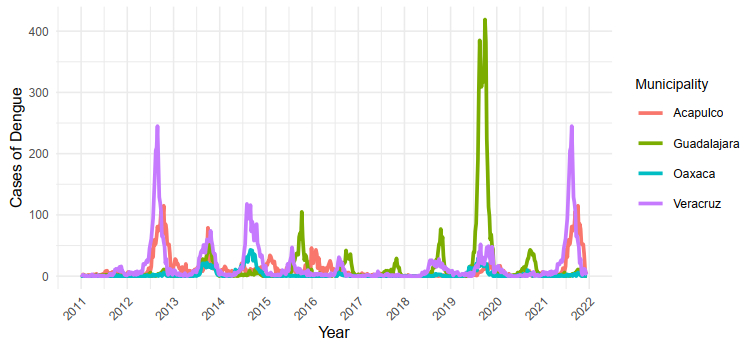
Dengue weekly case incidence during 2011–2021 in Acapulco, Guadalajara, Oaxaca, and Veracruz
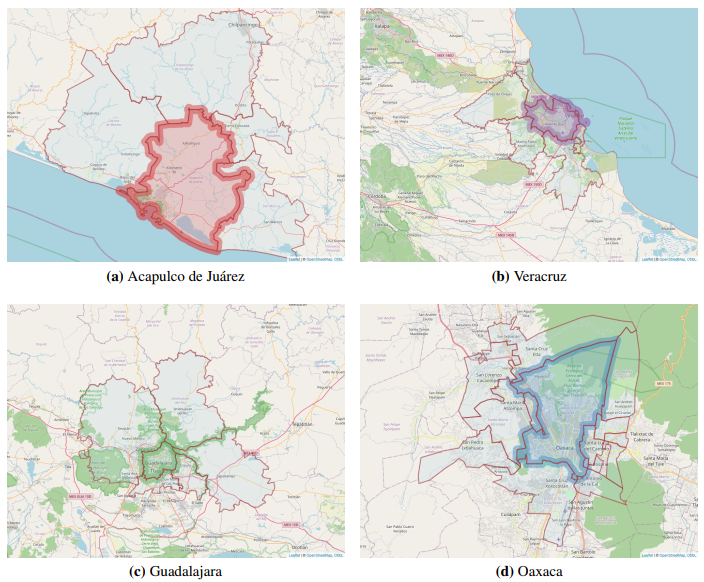
Geographic location of the municipalities included in the study areas. This contextual figure illustrates the spatial positioning of the selected municipalities and supports the description of the methodological framework
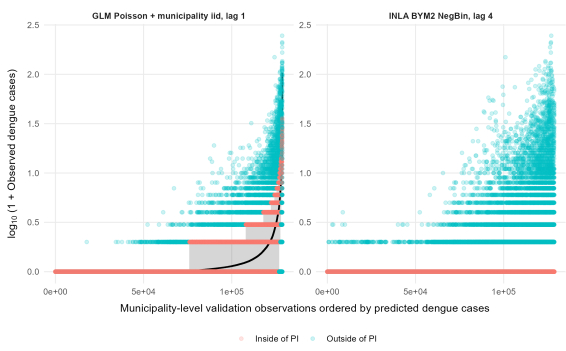
Municipality-week $ \log_{10}(1+\text{observed}) $ vs. predicted counts in the validation set in 2021. The shaded grey area corresponds to the prediction intervals, and the paired data are colored according to whether they fall within or outside the resulting intervals
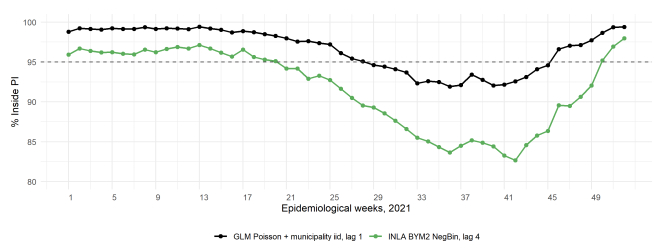
Weekly coverage (%) of the 95% prediction intervals for observed municipality-level dengue cases for 2021
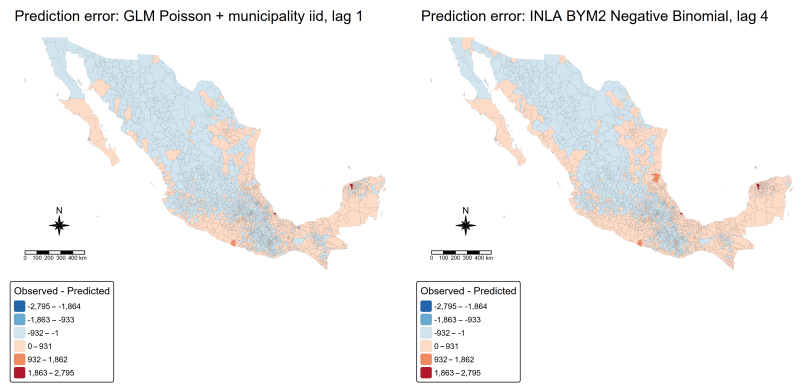
Municipality-signed error for the total dengue predictions in 2021
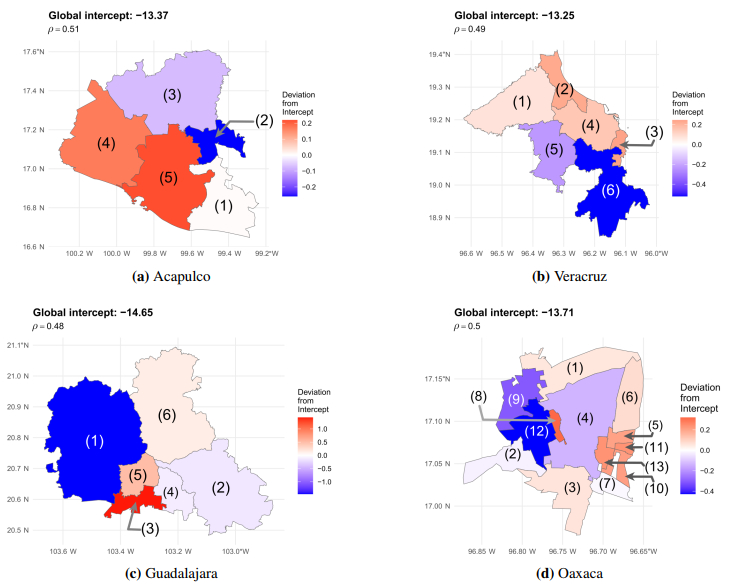
Municipality-specific conditional autoregressive (CAR) intercept deviations estimated under the negative binomial (Acapulco, Oaxaca, and Veracruz) and Poisson (Guadalajara) families of the local dengue models. Each subfigure corresponds to one focal metropolitan area and displays the posterior spatial deviations for its surrounding municipalities
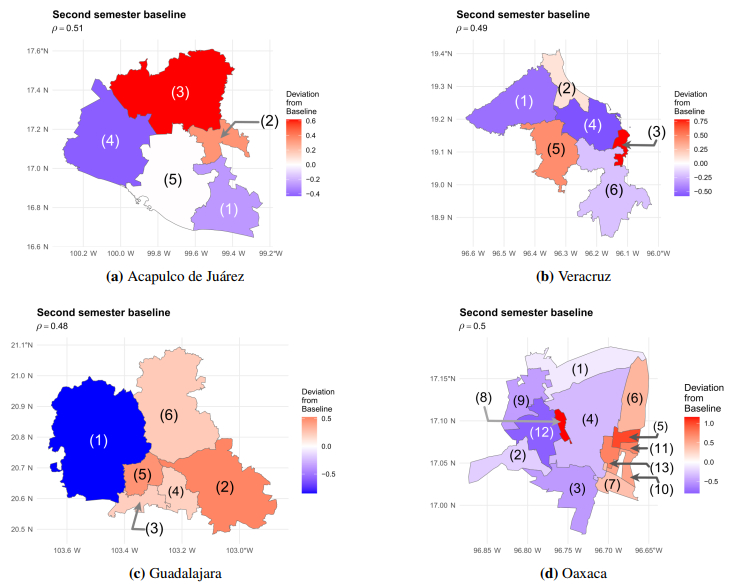
Municipality-specific CAR semester effects estimated under the negative binomial (Acapulco, Oaxaca, and Veracruz) and Poisson (Guadalajara) families of the local dengue models. Semester-specific CAR random effects revealed modest deviations in Acapulco and Guadalajara, with Chilpancingo de los Bravo (3) and Zapotlanejo (2) tending positive and Zapopan (1) negative. Oaxaca displayed sharper contrasts, with San Jacinto Amilpas (8) and San Agustín Yatareni (5) strongly positive and Santa María Atzompa (12) clearly negative. Veracruz showed a mixed pattern, highlighted by Boca del Río (3) tending positive and Veracruz city (4) negative




 DownLoad: