We formulated a multiscale epidemic model linking within-host viral dynamics to population transmission under resistance-mediated loss of treatment efficacy. The within-host subsystem tracked target cells, infected cells, viral load, and immune effectors, while an SEIR model represents population spread, vaccination, and recovery. We established positivity and invariance, derived a quasi-steady population model through singular perturbation, and provided a finite-horizon reduction error estimate that included the effects of initial conditions and changes in control. For constant controls and frozen efficacy, a next-generation matrix yielded a control reproduction number and local and global disease-free stability thresholds. A finite-horizon control problem compared vaccination and treatment schedules under progressive efficacy decay, using numerically optimized open-loop policies and explicitly defined baseline controls. In 180-day full-model simulations at baseline resistance, the computed policy had a composite cost of 8623.88, compared with 9638.97 for constant maximal control, while cumulative incidence was 0.240 versus 0.221. A cost-component analysis and a comparison without the explicit viral-load penalty revealed how the objective weights affect these rankings. Under active treatment, resistance influences cumulative incidence, and a synthetic negative-binomial fit reproduces weekly exposure means.
Citation: Muattar Abdimuradova, Sherbek Razzaqov, Yerimbet Aitzhanov, Shirali Kadyrov. Thresholds and control in a multiscale epidemic model[J]. Mathematical Biosciences and Engineering, 2026, 23(10): 3184-3210. doi: 10.3934/mbe.2026110
We formulated a multiscale epidemic model linking within-host viral dynamics to population transmission under resistance-mediated loss of treatment efficacy. The within-host subsystem tracked target cells, infected cells, viral load, and immune effectors, while an SEIR model represents population spread, vaccination, and recovery. We established positivity and invariance, derived a quasi-steady population model through singular perturbation, and provided a finite-horizon reduction error estimate that included the effects of initial conditions and changes in control. For constant controls and frozen efficacy, a next-generation matrix yielded a control reproduction number and local and global disease-free stability thresholds. A finite-horizon control problem compared vaccination and treatment schedules under progressive efficacy decay, using numerically optimized open-loop policies and explicitly defined baseline controls. In 180-day full-model simulations at baseline resistance, the computed policy had a composite cost of 8623.88, compared with 9638.97 for constant maximal control, while cumulative incidence was 0.240 versus 0.221. A cost-component analysis and a comparison without the explicit viral-load penalty revealed how the objective weights affect these rankings. Under active treatment, resistance influences cumulative incidence, and a synthetic negative-binomial fit reproduces weekly exposure means.

| [1] |
W. O. Kermack, A. G. McKendrick, A contribution to the mathematical theory of epidemics, Proc. Roy. Soc. A, 115 (1927), 700–721. https://doi.org/10.1098/rspa.1927.0118 doi: 10.1098/rspa.1927.0118
|
| [2] |
R. M. Anderson, R. M. May, Population biology of infectious diseases: Part Ⅰ, Nature, 280 (1979), 361–367. https://doi.org/10.1038/280361a0 doi: 10.1038/280361a0
|
| [3] |
H. W. Hethcote, The mathematics of infectious diseases, SIAM Rev., 42 (2000), 599–653. https://doi.org/10.1137/S0036144500371907 doi: 10.1137/S0036144500371907
|
| [4] |
F. Brauer, The Kermack–McKendrick epidemic model revisited, Math. Biosci., 198 (2005), 119–131. https://doi.org/10.1016/j.mbs.2005.07.006 doi: 10.1016/j.mbs.2005.07.006
|
| [5] |
P. van den Driessche, J. Watmough, Reproduction numbers and sub-threshold endemic equilibria for compartmental models of disease transmission, Math. Biosci., 180 (2002), 29–48. https://doi.org/10.1016/S0025-5564(02)00108-6 doi: 10.1016/S0025-5564(02)00108-6
|
| [6] |
O. Diekmann, J. A. P. Heesterbeek, M. G. Roberts, The construction of next-generation matrices for compartmental epidemic models, J. R. Soc. Interface, 7 (2010), 873–885. https://doi.org/10.1098/rsif.2009.0386 doi: 10.1098/rsif.2009.0386
|
| [7] |
O. Diekmann, J. A. P. Heesterbeek, Mathematical Epidemiology of Infectious Diseases, Wiley, Chichester, 2000. |
| [8] |
A. L. Lloyd, Destabilization of epidemic models with the inclusion of realistic distributions of infectious periods, Proc. Roy. Soc. B, 268 (2001), 985–993. https://doi.org/10.1098/rspb.2001.1599 doi: 10.1098/rspb.2001.1599
|
| [9] |
H. J. Wearing, P. Rohani, M. J. Keeling, Appropriate models for the management of infectious diseases, PLoS Med., 2 (2005), e174. https://doi.org/10.1371/journal.pmed.0020174 doi: 10.1371/journal.pmed.0020174
|
| [10] |
Z. Feng, D. Xu, H. Zhao, Epidemiological models with non-exponentially distributed disease stages and applications to disease control, Bull. Math. Biol., 69 (2007), 1511–1536. https://doi.org/10.1007/s11538-006-9174-9 doi: 10.1007/s11538-006-9174-9
|
| [11] |
D. D. Ho, A. U. Neumann, A. S. Perelson, W. Chen, J. M. Leonard, M. Markowitz, Rapid turnover of plasma virions and CD4 lymphocytes in HIV-1 infection, Nature, 373 (1995), 123–126. https://doi.org/10.1038/373123a0 doi: 10.1038/373123a0
|
| [12] |
A. S. Perelson, A. U. Neumann, M. Markowitz, J. M. Leonard, D. D. Ho, HIV-1 dynamics in vivo: Virion clearance rate, infected cell life-span, and viral generation time, Science, 271 (1996), 1582–1586. https://doi.org/10.1126/science.271.5255.1582 doi: 10.1126/science.271.5255.1582
|
| [13] |
M. A. Nowak, C. R. M. Bangham, Population dynamics of immune responses to persistent viruses, Science, 272 (1996), 74–79. https://doi.org/10.1126/science.272.5258.74 doi: 10.1126/science.272.5258.74
|
| [14] |
P. W. Nelson, J. D. Murray, A. S. Perelson, A model of HIV-1 pathogenesis that includes an intracellular delay, Math. Biosci., 163 (2000), 201–215. https://doi.org/10.1016/S0025-5564(99)00055-3 doi: 10.1016/S0025-5564(99)00055-3
|
| [15] |
P. Baccam, C. Beauchemin, C. A. Macken, F. G. Hayden, A. S. Perelson, Kinetics of influenza A virus infection in humans, J. Virol., 80 (2006), 7590–7599. https://doi.org/10.1128/JVI.01623-05 doi: 10.1128/JVI.01623-05
|
| [16] |
A. Handel, I. M. Longini Jr., R. Antia, Towards a quantitative understanding of the within-host dynamics of influenza A infections, J. R. Soc. Interface, 7 (2010), 35–47. https://doi.org/10.1098/rsif.2009.0067 doi: 10.1098/rsif.2009.0067
|
| [17] |
C. Beauchemin, J. Samuel, J. Tuszynski, A simple cellular automaton model for influenza A viral infections, J. Theoret. Biol., 232 (2005), 223–234. https://doi.org/10.1016/j.jtbi.2004.08.001 doi: 10.1016/j.jtbi.2004.08.001
|
| [18] |
C. Beauchemin, A. Handel, A review of mathematical models of influenza A infections within a host or cell culture: Lessons learned and challenges ahead, BMC Public Health, 11 (2011), S7. https://doi.org/10.1186/1471-2458-11-S1-S7 doi: 10.1186/1471-2458-11-S1-S7
|
| [19] |
M. Lipsitch, E. R. Moxon, Virulence and transmissibility of pathogens: What is the relationship, Trends Microbiol., 5 (1997), 31–37. https://doi.org/10.1016/S0966-842X(97)81772-6 doi: 10.1016/S0966-842X(97)81772-6
|
| [20] |
J. W. G. Doran, R. N. Thompson, C. A. Yates, R. Bowness, Mathematical methods for scaling from within-host to population-scale in infectious disease systems, Epidemics, 45 (2023), 100724. https://doi.org/10.1016/j.epidem.2023.100724 doi: 10.1016/j.epidem.2023.100724
|
| [21] |
H. Gaff, E. Schaefer, Optimal control applied to vaccination and treatment strategies for various epidemiological models, Math. Biosci. Eng., 6 (2009), 469–492. https://doi.org/10.3934/mbe.2009.6.469 doi: 10.3934/mbe.2009.6.469
|
| [22] |
A. A. Lashari, Optimal control of an SIR epidemic model with a saturated treatment, Appl. Math. Inf. Sci., 10 (2016), 185–194. https://doi.org/10.18576/amis/100117 doi: 10.18576/amis/100117
|
| [23] |
S. Lenhart, J. T. Workman, Optimal Control Applied to Biological Models, Chapman & Hall/CRC, Boca Raton, 2007. |
| [24] |
H. K. Khalil, Nonlinear Systems, 3rd ed., Prentice Hall, Upper Saddle River, 2002. |
| [25] |
S. Bonhoeffer, R. M. May, G. M. Shaw, M. A. Nowak, Virus dynamics and drug therapy, Proc. Natl. Acad. Sci. USA, 94 (1997), 6971–6976. https://doi.org/10.1073/pnas.94.13.6971 doi: 10.1073/pnas.94.13.6971
|
| [26] |
H. K. Alexander, S. Bonhoeffer, Pre-existence and emergence of drug resistance in a generalized model of intra-host viral dynamics, Epidemics, 4 (2012), 187–202. https://doi.org/10.1016/j.epidem.2012.10.001 doi: 10.1016/j.epidem.2012.10.001
|
| [27] |
C. Fraser, T. D. Hollingsworth, R. Chapman, F. de Wolf, W. P. Hanage, Variation in HIV-1 set-point viral load: Epidemiological analysis and an evolutionary hypothesis, Proc. Natl. Acad. Sci. USA, 104 (2007), 17441–17446. https://doi.org/10.1073/pnas.0708559104 doi: 10.1073/pnas.0708559104
|
| [28] |
A. Handel, P. Rohani, Crossing the scale from within-host infection dynamics to between-host transmission fitness: A discussion of current assumptions and knowledge, Philos. Trans. Roy. Soc. B, 370 (2015), 20140302. https://doi.org/10.1098/rstb.2014.0302 doi: 10.1098/rstb.2014.0302
|
| [29] |
A. Marc, M. Kerioui, F. Blanquart, J. Bertrand, O. Mitjà, M. Corbacho-Monné, et al., Quantifying the relationship between SARS-CoV-2 viral load and infectiousness, eLife, 10 (2021), e69302. https://doi.org/10.7554/eLife.69302 doi: 10.7554/eLife.69302
|
| [30] |
R. Ke, C. Zitzmann, D. D. Ho, R. M. Ribeiro, A. S. Perelson, In vivo kinetics of SARS-CoV-2 infection and its relationship with a person's infectiousness, Proc. Natl. Acad. Sci. USA, 118 (2021), e2111477118. https://doi.org/10.1073/pnas.2111477118 doi: 10.1073/pnas.2111477118
|
| [31] |
C. Barril, À. Calsina, J. Ripoll, A practical approach to $R_0$ in continuous-time ecological models, Math. Methods Appl. Sci., 41 (2018), 8432–8445. https://doi.org/10.1002/mma.4673 doi: 10.1002/mma.4673
|
| [32] |
D. Breda, F. Florian, J. Ripoll, R. Vermiglio, Efficient numerical computation of the basic reproduction number for structured populations, J. Comput. Appl. Math., 384 (2021), 113165. https://doi.org/10.1016/j.cam.2020.113165 doi: 10.1016/j.cam.2020.113165
|
Figures(7) / Tables(7)

Muattar Abdimuradova, Sherbek Razzaqov, Yerimbet Aitzhanov, Shirali Kadyrov. Thresholds and control in a multiscale epidemic model[J]. Mathematical Biosciences and Engineering, 2026, 23(10): 3184-3210. doi: 10.3934/mbe.2026110

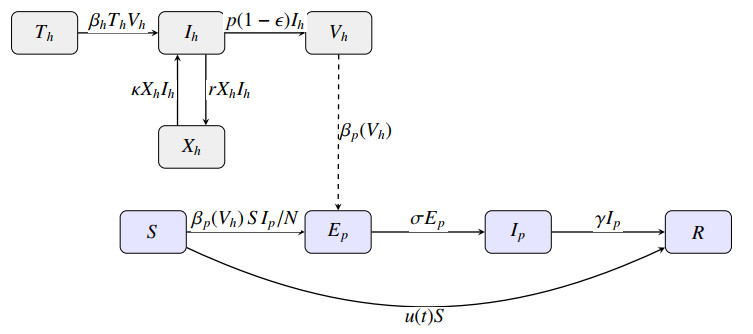
Multiscale flow diagram. The within-host subsystem (gray) couples to the population SEIR system (blue) through the viral-load-dependent transmission coefficient $ \beta_p(V_h) $. Treatment efficacy $ \epsilon(t) $ modulates viral production, while vaccination $ u(t) $ moves susceptible individuals to the recovered class
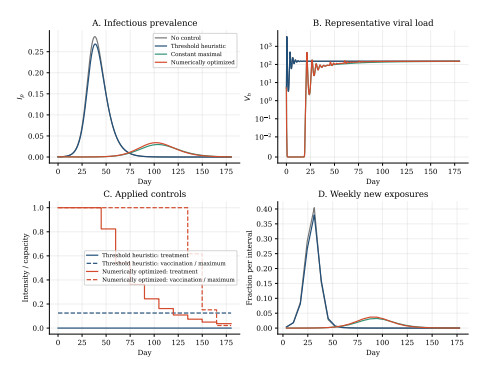
Full-model policy comparison at $ \alpha = 0.0252 $ day$ ^{-1} $: (A) infectious prevalence for four policies; (B) representative viral load on a symlog scale, including rebound; (C) heuristic and numerically optimized controls, with vaccination normalized by $ u_{\max} $; and (D) weekly new-exposure fractions, with the final interval truncated at day 180
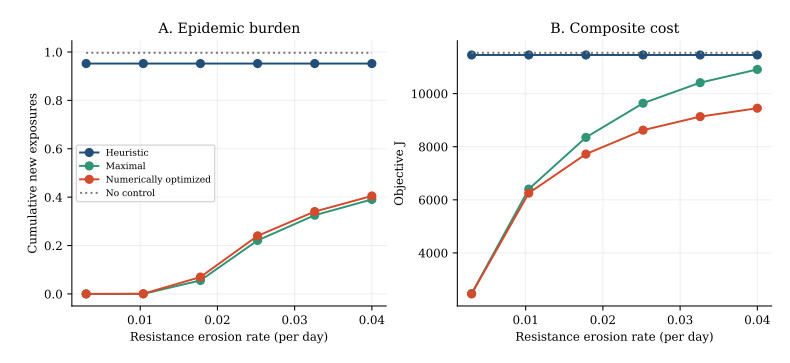
Resistance sweep for all four policies: (A) cumulative new exposures; and (B) composite objective cost. The heuristic has no treatment and is independent of $ \alpha $, while the treatment-active schedules permit rebound as efficacy erodes
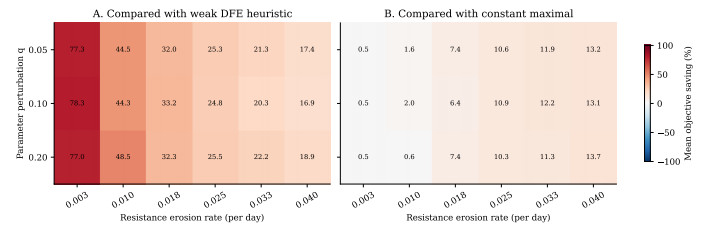
Paired mean cost savings (%) for the fixed numerically optimized schedules under resistance and parameter perturbations: (A) relative to the weak DFE heuristic; and (B) relative to constant maximal control. Each cell uses the same six draws; $ q $ denotes parameter perturbations
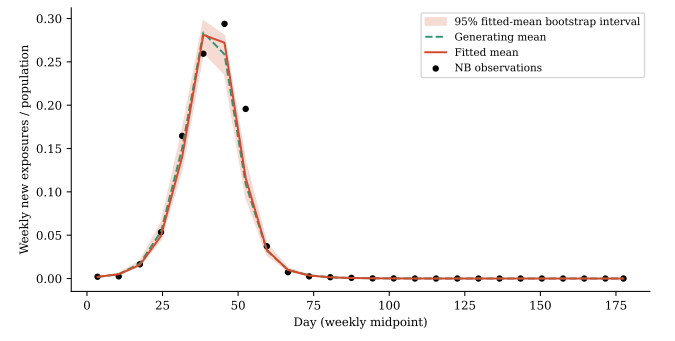
Synthetic negative-binomial calibration under $ (u, a) = (0.0015, 0.5) $: observed weekly fractions, generating mean, lowest returned likelihood candidate, and pointwise interval from successful parametric-bootstrap refits. Curve agreement does not establish parameter identifiability; the band excludes future count noise and failed refits
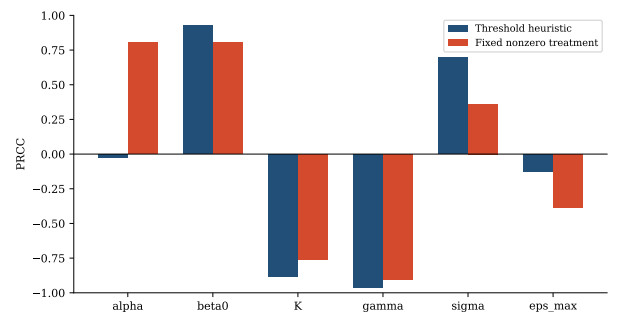
PRCC for cumulative new exposures using the same 250-point Latin hypercube under the threshold heuristic and fixed treatment-active policy $ (u, a) = (0.0015, 0.8) $; the heuristic's efficacy parameters have no structural effect because its treatment intensity is zero
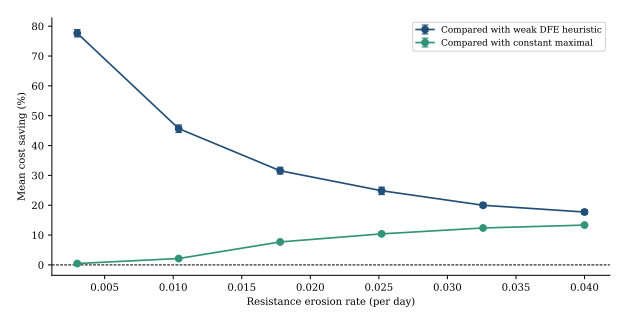
Paired mean cost savings of fixed numerically optimized schedules against the weak DFE heuristic and constant maximal control under 12 common parameter draws at each resistance value; error bars are percentile bootstrap intervals for the simulated mean




 DownLoad: