Research article Special Issues

Age-dependent final size equation to anticipate mortality impact of COVID-19 in China

  • Before reopening society in December 2022, China had not achieved sufficiently high vaccination coverage among people aged 80 years and older, who are vulnerable to severe infection and death owing to COVID-19. Suddenly ending the zero-COVID policy was anticipated to lead to substantial mortality. To investigate the mortality impact of COVID-19, we devised an age-dependent transmission model to derive a final size equation, permitting calculation of the expected cumulative incidence. Using an age-specific contact matrix and published estimates of vaccine effectiveness, final size was computed as a function of the basic reproduction number, R0. We also examined hypothetical scenarios in which third-dose vaccination coverage was increased in advance of the epidemic, and also in which mRNA vaccine was used instead of inactivated vaccines. Without additional vaccination, the final size model indicated that a total of 1.4 million deaths (half of which were among people aged 80 years and older) were anticipated with an assumed R0 of 3.4. A 10% increase in third-dose coverage would prevent 30,948, 24,106, and 16,367 deaths, with an assumed second-dose effectiveness of 0%, 10%, and 20%, respectively. With mRNA vaccine, the mortality impact would have been reduced to 1.1 million deaths. The experience of reopening in China indicates the critical importance of balancing pharmaceutical and non-pharmaceutical interventions. Ensuring sufficiently high vaccination coverage is vital in advance of policy changes.

    Citation: Yuri Amemiya, Tianwen Li, Hiroshi Nishiura. Age-dependent final size equation to anticipate mortality impact of COVID-19 in China[J]. Mathematical Biosciences and Engineering, 2023, 20(6): 11353-11366. doi: 10.3934/mbe.2023503

    Related Papers:

    [1] Fang Wang, Lianying Cao, Xiaoji Song . Mathematical modeling of mutated COVID-19 transmission with quarantine, isolation and vaccination. Mathematical Biosciences and Engineering, 2022, 19(8): 8035-8056. doi: 10.3934/mbe.2022376
    [2] Salman Safdar, Calistus N. Ngonghala, Abba B. Gumel . Mathematical assessment of the role of waning and boosting immunity against the BA.1 Omicron variant in the United States. Mathematical Biosciences and Engineering, 2023, 20(1): 179-212. doi: 10.3934/mbe.2023009
    [3] Julien Arino, Fred Brauer, P. van den Driessche, James Watmough, Jianhong Wu . A final size relation for epidemic models. Mathematical Biosciences and Engineering, 2007, 4(2): 159-175. doi: 10.3934/mbe.2007.4.159
    [4] Sarafa A. Iyaniwura, Rabiu Musa, Jude D. Kong . A generalized distributed delay model of COVID-19: An endemic model with immunity waning. Mathematical Biosciences and Engineering, 2023, 20(3): 5379-5412. doi: 10.3934/mbe.2023249
    [5] Julijana Gjorgjieva, Kelly Smith, Gerardo Chowell, Fabio Sánchez, Jessica Snyder, Carlos Castillo-Chavez . The Role of Vaccination in the Control of SARS. Mathematical Biosciences and Engineering, 2005, 2(4): 753-769. doi: 10.3934/mbe.2005.2.753
    [6] Chentong Li, Jinhu Xu, Jiawei Liu, Yicang Zhou . The within-host viral kinetics of SARS-CoV-2. Mathematical Biosciences and Engineering, 2020, 17(4): 2853-2861. doi: 10.3934/mbe.2020159
    [7] Xiaojing Wang, Yu Liang, Jiahui Li, Maoxing Liu . Modeling COVID-19 transmission dynamics incorporating media coverage and vaccination. Mathematical Biosciences and Engineering, 2023, 20(6): 10392-10403. doi: 10.3934/mbe.2023456
    [8] Tahir Khan, Roman Ullah, Gul Zaman, Jehad Alzabut . A mathematical model for the dynamics of SARS-CoV-2 virus using the Caputo-Fabrizio operator. Mathematical Biosciences and Engineering, 2021, 18(5): 6095-6116. doi: 10.3934/mbe.2021305
    [9] Allison Fisher, Hainan Xu, Daihai He, Xueying Wang . Effects of vaccination on mitigating COVID-19 outbreaks: a conceptual modeling approach. Mathematical Biosciences and Engineering, 2023, 20(3): 4816-4837. doi: 10.3934/mbe.2023223
    [10] A. M. Elaiw, Raghad S. Alsulami, A. D. Hobiny . Global dynamics of IAV/SARS-CoV-2 coinfection model with eclipse phase and antibody immunity. Mathematical Biosciences and Engineering, 2023, 20(2): 3873-3917. doi: 10.3934/mbe.2023182
  • Before reopening society in December 2022, China had not achieved sufficiently high vaccination coverage among people aged 80 years and older, who are vulnerable to severe infection and death owing to COVID-19. Suddenly ending the zero-COVID policy was anticipated to lead to substantial mortality. To investigate the mortality impact of COVID-19, we devised an age-dependent transmission model to derive a final size equation, permitting calculation of the expected cumulative incidence. Using an age-specific contact matrix and published estimates of vaccine effectiveness, final size was computed as a function of the basic reproduction number, R0. We also examined hypothetical scenarios in which third-dose vaccination coverage was increased in advance of the epidemic, and also in which mRNA vaccine was used instead of inactivated vaccines. Without additional vaccination, the final size model indicated that a total of 1.4 million deaths (half of which were among people aged 80 years and older) were anticipated with an assumed R0 of 3.4. A 10% increase in third-dose coverage would prevent 30,948, 24,106, and 16,367 deaths, with an assumed second-dose effectiveness of 0%, 10%, and 20%, respectively. With mRNA vaccine, the mortality impact would have been reduced to 1.1 million deaths. The experience of reopening in China indicates the critical importance of balancing pharmaceutical and non-pharmaceutical interventions. Ensuring sufficiently high vaccination coverage is vital in advance of policy changes.


    Abbreviation: NPIs: non-pharmaceutical interventions; IFR: infection fatality risk

    The COVID-19 pandemic has had a profound impact on social life and life expectancy worldwide. Since its emergence in late 2019, COVID-19 has caused 6.8 million deaths, as of 1 February 2023 [1]. Various countermeasures have been taken to curb the epidemic. Countermeasures are classified into pharmaceutical interventions including vaccination and antiviral treatment, and non-pharmaceutical interventions (NPIs) including social distancing, using personal protective equipment (e.g., masks), quarantine, and case isolation. In most countries and regions, all possible options have been used to stop the spread of the disease [2,3]. Stringent NPIs were put into place worldwide, and primary series vaccination was completed within 2021, or at least by mid-2022, in many countries. However, in late 2021, the SARS-CoV-2 Omicron variant (B.1.1.529) emerged and spread rapidly around the globe [4]. Although the mortality impact of the Omicron variant was minimized mainly owing to vaccination and treatment [5], the variant led to substantial morbidity and mortality around the world.

    Since the initial interventions in February 2020, China adopted a containment strategy, the "zero-COVID policy", in response to the pandemic [6]. Despite its early success, the policy has involved mandatory lockdowns, i.e., restricting people to their homes or within a limited geographic space. Such interventions led to debates over adverse impacts (e.g., harm to mental health and reports of domestic violence [7,8]) and human rights and freedom. Moreover, the sustainability of the zero-COVID policy was questioned owing to its economic cost [9], requirement for RT-PCR testing resources, and deterioration of trade and business opportunities (e.g., blockades in Shanghai [10]). After the lockdown policy was maintained for more than 2.5 years, widespread protests have occurred [11], and it became unrealistic for the Chinese government to continue strict NPIs as of late 2022.

    As part of the implemented pharmaceutical interventions, a mass vaccination program with its originally manufactured inactivated vaccine, adenovirus vector vaccine, and recombinant protein vaccine has been implemented in China [12]. An official statement from the National Health Commission indicated that the first dose for people over 60 years old attained a coverage of approximately 90% by November 30, 2022, but the coverage of additional doses (i.e., second and third doses) was not substantially elevated among elderly people by late 2022, especially those aged 80 years [12].

    Since the beginning of the pandemic, the mortality impact of COVID-19 in China has been studied by numerous researchers [13,14,15,16]. In particular, given the substantial growth rate of the Omicron variant and its repeated importations into China [17], the possible mortality impact upon reopening of Chinese society has become important to consider. According to a published study on the Omicron variant by Cai et al. [16], the cumulative number of deaths in China could be on the order of 1.55 million deaths according to an age-structured stochastic compartment model [16]. As the mortality impact could be substantial, several research studies attempted to estimate the excess mortality, using existing methods including time series and machine learning techniques [18,19]. However, such investigation usually requires use of a sophisticated model to capture the detailed transmission dynamics. A simple and convenient approach to address this issue has been the subject of ongoing research. Moreover, the question has arisen regarding whether the mortality impact could be partly eased by increasing the COVID-19 vaccination coverage or by using mRNA vaccines instead of inactivated ones.

    In the meantime, epidemiological transmission models have been extensively studied with the aim of estimating the cumulative incidence of infection, including the instances where vaccination takes place [20]. The cumulative risk of infection was shown to be derived from by the so-called final size equation, an explicit, but non-closed form solution of the transmission model with respect to the fraction of people experiencing infection [21]. To date, the final size equation provides a comprehensive and reasonable pathway to predict the cumulative incidence of an epidemic in the absence of time-dependent countermeasures, and the equation has been employed for various applications [22,23,24]. Estimating the mortality impact can help improve our understanding of the magnitude of the COVID-19 pandemic, thereby allowing policymakers to make value judgments. The purpose of the present study was to formulate an age-dependent final size equation to easily allow computation of the cumulative risks of infection and death in China under various scenarios of vaccination and the use of different types of vaccine. In this study, we applied a next-generation matrix to capture the age-dependent heterogeneous transmission of COVID-19 infection.

    As of 14 December 2022, the National Health Commission announced that 3.4 billion vaccine doses had been administered in China [25]. The coverage of the second dose in the age groups 0–59, 60–79, and 80 years and older has been documented as 86.0%, 89.8%, and 66.4%, respectively [25]. The coverage of the third dose in these age groups is reported to be 52.3%, 72.3%, and 42.3%, respectively [25]. The first dose, mainly administered from December 2020 [26], is expected to have had a very limited impact on modifying the transmission dynamics of the Omicron variant in late 2022; thus, this dataset was discarded. Age was dealt with as a discrete group, and the population was divided into 10-year age groups (those aged 80 years and older were grouped together as the single oldest category). The age-specific population size was retrieved from World Population Prospects 2022 published by the United Nations (Supplementary Table 1) [27].

    Table 1.  Parameters values used to calculate mortality impact of COVID-19 in China.
    Parameter Doses Outcome Vaccine Values Reference
    vs,inf Second dose Infection Inactivated 0%, 10%, 20% -
    vk,inf Third dose Infection Inactivated 33.4% [31]
    vs,death Second dose Death Inactivated 90.3% [32]
    vk,death Third dose Death Inactivated 91.1% [33]
    vs,inf Second dose Infection mRNA 28.0% [34]
    vk,inf Third dose Infection mRNA 57.0% [35]
    vs,death Second dose Death mRNA 90.7% [36]
    vk,death Third dose Death mRNA 95.5% [35]

     | Show Table
    DownLoad: CSV

    To compute the expected number of deaths among infected individuals, we used the age-specific infection fatality risk (IFR) extracted from O'Driscoll et al. (Supplementary Table 2) [28]. The IFR was defined as the fraction of deaths among all infected individuals. As for the age-dependent transmission dynamics, we used an age-dependent next-generation matrix in Japan (Supplementary Table 3) [29]. Table 1 shows the parameter values and references used. For simplicity, we assumed that the effectiveness against infection and severe disease (or death) of the second and third doses of inactivated vaccine is independent of age. We assumed that the effectiveness against infection conferred by the second dose could take the value of 0%, 10%, or 20%, referring to the fact that the risk of infection after receiving second-dose vaccines did not deviate substantially from the risk with no vaccination [30]. As the baseline assumption, the basic reproduction number (R0) of the Omicron variant was assumed to be 3.4, referring to a published simulation study [9]; however, we varied R0 broadly from 1 to 10. When examining a scenario in which mRNA vaccines are used, we assumed that mRNA vaccine BNT162b2 replaced everything with identical coverage, as mentioned above.

    Here, we used the "final size equation" that can usually be derived from a structured transmission model (e.g., susceptible–infectious–recovered [SIR] model) [37]. That is, we used the recursive equation that allowed us to iteratively calculate the cumulative number of infections throughout the course of the epidemic. Here, the final size is defined as the fraction of population that experienced infection by the end of an epidemic. The age-dependent final size equation is derived from an age-structured SIR model; the derivation process can be found elsewhere [38]. Letting zi be the final size of age group i,

    1zi=exp(jzjRij) (1)

    where Rij is the element of the next-generation matrix representing the average number of secondary infections in age group i produced by a single infected individual in age group j.

    Usually, if there are two or more different types of host, as defined by vaccination doses (i.e., unvaccinated, one-dose, two-dose, and three-dose), using a vector of infected individuals would be called for; thus, the elements of the next-generation matrix would be increased. However, we simplified the modeling approach by imposing an assumption that vaccination mainly reduces susceptibility only and also that contact behavior of the host is independent of vaccination doses. We supposed that the two-dose and three-dose population size is ps, a and pk, a, respectively, and the remaining groups (unvaccinated and one-dose) are grouped together with a fraction 1- ps, a-pk, a. We supposed that the unvaccinated and one-dose group had a hazard of infection λ(t) at calendar time t, the two-dose group had a reduced hazard (1vs,inf)λ(t), and the third-dose group had the hazard (1vk,inf)λ(t). Because the susceptible fraction at the beginning of the epidemic is proportional to the above-mentioned coverage-dependent population size, the total incidence is described as:

    λ(t)(1(ps,a+pk,a))+λ(t)(1vs,inf)ps,a+λ(t)(1vk,inf)pk,a=λ(t)[1(ps,avs,inf+pk,avk,inf)] (2)

    That is, under the above-mentioned assumption, the hazard rate (or equivalently in this case, the transmission rate) of the entire population is reduced by a factor of 1(ps,avs,inf+pk,avk,inf).

    Using the simplification in equation (2), we computed the age-dependent final size, including the vaccination effectiveness, as:

    1zi=exp{j[1(ps,ivs,inf+pk,ivk,inf)]zjRij} (3)

    We estimated the cumulative incidence of infection (zi) from equation (3).

    The cumulative risk of death can be then obtained by multiplying the IFR fi to the cumulative incidence zi. Let vs,death and vk,death represent the vaccine effectiveness against fatal infection among those who completed second and third dose immunization, respectively. Accounting for the vaccine effectiveness in escaping from fatal infection, and assuming that the protection from severe infection was conditionally independent from the risk of infection (as reflected in zi), the cumulative number of deaths in age group i (Di) by the end of the endemic was calculated as:

    Di=[(1ps,ipk,i)z0,i+(1vs,death)ps,izs,i+(1vk,death)pk,izki]fiNi (4)

    where fi is the IFR of age group i and Ni is the population size of age group i. The final size of age group i by vaccine history, i.e., z0, i, zs, i and zk, i, were obtained as the solution of following equations:

    1z0,i=(1ps,ipk,i)exp{j(z0,j+zs,j+zk,j)Rij}1zs,i=ps,iexp{(1vs,inf)j(z0,j+zs,j+zk,j)Rij}1zk,i=pk,iexp{(1vk,inf)j(z0,j+zs,j+zk,j)Rij} (5)

    which can be derived in the same way of equation (3).

    In this study, we sought to explore the impact of different values of R0, different vaccine coverage rates, and different types of vaccine on the cumulative risk of COVID-19 infection. To do so, we first calculated the mortality in each age group, varying the R0 from 1 to 10. To vary the R0, the next-generation matrix was normalized, and then R0 was multiplied to all elements. Next, we computed the mortality in the event that the third-dose coverage was 20% lower or 20% higher than the actual value for all age groups. The number of deaths that would be averted by enhanced implementation of the third-dose program was calculated. Third, we calculated the mortality in the event that an mRNA vaccine (BNT162b2) was used instead of inactivated vaccines, varying the R0 from 1 to 10. The mortality impact was compared between mRNA and inactivated vaccines.

    This study used only publicly reported data, and we did not handle any personally identifiable information. Accordingly, the present study did not require ethical approval.

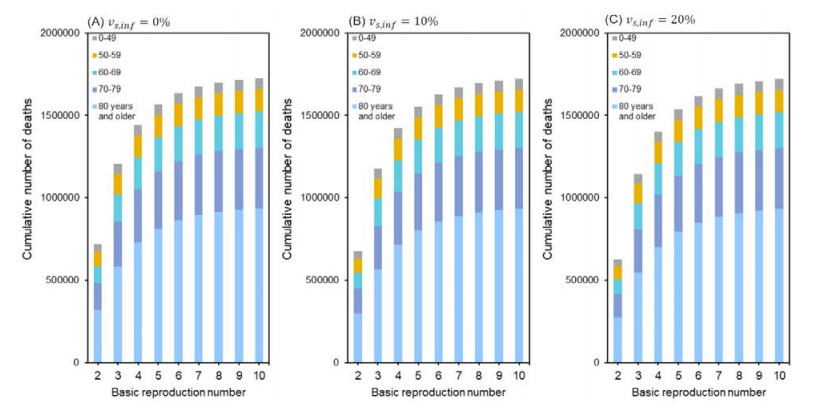
    Figure 1 shows the cumulative number of deaths with varying the R0 from 1 to 10 for an assumed second-dose effectiveness at 0%, 10%, and 20%, respectively. For these values, with the default value of R0 at 3.4, the cumulative number of deaths was approximately 1.47, 1.46, and 1.44 million deaths, respectively. People aged 80 years and older accounted for approximately half of the expected deaths, and people aged 70–79 years accounted for 22%. As the R0 was increased, especially from 2 to 6, the expected number of deaths became substantially elevated.

    Figure 1.  Cumulative number of COVID-19 deaths by age group and different second-dose effectiveness at 0%, 10%, and 20% in China. The horizontal axis represents the R0, and the vertical axis shows the cumulative number of deaths. Panels A, B, and C correspond to second-dose effectiveness at 0%, 10% and 20%, respectively.

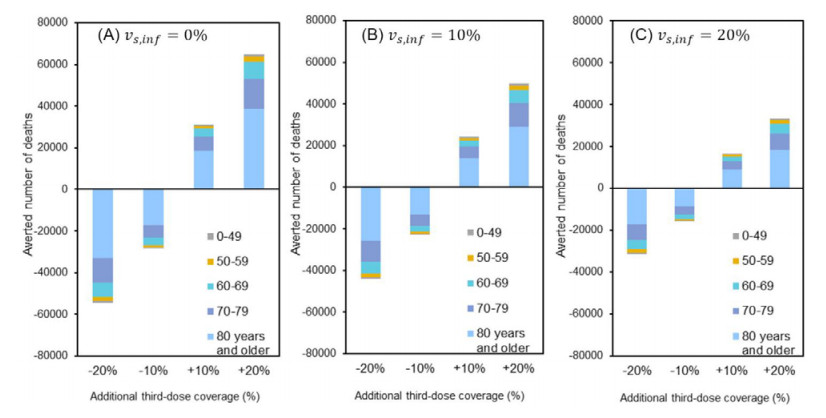
    Figure 2 shows the number of deaths that would be averted by additionally increasing the coverage of third-dose vaccination. A 10% random increase in third-dose coverage prevented 30,948, 24,106, and 16,367 deaths with second-dose effectiveness of 0%, 10%, and 20%, respectively. Similarly, for these effectiveness values, a 20% random elevation in the third-dose coverage would save 64,868, 49,717, and 33,228 lives, respectively. Conversely, a 10% decrease in third-dose coverage led to an increase of 28,337, 22,732, and 15,899 deaths, respectively.

    Figure 2.  Number of COVID-19 deaths averted by increased third-dose vaccination coverage in China. The horizontal axis represents the relative increase in third-dose vaccination coverage, which is assumed to be conducted randomly. The vertical axis represents the number of lives that would be saved with third-dose vaccination compared with the baseline scenario. Panels A, B, and C correspond to second-dose effectiveness at 0%, 10% and 20%, respectively.

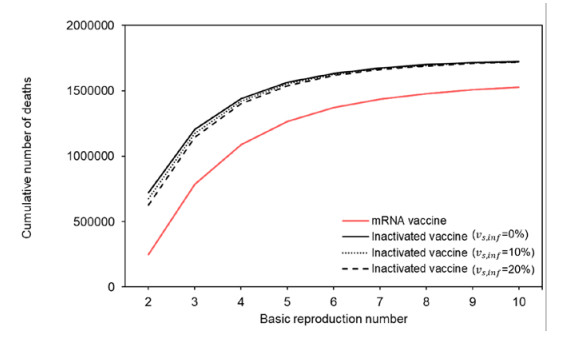
    Figure 3 shows the cumulative number of deaths if mRNA vaccine (BNT162b2) were used instead of inactivated vaccines. Unlike the 1.4 million deaths using inactivated vaccines, the cumulative number of deaths was calculated to be 1.1 million deaths with an R0 of 3.4. Similar to inactivated vaccines, people aged 80 years and older accounted for approximately half of all deaths and those aged 70–79 years accounted for 20% of all deaths.

    Figure 3.  Cumulative number of COVID-19 deaths as a function of basic reproduction number and different vaccines (inactivated vs. mRNA) and second-dose effectiveness at 0%, 10%, and 20% in China. The horizontal axis represents R0. The vertical axis represents the cumulative number of COVID-19 deaths. The red solid line represents the cumulative number of deaths if mRNA vaccines were used instead of inactivated vaccines. The black solid line, dotted line, and dashed line represent the cumulative number of deaths with second-dose effectiveness 0%, 10% and 20%, respectively.

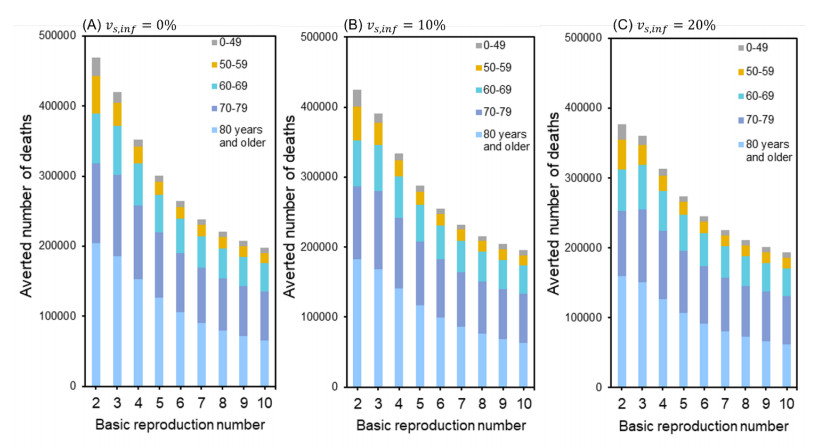
    Figure 4 shows the number of deaths that could be averted if inactivated vaccines were replaced with mRNA vaccines. With mRNA vaccines and an R0 of 3.4, the number of lives that would have been saved was 343,000, assuming that second-dose effectiveness was 0%. Similarly, for second-dose effectiveness of 10% and 20%, the averted number of deaths would be 325,000 and 306,000, respectively.

    Figure 4.  Number of averted COVID-19 deaths owing to replacement of inactivated vaccines with mRNA vaccines in China. The horizontal axis represents R0. The vertical axis represents the number of lives saved by replacing inactivated vaccines with mRNA vaccine. Panels A, B, and C correspond to second-dose effectiveness at 0%, 10%, and 20%, respectively.

    In China, the COVID-19 containment strategy was changed in December 2022 [39], although a substantial number of elderly people remained unvaccinated. A similar epidemic trend of the 2022 BA.2 wave previously occurred in Hong Kong, with 71.1% of deaths occurring among people aged 80 years and older [40]. With the final size equation, we used a simple approach to assess the potential disease burden in China. We also explored how the massive number of deaths could be reduced by increasing the third-dose vaccination coverage before lifting restrictions and also by replacing inactivated vaccines with mRNA vaccine. Using the default value of R0 at 3.4, the cumulative number of deaths was calculated to be 1.4 million. We found that a 20% increase in third-dose coverage could prevent 33,000 to 65,000 deaths. If mRNA vaccine were used, approximately 300,000 lives could have been saved.

    To the best of our knowledge, the present study is the first to have shown that the final size equation can conveniently be used to aid risk assessment. Although the approach was simplistic in calculating the mortality impact, the value of approximately 1.4 million deaths was consistent with published estimates in advance of reopening [16], and also with findings of a real time study in Beijing [41]. Cai et al. [16] estimated the total number of deaths in China using the age-structured stochastic compartment model which is governed by the age-dependent next-generation matrix. Leung et al. [41] estimated the fraction of the population infected from 1 November 2022, using a dynamic transmission model with real-time mobility data. Other studies included the one estimating the mortality impact using travel patterns during the course of epidemic [42] and the other one that tracked diagnosed case data from December 2022 to January 2023 [43]. Not only calculating the expected number of deaths in the default setting but also using the equation allowed us to implement risk assessment with additional or varied interventions (e.g., with additional vaccination). Apart from its simplicity, an important disadvantage of the final size equation is that fixed parameter values must be determined at the beginning of an epidemic. Even additional interventions must be assumed to be completed in advance of a major epidemic. Thus, if a drastic change that occurs during the course of an epidemic is to be studied, more sophisticated structured models [16,41] are required.

    By examining possible interventions before lifting restrictions, our study showed that the number of deaths in China could be substantially reduced by increasing third-dose vaccination. The Chinese government issued a circular aimed at increasing the third-dose coverage among elderly people in December 2022 [12]. The present study findings endorse the scientific appropriateness of that real-time effort. By the end of January 2023, according to official reports, 92% of elderly people had completed booster vaccination against a population receiving second doses (inactivated vaccine) or first doses (adenovirus vector vaccine) of vaccine [44]; the third-dose coverage remains unknown. According to our results, even with very low effectiveness of the second dose, vaccination with the third dose would substantially contribute to protecting vulnerable people aged 80 years and older.

    We also compared the mortality impact between mRNA and inactivated vaccines. Using an mRNA vaccine could have reduced the cumulative risk of infection by approximately 25%. The lesson to be learned from this simple exercise is that governmental decisions on the type of vaccine used in nationwide vaccination programs has a profound population impact, especially in the case of vaccine effectiveness being greatly reduced by antigenic evolution of circulating variants. The mRNA BNT162b2 vaccine as well as other mRNA vaccines (AZD1222) would substantially avert the risk of death owing to COVID-19 [32]. Some studies have shown that heterologous booster vaccines are more effective against infection and death than homologous booster vaccines [33,45,46]. Not necessarily having all three doses but having a single booster of mRNA vaccine might substantially lower the disease burden.

    This study had five technical limitations. First, we assumed that the age-specific IFR remained constant throughout the course of the epidemic. Owing to a massive number of cases caused by circulating variants [47,48], health care facilities might have been overwhelmed with severe cases, thereby elevating the IFR [49]. The IFR may also decrease during the course of an epidemic due to widespread supply of antivirals and vaccines, and in that sense, an assumption of employing constant IFR could also have led to overestimation of the cumulative number of deaths. Second, our study did not precisely account for the time that has elapsed since the latest round of vaccination. In this sense, consistently using the assumed effectiveness values from the literature throughout the present study could have led to overestimating the preventive effect. Third, a fourth dose of vaccination remains very rare in China and was therefore not considered. If the booster program was actually widespread and effective, our study could have overestimated the final size. In fact, although not widely disseminated to the entire population, the Chinese government announced a fourth dose vaccination program starting on December 14, 2022 [50]. Fourth, the next-generation matrix used in this study was derived from our empirical study in Japan. This requires us to impose an important assumption that age-dependent contact patterns are comparable between Japan and China, which must be validated in the future. If infection control measures have resulted in less frequent overall contacts in China, our assumption may have led to an overestimation of the final size. Fifth, we did not explicitly account for antiviral treatment, again potentially overestimating the cumulative number of deaths. By January 5, 2023, the Chinese government had released the 10th edition of the treatment protocol for SARS-CoV-2 infection, which recommends the use of Paxlovid, Azvudine, and molnupiravir [51]. However, health care services were overwhelmed, and thus this expensive treatment was not sufficiently disseminated to high-risk patients in the early stage of illness; antiviral treatment may have reduced a part of the calculated risk of death.

    More practical models should account for geographic heterogeneities. Lastly, given that contact behaviors and mobility are likely to have dramatically changed during the course of the epidemic, precise estimates require us to employ a dynamic model that accounts for time-dependent human mobility and case importations from other geographic units.

    Using the final size equation approach, we calculated the possible population impact of COVID-19 in China after reopening to be 1.4 million deaths. The increase in third-dose vaccination coverage contributed to decreasing the cumulative number of deaths by 30,000–60,000. If mRNA vaccines were used, the cumulative number of deaths could have been 1.1 million.

    H. N. received funding from Health and Labour Sciences Research Grants (20CA2024, 20HA2007, 21HB1002, and 21HA2016), the Japan Agency for Medical Research and Development (JP 23fk0108685), JSPS KAKENHI (21H03198 and 22K19670), the Environment Research and Technology Development Fund (JPMEERF20S11804) of the Environmental Restoration and Conservation Agency of Japan, Kao Health Science Research, the Daikin GAP Fund of Kyoto University, the Japan Science and Technology Agency SICORP program (JPMJSC20U3 and JPMJSC2105), and the RISTEX program for Science, Technology, and Innovation Policy (JPMJRS22B4). We thank Analisa Avila, MPH, ELS, from Edanz (https://jp.edanz.com/ac) for editing a draft of this manuscript.

    The authors declare that they have no competing interests.


    [1] Johns Hopkins University, COVID-19 Dashboard. Available from: https://coronavirus.jhu.edu/map.html
    [2] J. M. Brauner, S. Mindermann, M. Sharma, D. Johnston, J. Salvatier, T. Gavenčiak, et al., Inferring the effectiveness of government interventions against COVID-19, Science, 371 (2021), eabd9338. https://doi.org/10.1126/science.abd9338 doi: 10.1126/science.abd9338
    [3] C. N. Ngonghala, E. Iboi, S. Eikenberry, M. Scotch, C. R. MacIntyre, M. H. Bonds, et al., Mathematical assessment of the impact of non-pharmaceutical interventions on curtailing the 2019 novel coronavirus, Math. Biosci. , 325 (2020), 108364. https://doi.org/10.1016/j.mbs.2020.108364 doi: 10.1016/j.mbs.2020.108364
    [4] R. Viana, S. Moyo, D. G. Amoako, H. Tegally, C. Scheepers, C. L. Althaus, et al., Rapid epidemic expansion of the SARS-CoV-2 Omicron variant in southern Africa, Nature, 603 (2022), 679–686. https://doi.org/10.1038/s41586-022-04411-y doi: 10.1038/s41586-022-04411-y
    [5] J. A. Lewnard, V. X. Hong, M. M Patel, R. Kahn, M. Lipsitch, S. Y. Tartof, Clinical outcomes associated with SARS-CoV-2 Omicron (B. 1.1. 529) variant and BA. 1/BA. 1.1 or BA. 2 subvariant infection in southern California, Nat. Med., (2022), 1933–1943. https://doi.org/10.1038/s41591-022-01887-z
    [6] J. Liu, M. Liu, W. Liang, The dynamic COVID-Zero strategy in China, China CDC Wkly., 4 (2022), 74. https://weekly.chinacdc.cn/en/article/doi/10.46234/ccdcw2022.015
    [7] M. M. Hossain, S. Tasnim, A. Sultana, F. Faizah, H. Mazumder, L. Zou, et al., Epidemiology of mental health problems in COVID-19: A review, F1000Research, (2020), 636. https://doi.org/10.12688/f1000research.24457.1
    [8] UN News, UN chief calls for domestic violence 'ceasefire' amid 'horrifying global surge'. Available from: https://news.un.org/en/story/2020/04/1061052
    [9] Economics Intelligence, What Shanghai's lockdown means for China's economy. Available from: https://country.eiu.com/article.aspx?articleid = 702022853
    [10] The People's Government of Shanghai City, Residents wake up to a running start. Available from: https://english.shanghai.gov.cn/nw48081/20201207/a042066172d64a4c847ea07d32df645d.html
    [11] Science, Models predict massive wave of disease and death if China lifts 'zero COVID' policy. Available from: https://www.science.org/content/article/models-predict-massive-wave-disease-and-death-if-china-lifts-zero-covid-policy
    [12] National Health Commission, The Comprehensive Group of the Joint Prevention and Control Mechanism of the State Council issued the "Work Plan for Strengthening the New Coronary Virus Vaccination of the Elderly". Available from: http://www.gov.cn/xinwen/2022-11/29/content_5729388.htm
    [13] X. Wei, M. Li, X. Pei, Z. Liu, J. Zhang, Assessing the effectiveness of the intervention measures of COVID-19 in China based on dynamical method, Infect. Dis. Model. , 8 (2023), 159–171. https://doi.org/10.1016/j.idm.2022.12.007 doi: 10.1016/j.idm.2022.12.007
    [14] K. Prem, Y. Liu, T. W. Russell, A. J. Kucharski, R. M. Eggo, N. Davies, et al., The effect of control strategies to reduce social mixing on outcomes of the COVID-19 epidemic in Wuhan, China: a modelling study, Lancet Public Health, 5 (2020), e261–e270. https://doi.org/10.1016/S2468-2667(20)30073-6 doi: 10.1016/S2468-2667(20)30073-6
    [15] Z. Yang Z, Z. Zeng, K. Wang, S. S. Wong, W. Liang, M. Zanin, et al., Modified SEIR and AI prediction of the epidemics trend of COVID-19 in China under public health interventions, J. Thorac. Dis., 12 (2020), 165–174. https://doi.org/10.21037/jtd.2020.02.64 doi: 10.21037/jtd.2020.02.64
    [16] J. Cai, X. Deng, J. Yang, K. Sun, H. Liu, Z. Chen, et al., Modeling transmission of SARS-CoV-2 Omicron in China, Nat. Med., 28 (2022), 1468–1475. https://doi.org/10.1038/s41591-022-01855-7 doi: 10.1038/s41591-022-01855-7
    [17] Global Initiative on Sharing Avian Influenza Data, Percentage of SARS-CoV-2 strains in China. Available from: https://gisaid.org/phylodynamics/china-cn/
    [18] H. Wang, K. R. Paulson, S. A. Pease, S. Watson, H. Comfort, P. Zheng, et al, Estimating excess mortality due to the COVID-19 pandemic: a systematic analysis of COVID-19-related mortality, Lancet, 39 (2022), 1513–1536. https://doi.org/10.1016/S0140-6736(21)02796-3 doi: 10.1016/S0140-6736(21)02796-3
    [19] W. Msemburi, A. Karlinsky, V. Knutson, S. Aleshin-Guendel, S. Chatterji, Wakefield J, The WHO estimates of excess mortality associated with the COVID-19 pandemic, Nature, 613 (2023), 130–137. https://doi.org/10.1038/s41586-022-05522-2 doi: 10.1038/s41586-022-05522-2
    [20] M. Haber, M. E. Halloran, I. M. Longini Jr, L. Watelet, Estimation of Vaccine Efficacy in Non-Randomly Mixing Populations, Biometr. J., 37 (1995), 25–38. https://doi.org/10.1002/bimj.4710370103 doi: 10.1002/bimj.4710370103
    [21] I. M. Longini Jr, E. Ackerman, L. R. Elveback, An optimization model for influenza A epidemics, Math. Biosci., 38 (1978), 141–157. https://doi.org/10.1016/0025-5564(78)90023-8 doi: 10.1016/0025-5564(78)90023-8
    [22] L. Almeida, P. A. Bliman, G. Nadin, B. Perthame, N. Vauchelet, Final size and convergence rate for an epidemic in heterogeneous populations, Math. Models Methods Appl. Sci., 31 (2021), 1021–1051. https://doi.org/10.1142/S0218202521500251 doi: 10.1142/S0218202521500251
    [23] Y. Tsubouchi, Y. Takeuchi, S. Nakaoka, Calculation of final size for vector-transmitted epidemic model, Math. Biosci. Eng., 16 (2019), 2219–2232. https://doi.org/10.3934/mbe.2019109 doi: 10.3934/mbe.2019109
    [24] K. Mizumoto, T. Yamamoto, H. Nishiura, Age-dependent estimates of the epidemiological impact of pandemic influenza (H1N1-2009) in Japan, Comput. Math. Methods Med., (2013), 637064. https://doi.org/10.1155/2013/637064
    [25] National Health Commission, State Council Joint Prevention and Control Mechanism December 14, 2022 Press Conference Transcript. Available from: http://www.nhc.gov.cn/xcs/s3574/202212/b927d43bd0354ffeb5a8e1b91377302f.shtml
    [26] Xinhua News Agency, Some key populations receive the COVID-19 vaccines and follow up with the "all-inclusive" vaccination for high-risk groups. Available from: http://www.gov.cn/xinwen/2020-12/19/content_5571239.htm
    [27] United Nations, World Population Prospects 2022. Available from: https://population.un.org/wpp/
    [28] M. O'Driscoll, G. Ribeiro Dos Santos, L. Wang, D. A. T. Cummings, A. S. Azman, J. Paireau, et al., Age-specific mortality and immunity patterns of SARS-CoV-2, Nature, 590 (2021), 140–145. https://doi.org/10.1038/s41586-020-2918-0 doi: 10.1038/s41586-020-2918-0
    [29] M. Sasanami, T. Kayano, H. Nishiura, Monitoring the COVID-19 immune landscape in Japan, Int. J. Infect. Dis., 122 (2022), 300–306. https://doi.org/10.1016/j.ijid.2022.06.005 doi: 10.1016/j.ijid.2022.06.005
    [30] A. R. D. Silva Jr., L. S. Villas-Boas, T. R. Tozetto-Mendoza, L. Honorato, A. Paula, S. S. Witkin, et al., Generation of neutralizing antibodies against Omicron, Gamma and Delta SARS-CoV-2 variants following CoronaVac vaccination, Rev. Inst. Med. Trop. Sao Paulo, 64 (2022), e19. https://doi.org/10.1590/s1678-9946202264019 doi: 10.1590/s1678-9946202264019
    [31] A. Jara, E. A. Undurraga, C. Gonzalez, F. Paredes, T. Fontecilla, G. Jara, et al., Effectiveness of an inactivated SARS-CoV-2 vaccine in Chile, N. Engl. J. Med., 385 (2021), 875–884. https://doi.org/10.1056/NEJMoa2107715 doi: 10.1056/NEJMoa2107715
    [32] J. L. Suah, B. H. Tng, P. S. K. Tok, M. Husin, T. Thevananthan, K. M. Peariasamy, et al., Real-world effectiveness of homologous and heterologous BNT162b2, CoronaVac, and AZD1222 booster vaccination against Delta and Omicron SARS-CoV-2 infection, Emerg. Microbes Infect., 11 (2022), 1343–1345. https://doi.org/10.1080/22221751.2022.2072773 doi: 10.1080/22221751.2022.2072773
    [33] A. Jara, E. A. Undurraga, J. R. Zubizarreta, C. Gonzalez, A. Pizarro, J. Acevedo, et al., Effectiveness of homologous and heterologous booster doses for an inactivated SARS-CoV-2 vaccine: a large-scale prospective cohort study, Lancet Glob Health, 10 (2022), e798–e806. https://doi.org/10.1016/S2214-109X(22)00112-7 doi: 10.1016/S2214-109X(22)00112-7
    [34] B. Yang, I. O. L. Wong, J. Xiao, T. K. Tsang, Q. Liao, B. J. Cowling, Effectiveness of CoronaVac and BNT162b2 vaccines against severe acute respiratory syndrome coronavirus 2 Omicron BA. 2 infections in Hong Kong, J. Infect. Dis., 226 (2022), 1382–1384. https://doi.org/10.1093/infdis/jiac360 doi: 10.1093/infdis/jiac360
    [35] V. K. C. Yan, E. Y. F. Wan, X. Ye, A. H. Y. Mok, F. T. T. Lai, C. S. L. Chui, et al., Effectiveness of BNT162b2 and CoronaVac vaccinations against mortality and severe complications after SARS-CoV-2 Omicron BA. 2 infection: a case-control study, Emerg. Microbes Infect., 11 (2022), 2304–2314. https://doi.org/10.1080/22221751.2022.2114854 doi: 10.1080/22221751.2022.2114854
    [36] W. Shao, X. Chen, C. Zheng, H. Liu, G. Wang, B. Zhang, et al., Effectiveness of COVID-19 vaccines against SARS-CoV-2 variants of concern in real-world: a literature review and meta-analysis, Emerg. Microbes Infect., 11 (2022), 2383–2392. https://doi.org/10.1080/22221751.2022.2122582 doi: 10.1080/22221751.2022.2122582
    [37] J. Ma, D. J. Earn, Generality of the final size formula for an epidemic of a newly invading infectious disease, Bull. Math. Biol., 68 (2006), 679–702. https://doi.org/10.1007%2Fs11538-005-9047-7
    [38] M. Haber, I. M. Longini Jr, G. A. Cotsonis, Models for the statistical analysis of infectious disease data, Biometrics, (1988), 163–173. https://doi.org/10.2307/2531904
    [39] National Health Commission, Notice on Printing and Distributing the Overall Plan for the Implementation of "Class B and B Controls" for SARS-CoV-2 Infection. Available from: http://www.gov.cn/xinwen/2022-12/27/content_5733739.htm
    [40] Y. M. Mefsin, D. Chen, H. S. Bond, Y. Lin, J. K. Cheung, J. Y. Wong, et al., Epidemiology of infections with SARS-CoV-2 Omicron BA. 2 variant, Hong Kong, January-March 2022, Emerg. Infect. Dis., 28 (2022), 1856–1858. https://doi.org/10.3201/eid2809.220613 doi: 10.3201/eid2809.220613
    [41] K. Leung, E. H. Lau, C. K. Wong, G. M. Leung, J. T. Wu, Estimating the transmission dynamics of SARS-CoV-2 Omicron BF. 7 in Beijing after adjustment of the zero-COVID policy in November–December 2022, Nat. Med., 29 (2023), 579–582. https://doi.org/10.1038/s41591-023-02212-y doi: 10.1038/s41591-023-02212-y
    [42] K. Leung, G. M. Leung, T. W. Joseph, Modelling the adjustment of COVID-19 response and exit from dynamic zero-COVID in China, (2022), preprint, medRxiv. https://doi.org/10.1101/2022.12.14.22283460
    [43] Chinese Center for Disease Control and Prevention, COVID-19 Clinical and Surveillance Data — December 9, 2022 to January 23, 2023, China. Available from: https://en.chinacdc.cn/news/latest/202301/t20230126_263523.html
    [44] Chinese Center for Disease Control and Prevention, National SARS-CoV-2 Infection Epidemic Situation. Available from: https://www.chinacdc.cn/jkzt/crb/zl/szkb_11803/jszl_13141/202301/t20230125_263519.html
    [45] T. Cerqueira-Silva, S. V. Katikireddi, V. de Araujo Oliveira, R. Flores-Ortiz, J. B. Junior, J. B. Paixao, et al., Vaccine effectiveness of heterologous CoronaVac plus BNT162b2 in Brazil, Nat. Med., 28 (2022), 838–843. https://doi.org/10.1038/s41591-022-01701-w doi: 10.1038/s41591-022-01701-w
    [46] M. Premikha, C. J. Chiew, W. E. Wei, Y. S. Leo, B. Ong, D. C. Lye, et al., Comparative effectiveness of mRNA and inactivated whole-virus vaccines against coronavirus disease 2019 infection and severe disease in Singapore, Clin. Infect. Dis., 75 (2022), 1442–1445. https://doi.org/10.1093/cid/ciac288 doi: 10.1093/cid/ciac288
    [47] F. Campbell, B. Archer, H. Laurenson-Schafer, Y. Jinnai, F. Konings, N. Batra, et al., Increased transmissibility and global spread of SARS-CoV-2 variants of concern as at June 2021, Euro. Surveill. , 26 (2021), 24. https://doi.org/10.2807/1560-7917.ES.2021.26.24.2100509 doi: 10.2807/1560-7917.ES.2021.26.24.2100509
    [48] K. Hayashi, H. Nishiura, Time-dependent risk of COVID-19 death with overwhelmed health-care capacity in Japan, 2020–2022, BMC Infect. Dis., 22 (2022), 1–10. https://doi.org/10.1186/s12879-022-07929-8
    [49] S. A. Madhi, V. Baillie, C. L. Cutland, M. Voysey, A. L. Koen, L. Fairlie, et al., Efficacy of the ChAdOx1 nCoV-19 Covid-19 vaccine against the B. 1.351 variant, N. Engl. J. Med., 384 (2021), 1885–1898. https://doi.org/10.1056/NEJMoa2102214 doi: 10.1056/NEJMoa2102214
    [50] National Health Commission, Notice on Printing and Distributing the Implementation Plan for the Second Dose of the SARS-CoV-2 Vaccine Booster Immunization. Available from: http://www.gov.cn/xinwen/2022-12/14/content_5731899.htm
    [51] National Health Commission, Notice on Printing and Distributing the Diagnosis and Treatment Plan for SARS-CoV-2 Infection (Trial Version 10). Available from: http://www.gov.cn/zhengce/zhengceku/2023-01/06/content_5735343.htm
  • Reader Comments
  • © 2023 the Author(s), licensee AIMS Press. This is an open access article distributed under the terms of the Creative Commons Attribution License (http://creativecommons.org/licenses/by/4.0)
通讯作者: 陈斌, bchen63@163.com
  • 1. 

    沈阳化工大学材料科学与工程学院 沈阳 110142

  1. 本站搜索
  2. 百度学术搜索
  3. 万方数据库搜索
  4. CNKI搜索

Metrics

Article views(2546) PDF downloads(104) Cited by(0)

Figures and Tables

Figures(4)  /  Tables(1)

Other Articles By Authors

/

DownLoad:  Full-Size Img  PowerPoint
Return
Return

Catalog