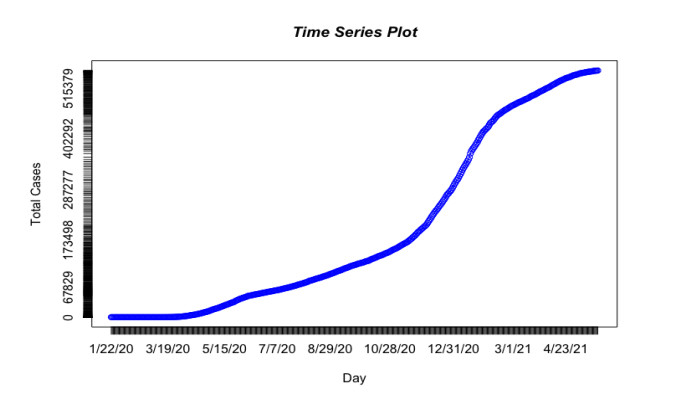
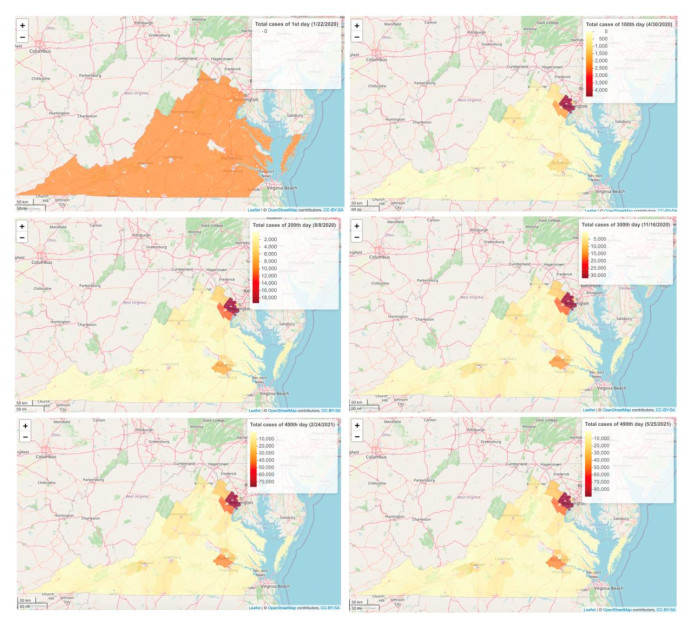
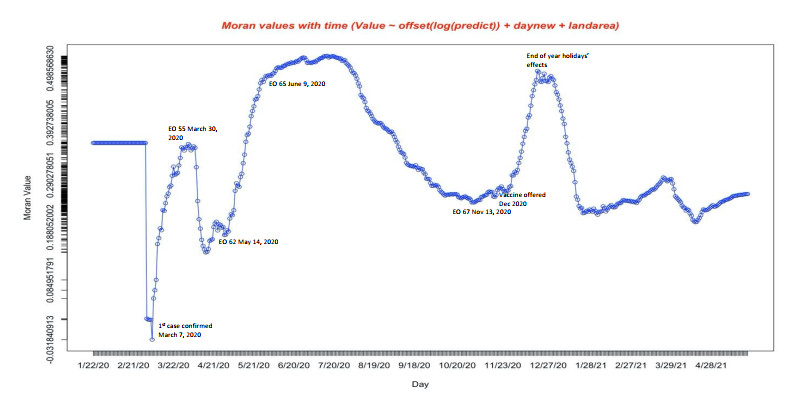
This study aims to use data provided by the Virginia Department of Public Health to illustrate the changes in trends of the total cases in COVID-19 since they were first recorded in the state. Each of the 93 counties in the state has its COVID-19 dashboard to help inform decision makers and the public of spatial and temporal counts of total cases. Our analysis shows the differences in the relative spread between the counties and compares the evolution in time using Bayesian conditional autoregressive framework. The models are built under the Markov Chain Monte Carlo method and Moran spatial correlations. In addition, Moran's time series modeling techniques were applied to understand the incidence rates. The findings discussed may serve as a template for other studies of similar nature.
Citation: S. H. Sathish Indika, Norou Diawara, Hueiwang Anna Jeng, Bridget D. Giles, Dilini S. K. Gamage. Modeling the spread of COVID-19 in spatio-temporal context[J]. Mathematical Biosciences and Engineering, 2023, 20(6): 10552-10569. doi: 10.3934/mbe.2023466
This study aims to use data provided by the Virginia Department of Public Health to illustrate the changes in trends of the total cases in COVID-19 since they were first recorded in the state. Each of the 93 counties in the state has its COVID-19 dashboard to help inform decision makers and the public of spatial and temporal counts of total cases. Our analysis shows the differences in the relative spread between the counties and compares the evolution in time using Bayesian conditional autoregressive framework. The models are built under the Markov Chain Monte Carlo method and Moran spatial correlations. In addition, Moran's time series modeling techniques were applied to understand the incidence rates. The findings discussed may serve as a template for other studies of similar nature.

| [1] | A. Gelman, J. Carlin, H. Stern, D. B. Rubin, Bayesian data analysis, 3rd edition, Chapman & Hall, London, 2013. |
| [2] |
M. V. Ibañez, M. Martinez-Garcia, A. Simo, A review of spatiotemporal models for count data in R packages. A case study of COVID-19 Data, Mathematics, 9 (2021), 1–23. https://doi.org/10.3390/math9131538 doi: 10.3390/math9131538

|
| [3] |
J. Tomal, S. Rahmati, S. Boroushaki, L. Jin, E. Ahmed, The impact of COVID–19 on students' Marks: A Bayesian hierarchical modeling approach, METRON, 79 (2021), 57–91. https://doi.org/10.1007/s40300-021-00200-1 doi: 10.1007/s40300-021-00200-1
|
| [4] |
J. Besag, D. Higdon, Bayesian analysis of agricultural field experiments, J. R. Statist. Soc. B, 61 (1999), 691–746. https://doi.org/10.1111/1467-9868.00201 doi: 10.1111/1467-9868.00201
|
| [5] |
J. Choi, A. B. Lawson, Evaluation of Bayesian spatial-temporal latent models in small area health data, Environmetrics, 22 (2011), 1008–1022. https://doi.org/10.1002/env.1127 doi: 10.1002/env.1127
|
| [6] |
M. M. Hossain, A. B. Lawson, B. Cai, J. Choi, J. Liu, R. S. Kirby, Space-time areal mixture modelling: Relabeling algorithm and model selection issues, Environmetrics, 25 (2014), 84–96. https://doi.org/10.1002/env.2265 doi: 10.1002/env.2265
|
| [7] |
C. Anderson, D. Lee, N. Dean, Identifying clusters in Bayesian disease mapping, Biostatistics, 15 (2014), 457-469. https://doi.org/10.1093/biostatistics/kxu005 doi: 10.1093/biostatistics/kxu005
|
| [8] |
C. Anderson, D. Lee, N. Dean, Bayesian cluster detection via adjacency modeling, Spatial Spatio-Temporal Epidemiol., 16 (2016), 1–20. https://doi.org/10.1016/j.sste.2015.11.005 doi: 10.1016/j.sste.2015.11.005
|
| [9] |
A. O. Finley, S. Banerjee, B. P. Carlin, spBayes: An R package for univariate and multivariate hierarchical point-referenced spatial models, J. Stat. Software, 19 (2007), 1–24. https://doi.org/10.18637/jss.v019.i04 doi: 10.18637/jss.v019.i04
|
| [10] |
A. O. Finley, S. Banerjee, A. Gelfand, spBayes for large univariate and multivariate point-referenced Spatio-Temporal data models, J. Stat. Software, 63 (2015), 1–28. https://doi.org/10.18637/jss.v063.i13 doi: 10.18637/jss.v063.i13
|
| [11] |
P. A. P. Moran, Notes on continuous stochastic phenomena, Biometrika, 37 (1950), 17–23. https://doi.org/10.2307/2332142 doi: 10.2307/2332142
|
| [12] |
A. B. Lawson, A. B. Biggeri, D. Boehning, E. Lesaffre, J. F. Viel, A. Clark, et al., Disease mapping models: an empirical evaluation. Disease Mapping Collaborative Group, Stat. Med., 19 (2000), 2217–2241. https://doi.org/10.1002/1097-0258(20000915/30)19:17/18%3C2217::AID-SIM565%3E3.0.CO; 2-E doi: 10.1002/1097-0258(20000915/30)19:17/18%3C2217::AID-SIM565%3E3.0.CO; 2-E
|
| [13] |
T. McKinley, A. R. Cook, R. Deardon, Inference in epidemic models without likelihoods, Int. J. Biostat., 5 (2009), 1–40. https://doi.org/10.2202/1557-4679.1171 doi: 10.2202/1557-4679.1171
|
| [14] |
S. Ng, N. E. Basta, B. J. Cowling, Association between temperature, humidity and ebolavirus disease outbreaks in Africa, 1976 to 2014, Euro Surveill., 19 (2014), 1–11. https://doi.org/10.2807/1560-7917.ES2014.19.35.20892 doi: 10.2807/1560-7917.ES2014.19.35.20892
|
| [15] |
R. J. Milletich, N. Diawara, H. A. Jeng, Modelling of the deaths due to Ebola virus disease outbreak in western Africa, Int. J. Stats. Med., 4 (2015), 306–321. https://doi.org/10.6000/1929-6029.2015.04.04.1 doi: 10.6000/1929-6029.2015.04.04.1
|
| [16] |
L. Anselin, Local indicators of spatial association – LISA, Geogr. Anal., 27 (1995), 93–115. https://doi.org/10.1111/j.1538-4632.1995.tb00338.x doi: 10.1111/j.1538-4632.1995.tb00338.x
|
| [17] |
K. Tawiah, W. A. Iddrisu, K. A. Asosega, Zero-Inflated time series modelling of COVID-19 deaths in Ghana, J. Environ. Public Health, (2021), 1–9. https://doi.org/10.1155/2021/5543977 doi: 10.1155/2021/5543977
|
| [18] |
S. Chang, E. Pierson, P. W. Koh, J. Gerardin, B. Redbird, D. Grusky, et al., Mobility network models of COVID-19 explain inequities and inform reopening, Nature, 589 (2021), 82–87. https://doi.org/10.1038/s41586-020-2923-3 doi: 10.1038/s41586-020-2923-3
|
| [19] | S. Comess, H. Wang, S. Holmes, C. Donnat, Statistical modeling for practical pooled testing during the COVID-19 pandemic, preprint, arXiv: 2107.05619. |
| [20] | Institute for Health Metrics and Evaluation (IHME) COVID-19 Forecasting Team, Modeling COVID-19 scenarios for the United States. Nat. Med., 27 (2021), 94–105. https://doi.org/10.1038/s41591-020-1132-9 |
| [21] |
V. H. Moreau, Forecast predictions for the COVID-19 pandemic in Brazil by statistical modeling using the Weibull distribution for daily new cases and deaths, Braz. J. Microbiol., 51 (2020), 1109–1115. https://doi.org/10.1007/s42770-020-00331-z doi: 10.1007/s42770-020-00331-z
|
| [22] |
J. Tolles, T. Luong, Modeling epidemics with compartmental models, JAMA, 323 (2020), 2515–2516. https://doi.org/10.1001/jama.2020.8420 doi: 10.1001/jama.2020.8420
|
| [23] | S. H. Woolf, D. A. Chapman, R. T. Sabo, E. B. Zimmerman, Excess deaths from COVID-19 and other causes in the US, March 1, 2020, to January 2, 2021, JAMA, 325 (2021), 1786–1789. https://doi.org/10.1001/jama.2021.5199 |
| [24] | A. B. Lawson, Bayesian Disease Mapping: Hierarchical modelling in spatial epidemiology, 2nd edition, CRC Press, Boca Raton, FL, 2013. |
| [25] |
F. Rigat, M. D. Gunst, J. V. Pelt, Bayesian modelling and analysis of spatio-temporal neuronal networks, Bayesian Anal., 1 (2006), 733-764. https://doi.org/10.1214/06-BA124 doi: 10.1214/06-BA124
|
| [26] |
L. Knorr-Held, Bayesian modelling of inseparable Space-Time variation in disease risk, Stat. Med., 19 (2000), 2555–2567. https://doi.org/10.1002/1097-0258(20000915/30)19:17/18<2555::AID-SIM587>3.0.CO;2-%23 doi: 10.1002/1097-0258(20000915/30)19:17/18<2555::AID-SIM587>3.0.CO;2-%23
|
| [27] |
P. Boedeker, Hierarchical linear modeling with maximum likelihood, restricted maximum likelihood, and fully Bayesian estimation, Pract. Assess. Res. Evaluation, 22 (2017). https://doi.org/10.7275/5vvy-8613 doi: 10.7275/5vvy-8613
|
| [28] |
P. Giudici, P. Pagnottoni, A. Spelta, Network self-exciting point processes to measure health impacts of COVID-19, J. R. Stat. Soc. Ser. A: Stat. Soc., 2023. https://doi.org/10.1093/jrsssa/qnac006 doi: 10.1093/jrsssa/qnac006
|
| [29] |
P. Giudici, B. Tarantino, A. Roy, Bayesian time-varying autoregressive models of COVID-19 epidemics, Biomet. J., 65 (2023), 2200054. https://doi.org/10.1002/bimj.202200054 doi: 10.1002/bimj.202200054
|
| [30] |
A. Paez, F. A. Lopez, T. Menezes, R. Cavalcanti, M. G. D. R. Pitta, A Spatio-Temporal analysis of the environmental correlates of COVID-19 incidence in Spain, Geogr. Anal., 53 (2021), 397–421. https://doi.org/10.1111/gean.12241 doi: 10.1111/gean.12241
|
| [31] |
M. De Angelis, C. Durastanti, M. Giovannoni, L. Moretti, Spatio-temporal distribution pattern of COVID-19 in the Northern Italy during the first-wave scenario: The role of the highway network, Transp. Res. Interdiscip. Perspect., 15 (2022), 100646. https://doi.org/10.1016%2Fj.trip.2022.100646 doi: 10.1016%2Fj.trip.2022.100646
|
| [32] | J. Park, S. Yi, W. Chang, J. Mateu, A Spatio-Temporal dirichlet process mixture model for coronavirus disease-19, preprint, arXiv: 2207.06587. |
| [33] |
M. Bizzarri, M. D. Traglia, A. Giuliani, A. Vestri, V. Fedeli, A. Prestininzi, New statistical RI index allow to better track the dynamics of covid-19 outbreak in Italy, Sci. Rep., 10 (2020). https://doi.org/10.1038/s41598-020-79039-x doi: 10.1038/s41598-020-79039-x
|
| [34] |
T. Guenther, M. Czech-Sioli, D. Indenbirken, A. Robitailles, P. Tenhaken, M. Exner, et al., Investigation of a superspreading event preceding the largest meat processing plant-related SARS-Coronavirus 2 outbreak in Germany, SSRN J., 2020. https://doi.org/10.2139/ssrn.3654517 doi: 10.2139/ssrn.3654517
|
| [35] |
D. Lee, A. Rushworth, G. Napier, Spatio-Temporal areal unit modelling in R with conditional autoregressive priors using the CARBayesST package, J. Stat. Softw., 84 (2018), 1–39. https://doi.org/10.18637/jss.v084.i09 doi: 10.18637/jss.v084.i09
|
| [36] |
A. Rushworth, D. Lee, R. Mitchell, A Spatio-Temporal model for estimating the Long-Term effects of air pollution on respiratory hospital admissions in greater London, Spat. Spatiotemporal Epidemiol., 10 (2014), 29–38. https://doi.org/10.1016/j.sste.2014.05.001 doi: 10.1016/j.sste.2014.05.001
|
| [37] |
A. Das, A. Sampson, C. Lainscsek, L. Muller, W. Lin, J. Doyle, et al., Interpretation of the precision matrix and its application in estimating sparse brain connectivity during sleep spindles from human electrocorticography recording, Neural Comput., 29 (2017), 603–642. https://doi.org/10.1162/NECO_a_00936 doi: 10.1162/NECO_a_00936
|
| [38] | B. P. Carlin, T. A. Louis, Bayesian methods for data analysis, 3rd edition, CRC Press, Boca Raton, FL, 2008. |
| [39] |
B. G. Leroux, X. Lei, N. Breslow, Estimation of disease rates in small areas: A new mixed model for spatial dependence. Statistical models in epidemiology, the environment, and clinical trials, The IMA Volumes in Mathematics and its Applications, Springer, New York, NY, 116 (2000), 179–191. https://doi.org/10.1007/978-1-4612-1284-3_4 doi: 10.1007/978-1-4612-1284-3_4
|
| [40] |
T. Zhang, G. Lin, On Moran's I coefficient under heterogeneity, Comput. Stat. Data Anal., 95 (2016), 83–94. https://doi.org/10.1016/j.csda.2015.09.010 doi: 10.1016/j.csda.2015.09.010
|
| [41] |
D. Spiegelhalter, N. Best, B. Carlin, A. Van der Linde, Bayesian measures of model complexity and fit, J. R. Stat. Soc. Ser. B, 64 (2002), 583–639. https://doi.org/10.1111/1467-9868.00353 doi: 10.1111/1467-9868.00353
|
| [42] | H. Y. Bar, M. T. Wells, On graphical models and convex geometry, preprint, arXiv: 2106.14255. |
| [43] |
P. D. Jong, C. Sprenger, F. V. Veen, On extreme values of Moran's I and Geary's c (spatial autocorrelation), Geogr. Anal., 16 (1984), 17–24. https://doi.org/10.1111/j.1538-4632.1984.tb00797.x doi: 10.1111/j.1538-4632.1984.tb00797.x
|
| [44] |
J. M. Kim, Copula dynamic conditional correlation and functional principal component analysis of COVID-19 mortality in the United States, Axioms, 11 (2022), 619. https://doi.org/10.3390/axioms11110619 doi: 10.3390/axioms11110619
|
Figures(10) / Tables(2)

S. H. Sathish Indika, Norou Diawara, Hueiwang Anna Jeng, Bridget D. Giles, Dilini S. K. Gamage. Modeling the spread of COVID-19 in spatio-temporal context[J]. Mathematical Biosciences and Engineering, 2023, 20(6): 10552-10569. doi: 10.3934/mbe.2023466


 DownLoad: