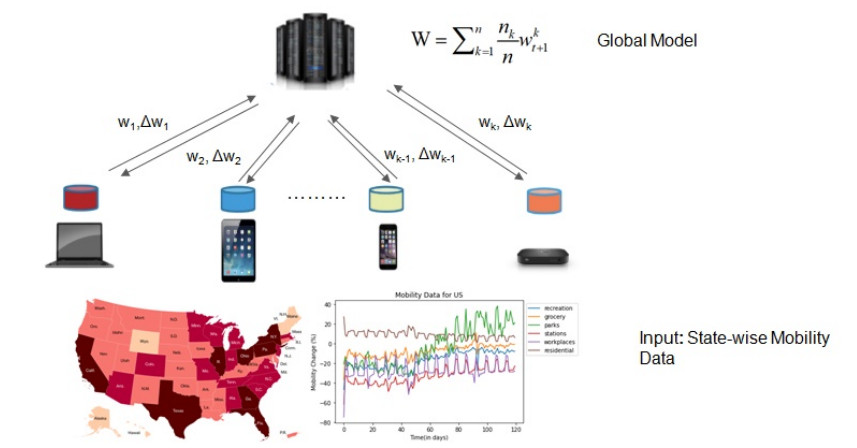
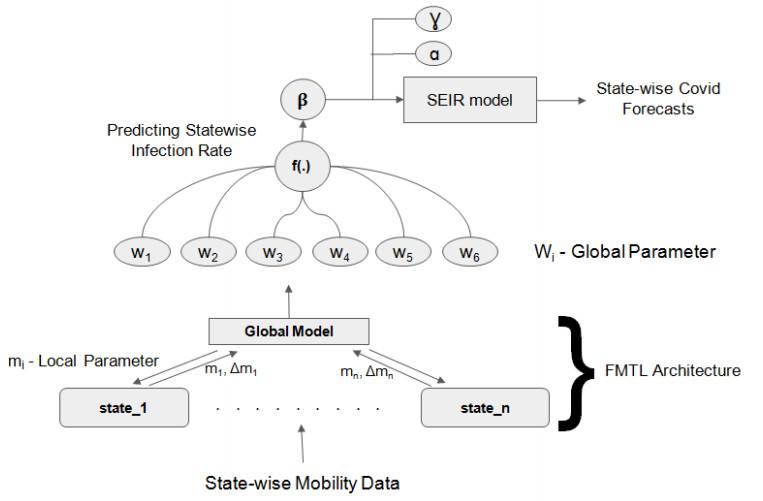
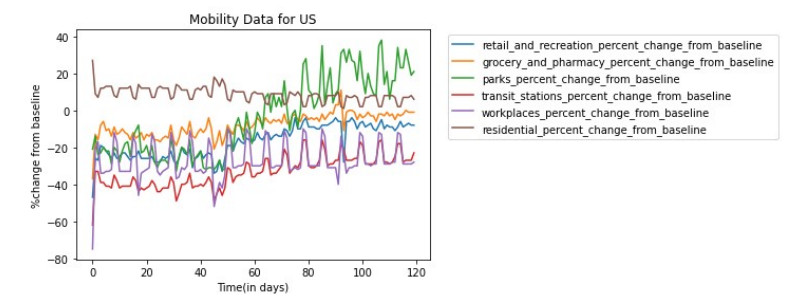
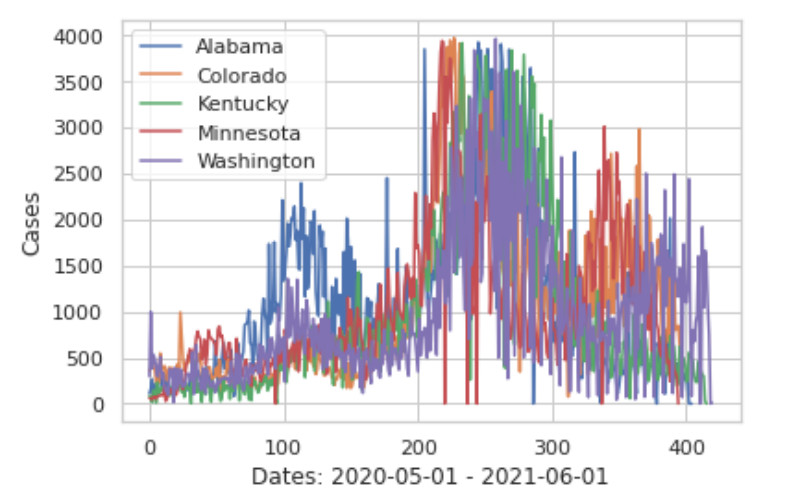
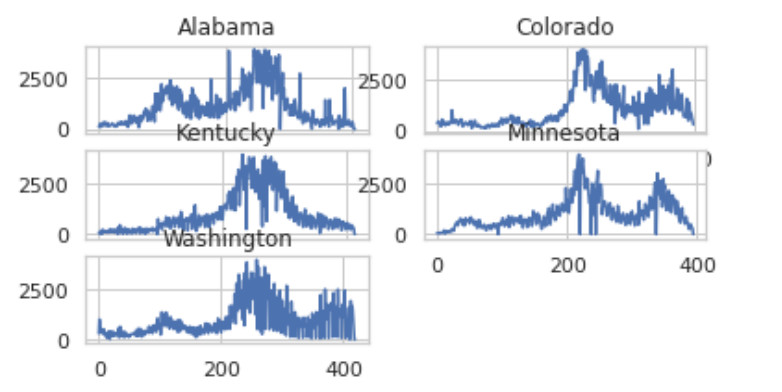
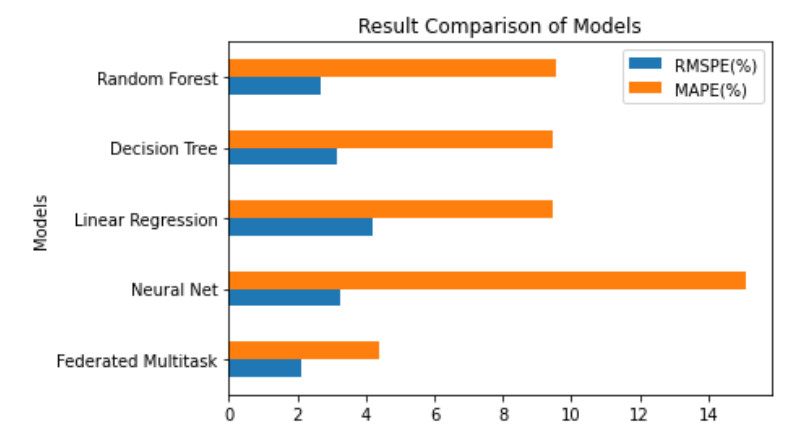
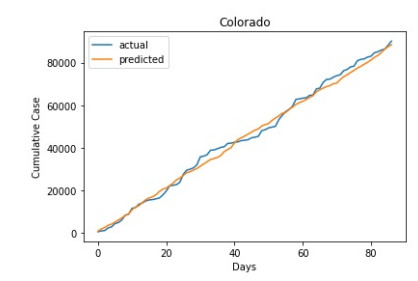
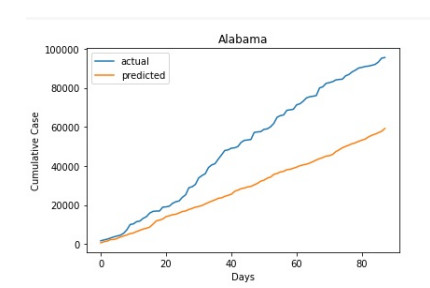
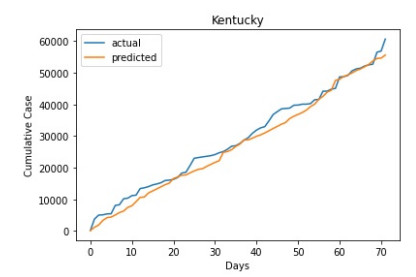
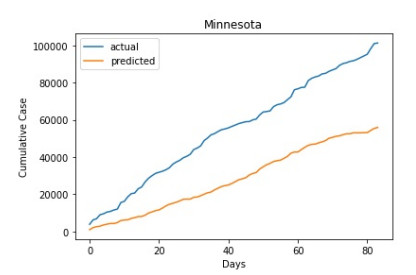
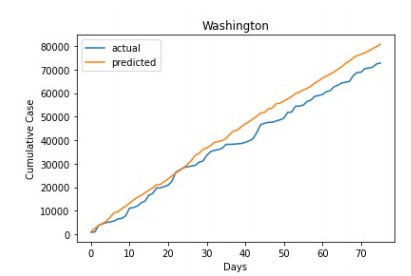
Aggregating a massive amount of disease-related data from heterogeneous devices, a distributed learning framework called Federated Learning(FL) is employed. But, FL suffers in distributing the global model, due to the heterogeneity of local data distributions. To overcome this issue, personalized models can be learned by using Federated multitask learning(FMTL). Due to the heterogeneous data from distributed environment, we propose a personalized model learned by federated multitask learning (FMTL) to predict the updated infection rate of COVID-19 in the USA using a mobility-based SEIR model. Furthermore, using a mobility-based SEIR model with an additional constraint we can analyze the availability of beds. We have used the real-time mobility data sets in various states of the USA during the years 2020 and 2021. We have chosen five states for the study and we observe that there exists a correlation among the number of COVID-19 infected cases even though the rate of spread in each case is different. We have considered each US state as a node in the federated learning environment and a linear regression model is built at each node. Our experimental results show that the root-mean-square percentage error for the actual and prediction of COVID-19 cases is low for Colorado state and high for Minnesota state. Using a mobility-based SEIR simulation model, we conclude that it will take at least 400 days to reach extinction when there is no proper vaccination or social distance.
Citation: M Kumaresan, M Senthil Kumar, Nehal Muthukumar. Analysis of mobility based COVID-19 epidemic model using Federated Multitask Learning[J]. Mathematical Biosciences and Engineering, 2022, 19(10): 9983-10005. doi: 10.3934/mbe.2022466
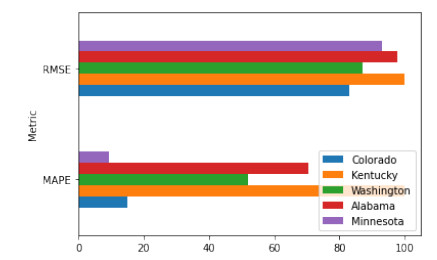
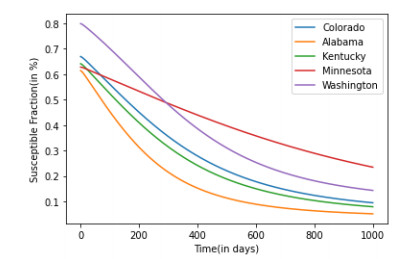
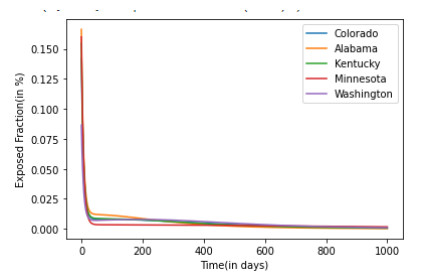
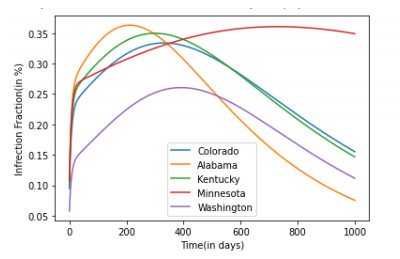
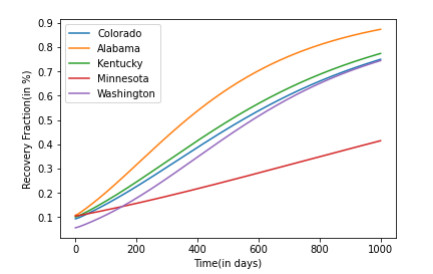
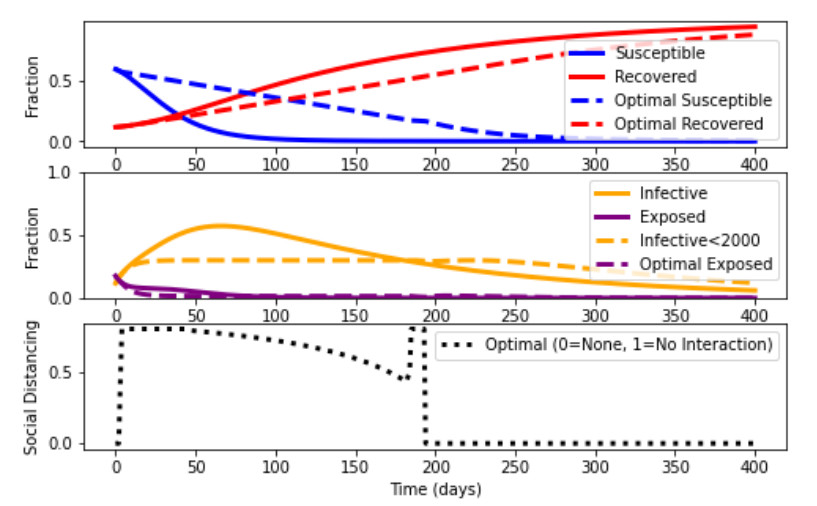
Aggregating a massive amount of disease-related data from heterogeneous devices, a distributed learning framework called Federated Learning(FL) is employed. But, FL suffers in distributing the global model, due to the heterogeneity of local data distributions. To overcome this issue, personalized models can be learned by using Federated multitask learning(FMTL). Due to the heterogeneous data from distributed environment, we propose a personalized model learned by federated multitask learning (FMTL) to predict the updated infection rate of COVID-19 in the USA using a mobility-based SEIR model. Furthermore, using a mobility-based SEIR model with an additional constraint we can analyze the availability of beds. We have used the real-time mobility data sets in various states of the USA during the years 2020 and 2021. We have chosen five states for the study and we observe that there exists a correlation among the number of COVID-19 infected cases even though the rate of spread in each case is different. We have considered each US state as a node in the federated learning environment and a linear regression model is built at each node. Our experimental results show that the root-mean-square percentage error for the actual and prediction of COVID-19 cases is low for Colorado state and high for Minnesota state. Using a mobility-based SEIR simulation model, we conclude that it will take at least 400 days to reach extinction when there is no proper vaccination or social distance.

| [1] |
D. Cucinotta, M.Vanelli, WHO declares COVID-19 a pandemic, Acta. Biomed., 91 (2020), 157–160. https://doi.org/10.23750/abm.v91i1.9397 doi: 10.23750/abm.v91i1.9397

|
| [2] |
T. Fisayo, S. Tsukagoshi, Three waves of the COVID-19 pandemic, Postgrad. Med. J., 97 (2021), 332. https://doi.org/10.1016/j.ijsu.2020.04.018 doi: 10.1016/j.ijsu.2020.04.018
|
| [3] |
M. Nicola, Z. Alsafi, C. Sohrabi, A. Kerwan, A. Al-Jabir, C. Iosifidis, et al., The socio-economic implications of the coronavirus pandemic (COVID-19): A review, Int. J. Surg., 78 (2020), 185–193. https://doi.org/10.1016/j.ijsu.2020.04.018 doi: 10.1016/j.ijsu.2020.04.018
|
| [4] |
Z. Zheng, Z. Xie, Y. Qin, Exploring the influence of human mobility factors and spread prediction on early COVID-19 in the USA, BMC Public Health, 21 (2021). https://doi.org/10.1186/s12889-021-10682-3 doi: 10.1186/s12889-021-10682-3
|
| [5] | J. Konecny, H. B. McMahan, F. X. Yu, P. Richtárik, A. T. Suresh, D. Bacon, Federated learning: Strategies for improving communication efficiency, in 29th Conference on Neural Information Processing Systems, 2016. |
| [6] | K. Bonawitz, H. Eichner, W. Grieskamp, D. Huba, A. Ingerman, V. Ivanov, et al., Towards federated learning at scale: System design, Proc. Mach. Learn. Syst., 1 (2019), 374–388. |
| [7] |
S. Azam, J. E. Macías-Díaz, N. Ahmed, I. Khan, M. S. Iqbal, Numerical modeling and theoretical analysis of a nonlinear advection-reaction epidemic system, Comput. Methods Programs Biomed., 193 (2020), 67–83. https://doi.org/10.1016/j.cmpb.2020.105429 doi: 10.1016/j.cmpb.2020.105429
|
| [8] |
M. Rafiq, J. E. Macías-Díaz, A. Raza, N. Ahmed, Design of a nonlinear model for the propagation of COVID-19 and its efficient nonstandard computational implementation, Appl. Mathl. Model., 89 (2021), 1835–1846. https://doi.org/10.1016/j.apm.2020.08.082 doi: 10.1016/j.apm.2020.08.082
|
| [9] |
J. E. Macías-Díaz, N. Ahmed, M. Rafiq, Analysis and nonstandard numerical design of a discrete three-dimensional hepatitis B epidemic model, Mathematics, 7 (2019). https://doi.org/10.3390/math7121157 doi: 10.3390/math7121157
|
| [10] |
J. Guan, Y. Wei, Y. Zhao, F. Chen, Modeling the transmission dynamics of COVID-19 epidemic: a systematic review, J. Biomed. Res., 34 (2020), 422–430. https://doi.org/10.7555/JBR.34.20200119 doi: 10.7555/JBR.34.20200119
|
| [11] |
R. ud Din, A. R. Seadawy, K. Shah, A. Ullah, D. Baleanu, Study of global dynamics of COVID-19 via a new mathematical model, Results Phys., 19 (2020). https://doi.org/10.1016/j.rinp.2020.103468 doi: 10.1016/j.rinp.2020.103468
|
| [12] |
I. F. Mello, L. Squillante, G. O. Gomes, A. C. Seridonio, M. de Souza, Epidemics, theIsing-model and percolation theory: A comprehensive review focused on Covid-19, Phys. A: Statist. Mech. Appl., 573 (2021). https://doi.org/10.1016/j.physa.2021.125963 doi: 10.1016/j.physa.2021.125963
|
| [13] |
H. A. Adekola, I. A. Adekunle, H. O. Egberongbe, S. A. Onitilo, I. N. Abdullahi, Mathematical modeling for infectious viral disease: The COVID-19 perspective, J. Public Aff., 20 (2020). https://doi.org/10.1002/pa.2306 doi: 10.1002/pa.2306
|
| [14] |
F. Özköse, M. Yavuz, M. T. Şenel, R. Habbireeh, Fractional order modelling of omicron SARS-CoV-2 variant containing heart attack effect using real data from the United Kingdom, Chaos, Solitons Fractals, 157 (2022), 111954. https://doi.org/10.1016/j.chaos.2022.111954 doi: 10.1016/j.chaos.2022.111954
|
| [15] |
P. A. Naik, M. Yavuz, S. Qureshi, Modeling and analysis of COVID-19 epidemics with treatment in fractional derivatives using real data from Pakistan, Eur. Phys. J. Plus, 135 (2020), 795. https://doi.org/10.1140/epjp/s13360-020-00819-5 doi: 10.1140/epjp/s13360-020-00819-5
|
| [16] |
B. Dasbasi, Stability analysis of an incommensurate fractional-order SIR model, Math. Modell. Numer. Simul. Appl., 1 (2021). https://doi.org/10.53391/mmnsa.2021.01.005 doi: 10.53391/mmnsa.2021.01.005
|
| [17] |
P. Kumar, V. S. Erturk, Dynamics of cholera disease by using two recent fractional numerical methods, Math. Modell. Numer. Simul. Appl., 1 (2021), 102–111. https://doi.org/10.53391/mmnsa.2021.01.010 doi: 10.53391/mmnsa.2021.01.010
|
| [18] |
F. Özköse, M. Yavuz, Investigation of interactions between COVID-19 and diabetes with hereditary traits using real data: A case study in Turkey, Comput. Biol. Med., 141 (2022). https://doi.org/10.1016/j.compbiomed.2021.105044 doi: 10.1016/j.compbiomed.2021.105044
|
| [19] |
H. Joshi, B. K. Jha, Chaos of calcium diffusion in Parkinson's infectious disease model and treatment mechanism via Hilfer fractional derivative, Math. Modell. Numer. Simul. Appl., 1 (2021), 84–94. https://doi.org/10.53391/mmnsa.2021.01.008 doi: 10.53391/mmnsa.2021.01.008
|
| [20] |
F. Özköse, M. T. Şenel, R. Habbireeh, Fractional-order mathematical modelling of cancer cells-cancer stem cells-immune system interaction with chemotherapy, Math. Modell. Numer. Simul. Appl., 1 (2021), 67–83. https://doi.org/10.53391/mmnsa.2021.01.007 doi: 10.53391/mmnsa.2021.01.007
|
| [21] |
M. Yavuz, F. Ö. Coşar, F. Günay, F. N. Özdemir, A new mathematical modeling of the COVID-19 pandemic including the vaccination campaign, Open J. Modell. Simul., 9 (2021), 299–321. https://doi.org/10.4236/ojmsi.2021.93020 doi: 10.4236/ojmsi.2021.93020
|
| [22] |
S. Allegretti, I. M. Bulai, R. Marino, M. A. Menandro, K. Parisi, Vaccination effect conjoint to fraction of avoided contacts for a Sars-Cov-2 mathematical model, Math. Modell. Numer. Simul. Appl., 1 (2021), 56–66. https://doi.org/10.53391/mmnsa.2021.01.006 doi: 10.53391/mmnsa.2021.01.006
|
| [23] |
R. Ikram, A. Khan, M. Zahri, A. Saeed, M. Yavuz, P. Kumam, Extinction and stationary distribution of a stochastic COVID-19 epidemic model with time-delay, Comput. Biol. Med., 141 (2022). https://doi.org/10.1016/j.compbiomed.2021.105115 doi: 10.1016/j.compbiomed.2021.105115
|
| [24] |
M. A. Achterberg, B. Prasse, L. Ma, S. Trajanovski, M. Kitsak, P. V. Mieghem, Comparing the accuracy of several network-based COVID-19 prediction algorithms, Int. J. Forecast., 38 (2022), 489–504. https://doi.org/10.1016/j.ijforecast.2020.10.001 doi: 10.1016/j.ijforecast.2020.10.001
|
| [25] |
E. Hernández-Pereira, O. Fontenla-Romero, V. Bolón-Canedo, Machine learning techniques to predict different levels of hospital care of CoVid-19, Appl. Intell., 52 (2022), 6413–6431. https://doi.org/10.1007/s10489-021-02743-2 doi: 10.1007/s10489-021-02743-2
|
| [26] |
J. Köhler, L. Schwenkel, A. Koch, J. Berberich, P. Pauli, F. Allgöwer, Robust and optimal predictive control of the COVID-19 outbreak, Ann. Rev. Control, 51 (2021), 525–539. https://doi.org/10.1016/j.arcontrol.2020.11.002 doi: 10.1016/j.arcontrol.2020.11.002
|
| [27] |
M. M. Morato, S. B. Bastos, D. O. Cajueiro, J. E. Normey-Rico, An optimal predictive control strategy for COVID-19 (SARS-CoV-2) social distancing policies in Brazil, Ann. Rev. Control, 50 (2020), 417–431. https://doi.org/10.1016/j.arcontrol.2020.07.001 doi: 10.1016/j.arcontrol.2020.07.001
|
| [28] |
X. Yan, Y. Zou, Optimal and sub-optimal quarantine and isolation control in SARS epidemics, Math. Comput. Model., 47 (2008), 235–245. https://doi.org/10.1016/j.mcm.2007.04.003 doi: 10.1016/j.mcm.2007.04.003
|
| [29] | M. Khouzani, S. S. Venkatesh, S. Sarkar, Market-based control of epidemics, in 2011 49th Annual Allerton Conference on Communication, Control, and Computing (Allerton), (2011), 314–320. https://doi.org/10.1109/Allerton.2011.6120184 |
| [30] | A. Argyriou, T. Evgeniou, M. Pontil, Multi-task feature learning, In NIPS '06, 19 (2006). |
| [31] |
M. Hayhoe, F. Barreras, V. M. Preciado, Multitask learning and nonlinear optimal control of the COVID-19 outbreak: A geometric programming approach, Ann. Rev. Control, 52 (2021), 495–507, https://doi.org/10.1016/j.arcontrol.2021.04.014 doi: 10.1016/j.arcontrol.2021.04.014
|
| [32] |
T. Li, A. K. Sahu, A. Talwalkar, V. Smith, Federated learning: Challenges, methods, and future directions, IEEE Sig. Process Mag., 37 (2020), 50–60. https://doi.org/10.1109/MSP.2020.2975749 doi: 10.1109/MSP.2020.2975749
|
| [33] | S. Caldas, S. M. K. Duddu, P. Wu, T. Li, J. Konečný, H. B. McMahan, et al., Leaf: A benchmark for federated settings, 2018. https://doi.org/10.48550/arXiv.1812.01097 |
| [34] | T. Li, A. K. Sahu, M. Zaheer, M. Sanjabi, A. Talwalkar, Federated optimization in heterogeneous networks, Proc. Mach. Learn. Syst., 2 (2020), 429–450. |
| [35] |
S. M. Abdul, S. Taha, M. Ramadan, COVID-19 detection using federated machine learning, PLoS One, 16 (2021). https://doi.org/10.1371/journal.pone.0252573 doi: 10.1371/journal.pone.0252573
|
| [36] |
A. Vaid, S. K. Jaladanki, J. Xu, S. Teng, Federated learning of electronic health records to improve mortality prediction in hospitalized patients with COVID-19: Machine learning approach, JMIR Med. Inf., 9 (2021). https://doi.org/10.2196/24207 doi: 10.2196/24207
|
| [37] |
M. U. Alam, R. Rahmani, Federated semi-supervised multi-task learning to detect COVID-19 and lungs segmentation marking using chest radiography images and raspberry pi devices: An internet of medical things application, Sensors, 21 (2021). https://doi.org/10.3390/s21155025 doi: 10.3390/s21155025
|
| [38] | V. Smith, C. K. Chiang, M. Sanjabi, A. Talwalkar, Federated multi-task learning, Adv. Neural Inf. Proc. Syst., 30 (2017), 4424–4434, |
| [39] |
A. Argyriou, T. Evgeniou, M. Pontil, A. Argyriou, T. Evgeniou, M. Pontil, Convex multi-task feature learning, Mach. Learn., 73 (2008), 243–272. https://doi.org/10.1007/s10994-007-5040-8 doi: 10.1007/s10994-007-5040-8
|
| [40] | A. Argyriou, C. A. Micchelli, M. Pontil, Y. Ying, A spectral regularization framework for multi-task structure learning, in International Conference on Neural Information, 20 (2007). |
| [41] |
W. O. Kermack, A. G. Mckendrick, Contribution to the mathematical theory of epidemics, Proc. R. Soc. London Ser A, 115 (1927), 700–721. https://doi.org/10.1098/rspa.1927.0118 doi: 10.1098/rspa.1927.0118
|
| [42] |
P. van den Driessche, Reproduction numbers of infectious disease models, Infect. Dis. Modell., 2 (2017), 288–303. https://doi.org/10.1016/j.idm.2017.06.002 doi: 10.1016/j.idm.2017.06.002
|
| [43] | See How Your Community is Moving Around Differently due to COVID-19, Google, 2021. Available from: https://www.google.com/covid19/mobility/index.htmlhl=en. |
| [44] | COVID-19 Data in the United States, Github, 2021. Available from: https://github.com/nytimes/covid-19-data. |
| [45] | National Population Totals: 2010–2020, US Census Bureau, 2020. Available from: https://www.census.gov/programs-surveys/popest/technical-documentation/research/evaluation-estimates/2020-evaluation-estimates/2010s-totals-national.html. |
| [46] | COVID-19 Hospital Data, HealthData.gov, 2022. |
Figures(18) / Tables(6)

M Kumaresan, M Senthil Kumar, Nehal Muthukumar. Analysis of mobility based COVID-19 epidemic model using Federated Multitask Learning[J]. Mathematical Biosciences and Engineering, 2022, 19(10): 9983-10005. doi: 10.3934/mbe.2022466


 DownLoad: