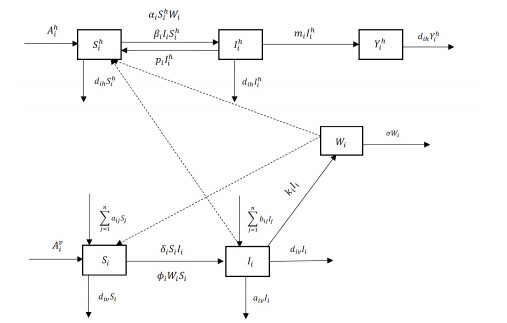
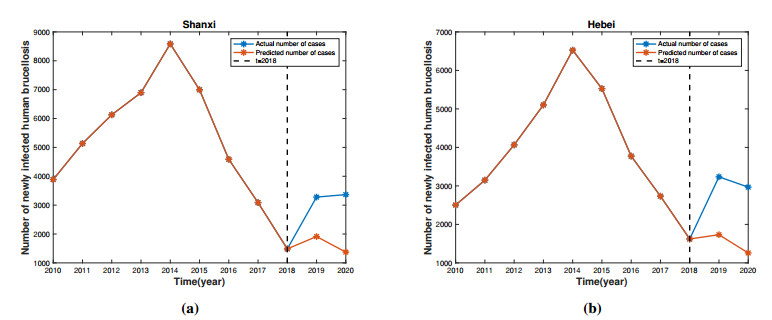
Brucellosis is a zoonotic disease caused by Brucella, and it is an important infectious disease all over the world. The prevalence of brucellosis in the Chinese mainland has some spatial characteristics besides the temporal trend in recent years. Due to the large-scale breeding of sheep and the frequent transportation of sheep in various regions, brucellosis spreads wantonly in pastoral areas, and human brucellosis spreads from traditional pastoral areas and semi-pastoral areas in the north to non-pastoral areas with low incidence in the south. In order to study the influence of sheep immigration on the epidemic transmission, a patch dynamics model was established. In each patch, the sub-model was composed of humans, sheep and Brucella. The basic reproduction number, disease-free equilibrium and positive equilibrium of the model were discussed. On the other hand, taking Shanxi Province and Hebei Province as examples, we carried out numerical simulations. The results show that the basic reproduction numbers of Shanxi Province and Hebei Province are 0.7497 and 0.5022, respectively, which indicates that the current brucellosis in the two regions has been effectively controlled. To reduce brucellosis faster in the two provinces, there should be a certain degree of sheep immigration from high-infection area to low-infection areas, and reduce the immigration of sheep from low-infection areas to high-infection areas.
Citation: Yaoyao Qin, Xin Pei, Mingtao Li, Yuzhen Chai. Transmission dynamics of brucellosis with patch model: Shanxi and Hebei Provinces as cases[J]. Mathematical Biosciences and Engineering, 2022, 19(6): 6396-6414. doi: 10.3934/mbe.2022300
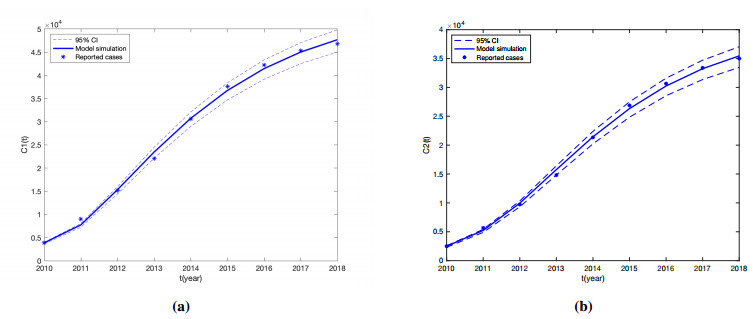
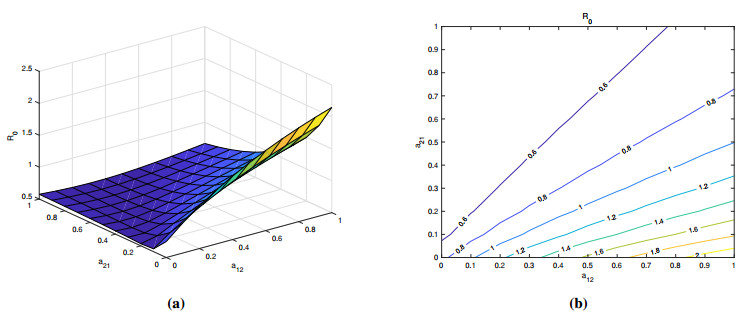
Brucellosis is a zoonotic disease caused by Brucella, and it is an important infectious disease all over the world. The prevalence of brucellosis in the Chinese mainland has some spatial characteristics besides the temporal trend in recent years. Due to the large-scale breeding of sheep and the frequent transportation of sheep in various regions, brucellosis spreads wantonly in pastoral areas, and human brucellosis spreads from traditional pastoral areas and semi-pastoral areas in the north to non-pastoral areas with low incidence in the south. In order to study the influence of sheep immigration on the epidemic transmission, a patch dynamics model was established. In each patch, the sub-model was composed of humans, sheep and Brucella. The basic reproduction number, disease-free equilibrium and positive equilibrium of the model were discussed. On the other hand, taking Shanxi Province and Hebei Province as examples, we carried out numerical simulations. The results show that the basic reproduction numbers of Shanxi Province and Hebei Province are 0.7497 and 0.5022, respectively, which indicates that the current brucellosis in the two regions has been effectively controlled. To reduce brucellosis faster in the two provinces, there should be a certain degree of sheep immigration from high-infection area to low-infection areas, and reduce the immigration of sheep from low-infection areas to high-infection areas.

| [1] | E. J. Richey, C. D. Harrell, Brucella abortus disease (brucellosis) in beef cattle, 1997. |
| [2] |
M. T. Li, G. Q. Sun, J. Zhang, Z. Jin, X. D. Sun, Y. M. Wang, et al., Transmission dynamics and control for a brucellosis model in Hinggan League of Inner Mongolia, China, Math. Biosci. Eng., 11 (2014), 1115–1137. https://doi.org/10.3934/mbe.2014.11.1115 doi: 10.3934/mbe.2014.11.1115

|
| [3] |
M. N. Seleem, S. M. Boyle, N. Sriranganathan, Brucellosis: A re-emerging zoonosis, Vet. Microbiol., 140 (2009), 392–398. https://doi.org/10.1016/j.vetmic.2009.06.021 doi: 10.1016/j.vetmic.2009.06.021
|
| [4] |
G. Q. Sun, M. T. Li, J. Zhang, W. Zhang, Z. Jin, Transmission dynamics of brucellosis: Mathematical modelling and applications in China, Comput. Struct. Biotechnol. J., 18 (2020), 3843–3860. https://doi.org/10.1016/j.csbj.2020.11.014 doi: 10.1016/j.csbj.2020.11.014
|
| [5] |
Y. Lin, M. H. Xu, X. Y. Zhang, T. Zhang, An exploratory study of factors associated with human brucellosis in mainland China based on time-series-cross-section data from 2005 to 2016, PLoS ONE, 14 (2019), e0208292. https://doi.org/10.1371/journal.pone.0208292 doi: 10.1371/journal.pone.0208292
|
| [6] |
S. J. Lai, H. Zhou, W. Y. Xiong, M. Gilbert, Z. J. Huang, J. X. Yu, et al., Changing epidemiology of human brucellosis, China, 1955–2014, Emerg. Infect. Dis., 23 (2017), 184. https://doi.org/10.3201/eid2302.151710 doi: 10.3201/eid2302.151710
|
| [7] |
H. Jiang, M. G. Fan, J. D. Chen, J. C. Mi, B. Y. Cui, MLVA genotyping of Chinese human Brucella melitensisbiovar 1, 2 and 3 isolates, Bmc. Microbiol., 11 (2011), 256–256. https://doi.org/10.1186/1471-2180-11-256 doi: 10.1186/1471-2180-11-256
|
| [8] |
X. Ma, X. F. Luo, L. Li, Y. Li, G. Q. Sun, The influence of mask use on the spread of COVID-19 during pandemic in New York City, Results Phys., 34 (2022), 105–224. https://doi.org/10.1016/j.rinp.2022.105224 doi: 10.1016/j.rinp.2022.105224
|
| [9] |
K. K. J. Asamoah, O. Eric, A. Abidemi, S. E. Moore, G. Q. Sun, Z. Jin, et al., Optimal control and comprehensive cost-effectiveness analysis for COVID-19, Results Phys., 33 (2022), 105–117. https://doi.org/10.1016/j.rinp.2022.105177 doi: 10.1016/j.rinp.2022.105177
|
| [10] |
Q. Hou, X. D. Sun, Modeling sheep brucellosis transmission with a multi-stage model in Changling County of Jilin Province, China, J. Appl. Math. Comput., 51 (2016), 227–244. https://doi.org/10.1007/s12190-015-0901-y doi: 10.1007/s12190-015-0901-y
|
| [11] |
Q. L. Chen, S. J. Lai, W. W. Yin, H. Zhou, Y. Li, D. Mu, et al., Epidemic characteristics, high-risk townships and space-time clusters of human brucellosis in Shanxi Province of China, 2005–2014, BMC Infect. Dis., 16 (2016), 1–10. https://doi.org/10.1186/s12879-016-2086-x doi: 10.1186/s12879-016-2086-x
|
| [12] | J. Zhang, S. G. Ruan, G. Q. Sun, X. D. Sun, Z. Jin, Analysis of a multi-patch dynamical model about cattle brucellosis, J. Shanghai Norm. Univ.: Nat. Sci. Math., 43 (2014), 15. |
| [13] |
P. Dreessche, J. Watmough, Reproduction numbers and sub-threshold endemic equilibria for compartmental models of disease transmission, Math. Biosci., 180 (2002), 29–48. https://doi.org/10.1016/S0025-5564(02)00108-6 doi: 10.1016/S0025-5564(02)00108-6
|
| [14] | H. Smith, Monotone Dynamical Systems: An Introduction to the Theory of Competitive and Cooperative Systems, Ams Ebooks Program, 1995. http://dx.doi.org/10.1090/surv/041 |
| [15] | M. Y. Li, An Introduction to Mathematical Modeling of Infectious Diseases, Cham, Switzerland, 2018. https://doi.org/10.1007/978-3-319-72122-4 |
| [16] | R. A. Horn, C. R. Johnson, Topics in Matrix Analysis, Cambridge University Press, 1985. https://doi.org/10.1017/CBO9780511810817 |
| [17] |
D. Gao, S. Ruan, A multipatch malaria model with logistic growth populations, SIAM J. Appl. Math., 72 (2012), 819–841. https://doi.org/10.1137/110850761 doi: 10.1137/110850761
|
| [18] |
J. K. Hale, O. Lopes, Fixed point theorems and dissipative processes, J. Differ. Equations, 12 (1973), 391–402. https://doi.org/10.1016/0022-0396(73)90025-9 doi: 10.1016/0022-0396(73)90025-9
|
| [19] | H. K. Khalil, Y. S. Zhu, H. Dong, Z. Z. Li, Nonlinear Systems, 3nd edition, Publishing House of Electronics Industry, Bei Jing, 2005. |
| [20] |
Thieme, R. Horst, Persistence under relaxed point-dissipativity (with application to an endemic model), Siam J. Math. Anal., 24 (2006), 407–435. https://doi.org/10.1137/0524026 doi: 10.1137/0524026
|
| [21] | X. Q. Zhao, Uniform persistence and periodic coexistence states in infinite-dimensional periodic semiflows with applications, Can. Appl. Math. Q., 3 (1995), 473–495. |
| [22] | X. Zhao, Z. Jing, Global asymptotic behavior in some cooperative systems of functional differential equations, Can. Appl. Math. Q., 4 (1996), 421–444. |
| [23] | X. Q. Zhao, Dynamical Systems in Population Biology, Springer, New York, 2003. https://doi.org/10.1007/978-3-319-56433-3 |
| [24] |
Q. Hou, X. D. Sun, J. Zhang, Y. J. Liu, Z. Jin, Modeling the transmission dynamics of sheep brucellosis in Inner Mongolia Autonomous Region, China, Math. Biosci., 242 (2013), 51–58. https://doi.org/10.1016/j.mbs.2012.11.012 doi: 10.1016/j.mbs.2012.11.012
|
| [25] |
H. Jiang, D. O'Callaghan, J. B. Ding, Brucellosis in China: History, progress and challenge, Infect. Dis. Poverty, 9 (2020). https://doi.org/10.1186/s40249-020-00673-8 doi: 10.1186/s40249-020-00673-8
|
Figures(8) / Tables(1)

Yaoyao Qin, Xin Pei, Mingtao Li, Yuzhen Chai. Transmission dynamics of brucellosis with patch model: Shanxi and Hebei Provinces as cases[J]. Mathematical Biosciences and Engineering, 2022, 19(6): 6396-6414. doi: 10.3934/mbe.2022300


 DownLoad: