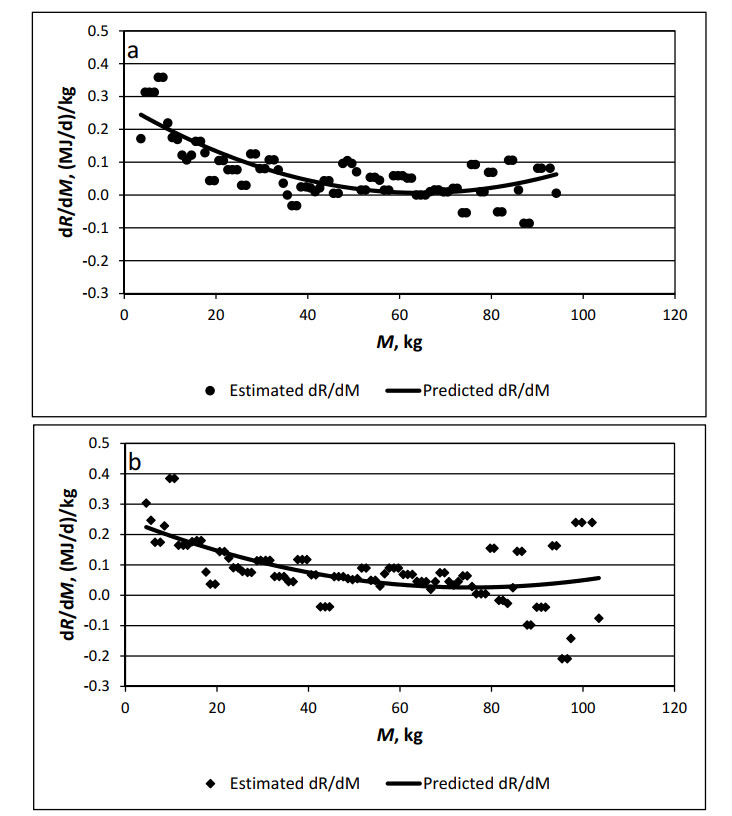
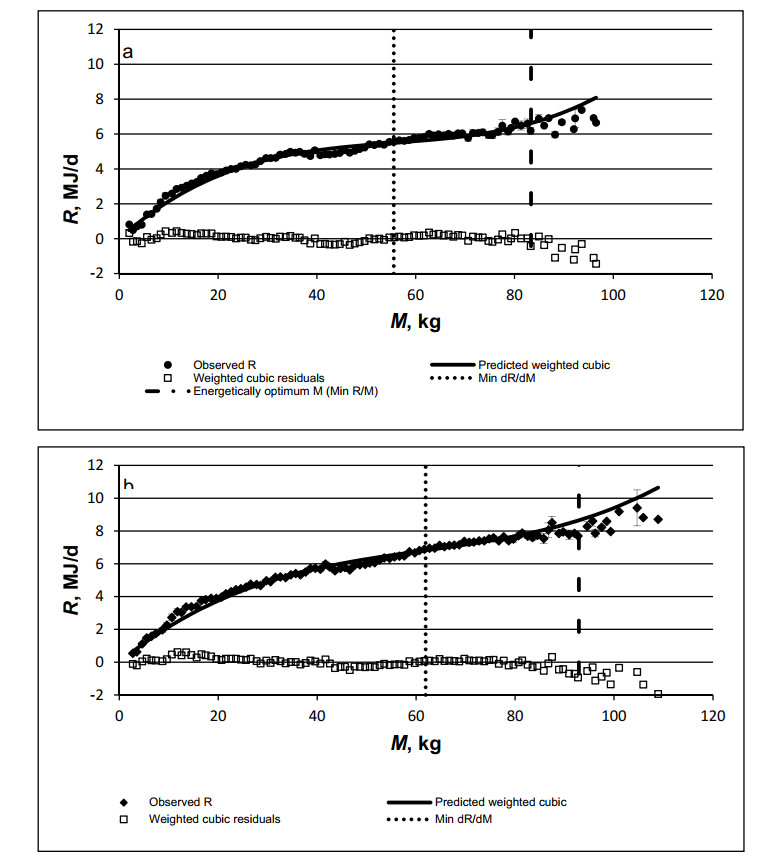
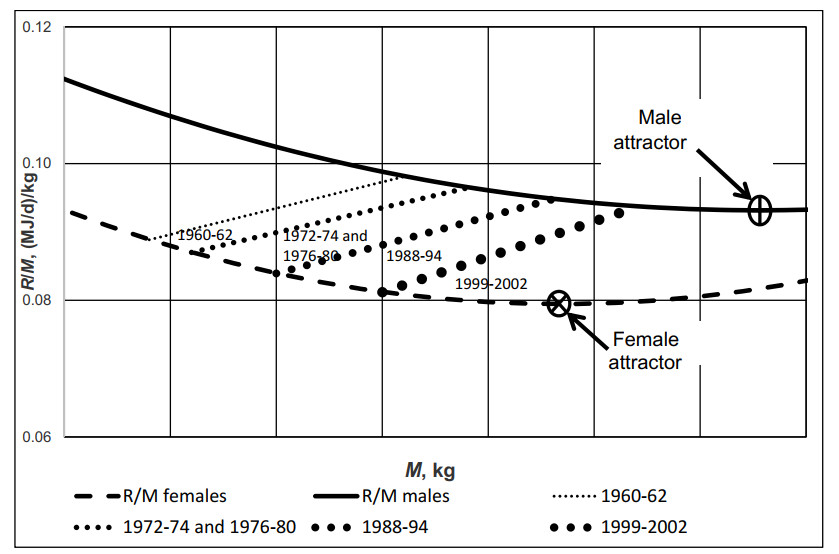
Our goal was to examine how total, average (heat production rate per unit mass) and marginal (the increase in the heat production rate per unit increase in mass) rates of basal heat production changed as mass increased in growing humans. Specifically, our hypotheses were that the marginal basal heat production rate did not decrease monotonically as humans grew; and that an energetically optimal mass, one at which the average basal heat production rate of a growing human was minimal, existed. Marginal rates of heat production were estimated and six potential models to describe the effect of mass during human growth on basal heat production rate were evaluated using a large, meticulously curated, dataset from the literature. Marginal rates of heat production were quadratically related to body mass during growth; they declined initially, reached a minimum, and then increased. This suggested that the relationship between basal heat production rate and mass was cubic. Of the six potential models evaluated, a three-parameter cubic polynomial best described the data. Marginal rates of heat production were minimal for 56-kg females and 62-kg males. Basal heat production rates per unit mass of a growing human were minimal (i.e., energetically optimal) for 83-kg females and 93-kg males; the average masses of U.S. adults have been increasing and approaching these optima over the last 60 yr.
Citation: Michael R. Murphy, Bruce M. Hannon. Total, average and marginal rates of basal heat production during human growth[J]. Mathematical Biosciences and Engineering, 2021, 18(5): 6806-6818. doi: 10.3934/mbe.2021338
Our goal was to examine how total, average (heat production rate per unit mass) and marginal (the increase in the heat production rate per unit increase in mass) rates of basal heat production changed as mass increased in growing humans. Specifically, our hypotheses were that the marginal basal heat production rate did not decrease monotonically as humans grew; and that an energetically optimal mass, one at which the average basal heat production rate of a growing human was minimal, existed. Marginal rates of heat production were estimated and six potential models to describe the effect of mass during human growth on basal heat production rate were evaluated using a large, meticulously curated, dataset from the literature. Marginal rates of heat production were quadratically related to body mass during growth; they declined initially, reached a minimum, and then increased. This suggested that the relationship between basal heat production rate and mass was cubic. Of the six potential models evaluated, a three-parameter cubic polynomial best described the data. Marginal rates of heat production were minimal for 56-kg females and 62-kg males. Basal heat production rates per unit mass of a growing human were minimal (i.e., energetically optimal) for 83-kg females and 93-kg males; the average masses of U.S. adults have been increasing and approaching these optima over the last 60 yr.

| [1] |
F. G. Benedict, Factors affecting basal metabolism, J. Biol. Chem., 20 (1915), 263-299. doi: 10.1016/S0021-9258(18)88244-8

|
| [2] |
M. A. Holliday, D. Potter, A. Jarrah, S. Bearg, The relation of metabolic rate to body weight and organ size, Pediatr. Res., 1 (1967), 185-195. doi: 10.1203/00006450-196705000-00005
|
| [3] | W. N. Schofield, Predicting basal metabolic rate, new standards and review of previous work, Clin. Nutr., 39 (1985), 5-41. |
| [4] |
C. J. D. Henry, Basal metabolic rate studies in humans: measurement and development of new equations, Public Health Nutr., 8 (2005), 1133-1152. doi: 10.1079/PHN2005801
|
| [5] | S. K. Das, S. B. Roberts, Energy metabolism in fasting, fed, exercise, and re-feeding states, in Present Knowledge in Nutrition (eds. J. W. Erdman, Jr., I. A. Macdonald and S. H. Zeisel), Wiley-Blackwell, (2012), 58-68. |
| [6] | M. Kleiber, The Fire of Life: An Introduction to Animal Energetics, Krieger, (1975). |
| [7] | Z. Wang, J. Zhang, Z. Ying, S. B. Heymsfield, Organ-tissue level model of resting energy expenditure across mammals: New insights into Kleiber's Law, ISRN Zool., 2012 (2012), 1-9. |
| [8] | National Research Council, Nutrient Requirements of Swine, National Academies Press, (2012). |
| [9] | National Research Council, Nutrient Requirements of Beef Cattle, National Academies Press, (2016). |
| [10] |
B. M. Hannon, M. R. Murphy, Toward a theory of energetically optimal body size in growing animals, J. Anim. Sci., 94 (2016), 2532-2541. doi: 10.2527/jas.2016-0283
|
| [11] |
A. M. Prentice, A. E. Black, P. R. Murgatroyd, G. R. Goldberg, W. A. Coward, Metabolism or appetite: questions of energy balance with particular reference to obesity, J. Hum. Nutr. Diet., 2 (1989), 95-104. doi: 10.1111/j.1365-277X.1989.tb00014.x
|
| [12] |
B. Hannon, Biological time value, Math. Biosci., 100 (1990), 115-140. doi: 10.1016/0025-5564(90)90050-9
|
| [13] | C. Schofield, An annotated bibliography of source material for basal metabolic rate data, Clin. Nutr., 39 (1985), 42-91. |
| [14] | M. Kleiber, Metabolic Rate and Food Utilization as a Function of Body Size, (1961). |
| [15] |
M. D. Mifflin, S. T. St Jeor, L. A. Hill, B. J. Scott, S. A. Daugherty, Y. O. Koh, A new predictive equation for resting energy expenditure in healthy individuals, Am. J. Clin. Nutr., 51 (1990), 241-247. doi: 10.1093/ajcn/51.2.241
|
| [16] | K. G. Tay, S. L. Kek, R. Abdul-Kahar, Numerical differentiation spreadsheet calculator, Proc. National Symp. Appl. Sci. Math., 2013 (2013), 111-120. |
| [17] | D. Rogosa, Myths and methods: "Myths about longitudinal research" plus supplemental questions, in The Analysis of Change (ed. J. M. Gottman), Lawrence Erlbaum, (1995), 3-65. |
| [18] | J. W. Tukey, Exploratory Data Analysis, Reading, Addison-Wesley, (1977). |
| [19] | NLREG, Available from: http://NLREG.com. |
| [20] | K. P. Burnham, D. R. Anderson, Model Selection and Multimodel Inference: A practical information-theoretic approach, Springer-Verlag, 2002. |
| [21] | A. N. Spiess, N. Neumeyer, An evaluation of R2 as an inadequate measure for nonlinear models in pharmacological and biochemical research: A Monte Carlo approach, BMC Pharmacol., 10 (2010), 1-11. |
| [22] | S. D. Hodges, P. G. Moore, Data uncertainties and least squares regression, J. R. Stat. Soc. C Appl., 21 (1972), 185-195. |
| [23] | A. N. Spiess, Orthogonal nonlinear least-squares regression, (2015). Available from: https://rdrr.io/cran/onls/man/onls.html. |
| [24] | R. L. Branham Jr, Astronomical data reduction with total least squares, New Astron. Rev., 45 (2001), 649-661. |
| [25] |
T. Psota, K. Y. Chen, Measuring energy expenditure in clinical populations: rewards and challenges, Eur. J. Clin. Nutr., 67 (2013), 436-442. doi: 10.1038/ejcn.2013.38
|
| [26] | A. L. Silva, J. Teles, L. F. Olivares, I. Fragoso, Energy intake and expenditure in children and adolescents, contributions of biological maturity, Am. J. Hum. Biol., 2020 (2020), 1-14. |
| [27] |
B. M. Hannon, M. R. Murphy, Progressive limit feeding to maximize profit in the feedlot, J. Anim. Sci., 97 (2019), 1600-1608. doi: 10.1093/jas/skz027
|
| [28] |
R. G. McMurray, J. Soares, C. J. Caspersen, T. McCurdy, Examining variations of resting metabolic rate of adults: A public health perspective, Med. Sci. Sports Exerc., 46 (2014), 1352-1358. doi: 10.1249/MSS.0000000000000232
|
| [29] | C. L. Ogden, C. D. Fryar, M. D. Carroll, K. M. Flegal, Mean body weight, height, and body mass index: United States 1960-2002, Department of Health and Human Services, Centers for Disease Control and Prevention, National Center for Health Statistics, 2004. |
| [30] | C. D. Fryar, D. Kruszon-Moran, Q. Gu, C. L. Ogden, Mean body weight, height, waist circumference, and body mass index among adults: United States, 1999-2000 through 2015-2016, 2018. Available from: https://stacks.cdc.gov/view/cdc/61430. |
| [31] | J. D. Wright, J. Kennedy-Stephenson, C. Y. Wang, M. A. McDowell, C. L. Johnson, Trends in intake of energy and macronutrients - United States, 1971-2000, MMWR Morb. Mortal. Wkly Rep., 53 (2004), 80-82. |
| [32] | S. H. Strogatz, Nonlinear Dynamics and Chaos, CRC Press, 2015. |
| [33] |
E. Di Angelantonio, S. N. Bhupathiraju, D. Wormser, P. Gao, S. Kaptoge, A. Berrington de Gonzalez et al., Body-mass index and all-cause mortality: Individual-participant-data meta-analysis of 239 prospective studies in four continents, Lancet, 388 (2016), 776-786. doi: 10.1016/S0140-6736(16)30175-1
|
| [34] | F. Branca, P. D'Acapito, Seasonality, in Encyclopedia of Human Nutrition (ed. B Caballero), Academic Press, (2013), 178-185. |
| [35] | R. Walker, M. Gurven, K. Hill, A. Migliano, N. Chagnon, R. De Souza, et al., Growth rates and life histories in twenty-two small-scale societies. Am. J. Hum. Biol., 18 (2006), 295-311. |
Figures(4) / Tables(1)

Michael R. Murphy, Bruce M. Hannon. Total, average and marginal rates of basal heat production during human growth[J]. Mathematical Biosciences and Engineering, 2021, 18(5): 6806-6818. doi: 10.3934/mbe.2021338


 DownLoad: