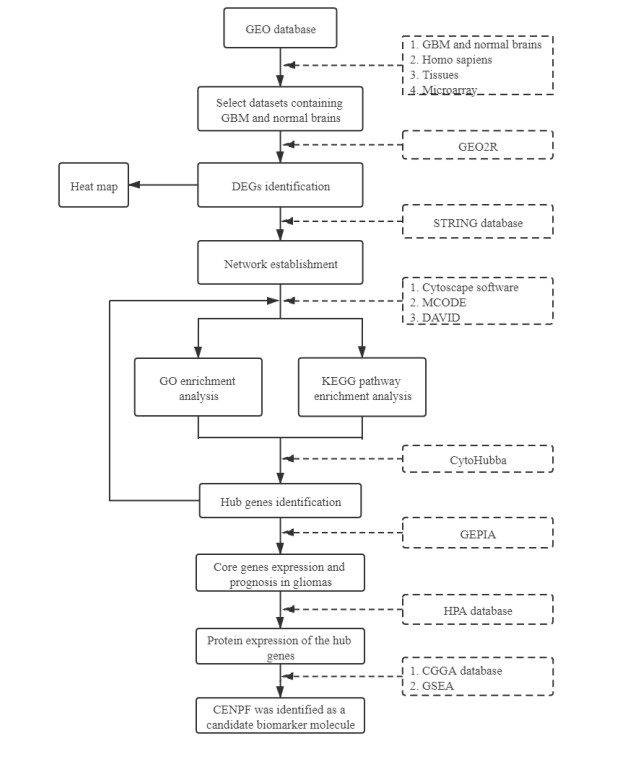
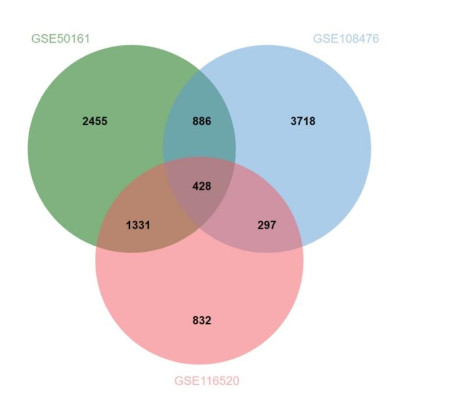
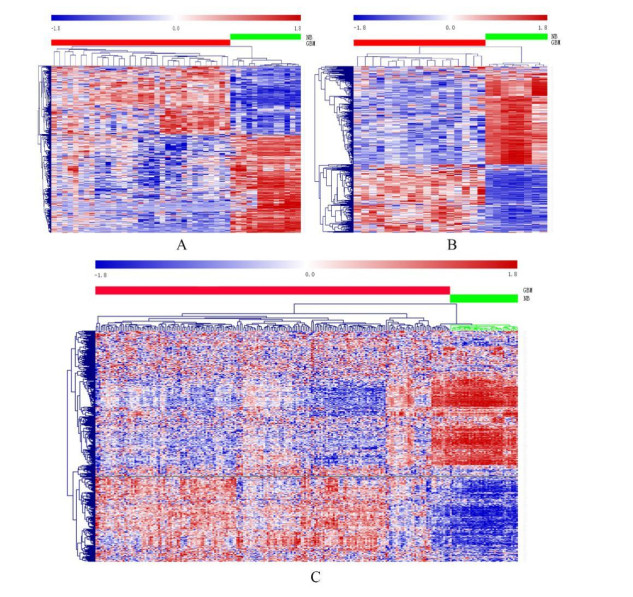
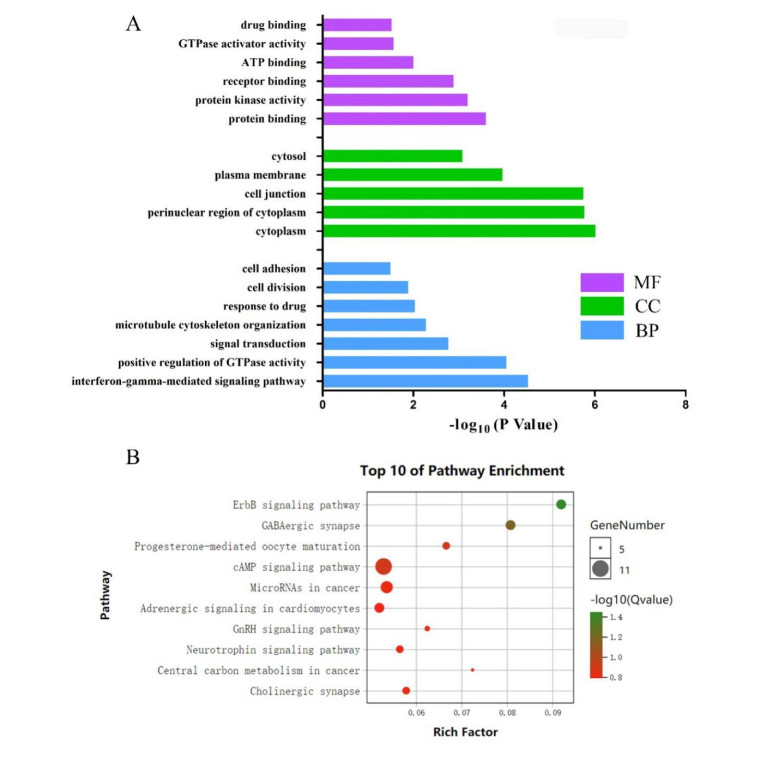
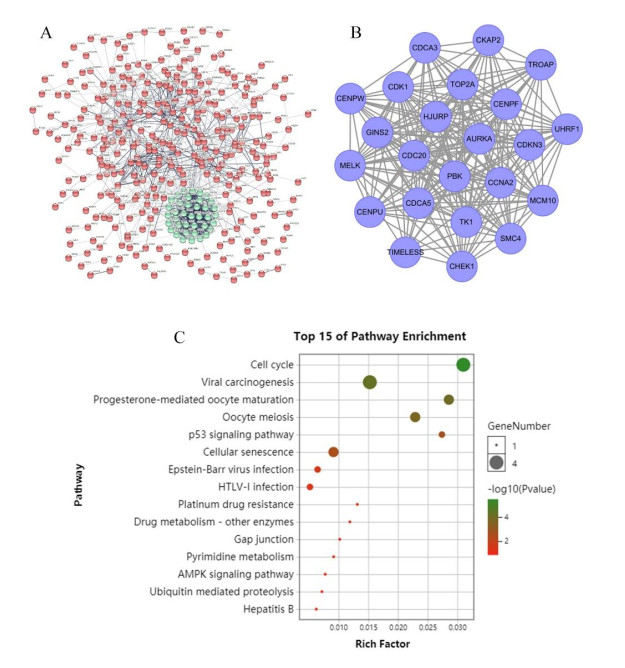
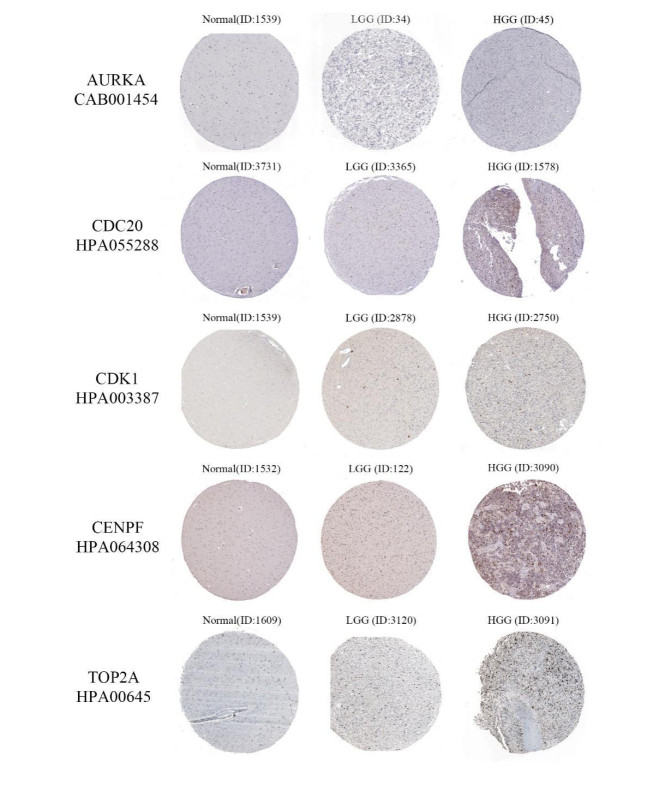
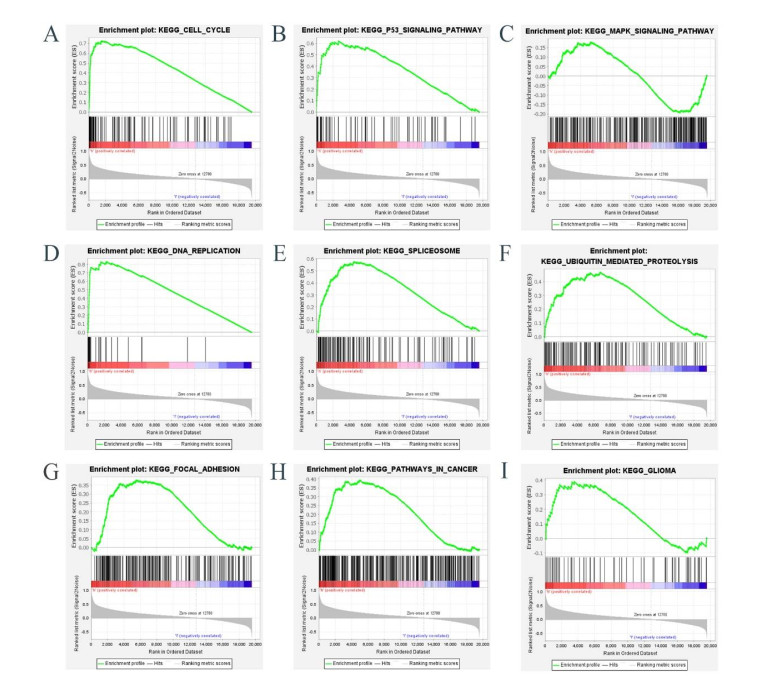
Gliomas are common malignant tumors of the central nervous system. Despite the surgical resection and postoperative radiotherapy and chemotherapy, the prognosis of glioma remains poor. Therefore, it is important to reveal the molecular mechanisms that promotes glioma progression. Microarray datasets were obtained from the Gene Expression Omnibus (GEO) database. The GEO2R tool was used to identify 428 differentially expressed genes (DEGs) and a core module from three microarray datasets. Heat maps were drawn based on DEGs. Gene Ontology (GO) and Kyoto Encyclopedia of Genes and Genomes (KEGG) pathway enrichment analysis were performed using the DAVID database. The core module was significantly involved in several KEGG pathways, such as "cell cycle", "viral carcinogenesis", "progesterone-mediated oocyte maturation", "p53 signaling pathway". The protein-protein interaction (PPI) networks and modules were built using the STRING database and the MCODE plugin, respectively, which were visualized using Cytoscape software. Identification of hub genes in the core module using the CytoHubba plugin. The top modular genes AURKA, CDC20, CDK1, CENPF, and TOP2A were associated with glioma development and prognosis. In the Human Protein Atlas (HPA) database, CDC20, CENPF and TOP2A have significant protein expression. Univariate and multivariate cox regression analysis showed that only CENPF had independent influencing factors in the CGGA database. GSEA analysis found that CENPF was significantly enriched in the cell cycle, P53 signaling pathway, MAPK signaling pathway, DNA replication, spliceosome, ubiquitin-mediated proteolysis, focal adhesion, pathway in cancer, glioma, which was highly consistent with previous studies. Our study revealed a core module that was highly correlated with glioma development. The key gene CENPF and signaling pathways were identified through a series of bioinformatics analysis. CENPF was identified as a candidate biomarker molecule.
Citation: Moxuan Zhang, Quan Zhang, Jilin Bai, Zhiming Zhao, Jian Zhang. Transcriptome analysis revealed CENPF associated with glioma prognosis[J]. Mathematical Biosciences and Engineering, 2021, 18(3): 2077-2096. doi: 10.3934/mbe.2021107
Gliomas are common malignant tumors of the central nervous system. Despite the surgical resection and postoperative radiotherapy and chemotherapy, the prognosis of glioma remains poor. Therefore, it is important to reveal the molecular mechanisms that promotes glioma progression. Microarray datasets were obtained from the Gene Expression Omnibus (GEO) database. The GEO2R tool was used to identify 428 differentially expressed genes (DEGs) and a core module from three microarray datasets. Heat maps were drawn based on DEGs. Gene Ontology (GO) and Kyoto Encyclopedia of Genes and Genomes (KEGG) pathway enrichment analysis were performed using the DAVID database. The core module was significantly involved in several KEGG pathways, such as "cell cycle", "viral carcinogenesis", "progesterone-mediated oocyte maturation", "p53 signaling pathway". The protein-protein interaction (PPI) networks and modules were built using the STRING database and the MCODE plugin, respectively, which were visualized using Cytoscape software. Identification of hub genes in the core module using the CytoHubba plugin. The top modular genes AURKA, CDC20, CDK1, CENPF, and TOP2A were associated with glioma development and prognosis. In the Human Protein Atlas (HPA) database, CDC20, CENPF and TOP2A have significant protein expression. Univariate and multivariate cox regression analysis showed that only CENPF had independent influencing factors in the CGGA database. GSEA analysis found that CENPF was significantly enriched in the cell cycle, P53 signaling pathway, MAPK signaling pathway, DNA replication, spliceosome, ubiquitin-mediated proteolysis, focal adhesion, pathway in cancer, glioma, which was highly consistent with previous studies. Our study revealed a core module that was highly correlated with glioma development. The key gene CENPF and signaling pathways were identified through a series of bioinformatics analysis. CENPF was identified as a candidate biomarker molecule.

| [1] |
M. Qian, S. Wang, X. Guo, J. Wang, Z. Zhang, W. Qiu, et al., Hypoxic glioma-derived exosomes deliver microRNA-1246 to induce M2 macrophage polarization by targeting TERF2IP via the STAT3 and NF-κB pathways, Oncogene, 39 (2020), 428-442. doi: 10.1038/s41388-019-0996-y

|
| [2] |
Z. P. Wen, W. J. Zeng, Y. H. Chen, H. Li, J. Y. Wang, Q. Cheng, et al., Knockdown ATG4C inhibits gliomas progression and promotes temozolomide chemosensitivity by suppressing autophagic flux, J. Exp. Clin. Cancer Res., 38 (2019), 1-15. doi: 10.1186/s13046-018-1018-6
|
| [3] |
X. Chen, M. Zhang, H. Gan, H. Wang, J. H. Lee, D. Fang, et al., A novel enhancer regulates MGMT expression and promotes temozolomide resistance in glioblastoma, Nat. Commun., 9 (2018), 1-14. doi: 10.1038/s41467-017-02088-w
|
| [4] |
Y. Chen, P. Liu, P. Sun, J. Jiang, Y. Zhu, T. Dong, et al., Oncogenic MSH6-CXCR4-TGFB1 feedback loop: a novel therapeutic target of photothermal therapy in glioblastoma multiforme, Theranostics, 9 (2019), 1453-1473. doi: 10.7150/thno.29987
|
| [5] | T. Liu, A. Li, Y. Xu, Y. Xin, Momelotinib sensitizes glioblastoma cells to temozolomide by enhancement of autophagy via JAK2/STAT3 inhibition, Oncol. Rep., 41 (2019), 1883-1892. |
| [6] |
J. Ruiz, D. Case, G. Enevold, R. Rosdhal, S. B. Tatter, T.L. Ellis, et al., A phase Ⅱ trial of thalidomide and procarbazine in adult patients with recurrent or progressive malignant gliomas, J. Neurooncol, 106 (2012), 611-617. doi: 10.1007/s11060-011-0698-y
|
| [7] |
M. Nagane, R. Nishikawa, Y. Narita, H. Kobayashi, S. Takano, N. Shinoura, et al., Phase Ⅱ study of single-agent bevacizumab in Japanese patients with recurrent malignant glioma, Jpn. J. Clin. Oncol., 42 (2012) 887-895. doi: 10.1093/jjco/hys121
|
| [8] |
T. Jiang, Y. Mao, W. Ma, Q. Mao, Y. You, X. Yang, et al., CGCG clinical practice guidelines for the management of adult diffuse gliomas, Cancer Lett, 375 (2016) 263-273. doi: 10.1016/j.canlet.2016.01.024
|
| [9] | Cancer Genome Atlas Research Network, Comprehensive genomic characterization defines human glioblastoma genes and core pathways, Nature, 455 (2008), 1061. |
| [10] |
H. Wang, A. K. Diaz, T. I. Shaw, Y. Li, M. Niu, J. H. Cho, et al., Deep multiomics profiling of brain tumors identifies signaling networks downstream of cancer driver genes, Nat. Commun., 10 (2019) 1-15. doi: 10.1038/s41467-018-07882-8
|
| [11] |
B. Zhang, Q. Wu, R. Xu, X. Hu, Y. Sun, Q. Wang, et al., The promising novel biomarkers and candidate small molecule drugs in lower-grade glioma: Evidence from bioinformatics analysis of high-throughput data, J. Cell. Biochem., 120 (2019), 15106-15118. doi: 10.1002/jcb.28773
|
| [12] |
B. Kamaraj, R. Purohit, Mutational analysis on membrane associated transporter protein (MATP) and their structural consequences in oculocutaeous albinism type 4 (OCA4)-a molecular dynamics approach, J. Cell. Biochem., 117 (2016), 2608-2619. doi: 10.1002/jcb.25555
|
| [13] |
X. Fan, L. Shi, H. Fang, Y. Cheng, R. Perkins, W. Tong, DNA microarrays are predictive of cancer prognosis: a re-evaluation, Clin. Cancer Res., 16 (2010), 629-636. doi: 10.1158/1078-0432.CCR-09-1815
|
| [14] |
L. Ein-Dor, O. Zuk, E. Domany, Thousands of samples are needed to generate a robust gene list for predicting outcome in cancer, Proc. Natl. Acad. Sci., 103 (2006), 5923-5928. doi: 10.1073/pnas.0601231103
|
| [15] |
S. Michiels, S. Koscielny, C. Hill, Prediction of cancer outcome with microarrays: a multiple random validation strategy, Lancet, 365 (2005), 488-492. doi: 10.1016/S0140-6736(05)17866-0
|
| [16] |
S. E. Wilhite, T. Barrett, Strategies to explore functional genomics data sets in NCBI's GEO database, Methods Mol. Biol., 802 (2012), 41-53. doi: 10.1007/978-1-61779-400-1_3
|
| [17] |
S. Venneti, J. T. Huse, The evolving molecular genetics of low-grade glioma, Adv. Anat. Pathol., 22 (2015), 94-101. doi: 10.1097/PAP.0000000000000049
|
| [18] |
F. Wu, R. C. Chai, Z. Wang, Y. Q. Liu, Z. Zhao, G. Z. Li, et al., Molecular classification of IDH-mutant glioblastomas based on gene expression profiles, Carcinogenesis, 40 (2019), 853-860. doi: 10.1093/carcin/bgz032
|
| [19] |
J. Lomax, Get ready to GO! A biologist's guide to the Gene Ontology, Briefings Bioinf., 6 (2005), 298-304. doi: 10.1093/bib/6.3.298
|
| [20] |
M. Kanehisa, S. Goto, KEGG: kyoto encyclopedia of genes and genomes, Nucleic Acids Res., 28 (2000), 27-30. doi: 10.1093/nar/28.1.27
|
| [21] |
L. Slemc, T. Kunej, Transcription factor HIF1A: downstream targets, associated pathways, polymorphic hypoxia response element (HRE) sites, and initiative for standardization of reporting in scientific literature, Tumour Biol., 37 (2016), 14851-14861. doi: 10.1007/s13277-016-5331-4
|
| [22] |
M. Kohl, S. Wiese, B. Warscheid, Cytoscape: software for visualization and analysis of biological networks, Methods Mol. Biol., 696 (2011), 291-303. doi: 10.1007/978-1-60761-987-1_18
|
| [23] |
C. H. Chin, S. H. Chen, H. H. Wu, C. W. Ho, M. T. Ko, C.Y. Lin, CytoHubba: identifying hub objects and sub-networks from complex interactome, BMC Syst. Biol., 8 (2014), 1-7. doi: 10.1186/1752-0509-8-1
|
| [24] |
Z. Tang, C. Li, B. Kang, G. Gao, C. Li, Z. Zhang, GEPIA: a web server for cancer and normal gene expression profiling and interactive analyses, Nucleic Acids Res., 45 (2017), W98-W102. doi: 10.1093/nar/gkx247
|
| [25] | M. Uhlen, L. Fagerberg, B. M. Hallstrom, C. Lindskog, P. Oksvold, A. Mardinoglu, Tissue-based map of the human proteome, Science, 347 (2015). |
| [26] |
Y. Gusev, K. Bhuvaneshwar, L. Song, J. C. Zenklusen, H. Fine, S. Madhavan, The REMBRANDT study, a large collection of genomic data from brain cancer patients, Sci. Data, 5 (2018), 180158. doi: 10.1038/sdata.2018.158
|
| [27] |
A. M. Griesinger, D. K. Birks, A. M. Donson, V. Amani, L. M. Hoffman, A. Waziri, et al., Characterization of distinct immunophenotypes across pediatric brain tumor types, J. Immunol., 191 (2013), 4880–4888. doi: 10.4049/jimmunol.1301966
|
| [28] |
B. S. Kruthika, R. Jain, A. Arivazhagan, R. D. Bharath, T. C. Yasha, P. Kondaiah, et al., Transcriptome profiling reveals PDZ binding kinase as a novel biomarker in peritumoral brain zone of glioblastoma, J. Neurooncol., 141 (2019), 315–325. doi: 10.1007/s11060-018-03051-5
|
| [29] |
Q. Ma, W. Long, C. Xing, J. Chu, M. Luo, H. Y. Wang, et al., Cancer stem cells and immunosuppressive microenvironment in glioma, Front. Immunol., 9 (2018), 2924. doi: 10.3389/fimmu.2018.02924
|
| [30] |
M. K. Kalita, U. K. Nandal, A. Pattnaik, A. Sivalingam, G. Ramasamy, M. Kumar, et al., CyclinPred: a SVM-based method for predicting cyclin protein sequences, PLoS One, 3 (2008), e2605. doi: 10.1371/journal.pone.0002605
|
| [31] |
Y. Liao, Y. Feng, J. Shen, F. J. Hornicek, Z. Duan, The roles and therapeutic potential of cyclin-dependent kinases (CDKs) in sarcoma, Cancer Metastasis Rev., 35 (2016), 151-163. doi: 10.1007/s10555-015-9601-1
|
| [32] |
F. Brand, A. Forster, A. Christians, M. Bucher, C. M. Thome, M. S. Raab, et al., FOCAD loss impacts microtubule assembly, G2/M progression and patient survival in astrocytic gliomas, Acta Neuropathol., 139 (2020), 175-192. doi: 10.1007/s00401-019-02067-z
|
| [33] |
A. C. Cheng, Y. C. Hsu, C. C. Tsai, The effects of cucurbitacin E on GADD45beta-trigger G2/M arrest and JNK-independent pathway in brain cancer cells, J. Cell. Mol. Med., 23 (2019), 3512-3519. doi: 10.1111/jcmm.14250
|
| [34] |
N. Liu, G. Hu, H. Wang, Z. Li, Z. Guo, PLK1 inhibitor facilitates the suppressing effect of
temozolomide on human brain glioma stem cells, J. Cell. Mol. Med., 22 (2018), 5300–5310. doi: 10.1111/jcmm.13793
|
| [35] | Q. K. Ji, J. W. Ma, R. H. Liu, X. S. Li, F. Z. Shen, L. Y. Huang, et al., CDCA7L promotes glioma proliferation by targeting CCND1 and predicts an unfavorable prognosis, Mol. Med. Rep., 20 (2019), 1149-1156. |
| [36] |
T. Yawata, Y. Higashi, Y. Kawanishi, T. Nakajo, N. Fukui, H. Fukuda, et al., CD146 is highly expressed in glioma stem cells and acts as a cell cycle regulator, J. Neurooncol., 144 (2019), 21-32. doi: 10.1007/s11060-019-03200-4
|
| [37] |
H. Fan, L. Geng, F. Yang, X. Dong, D. He, Y. Zhang, Ursolic acid derivative induces apoptosis in glioma cells through down-regulation of cAMP, Eur. J. Med. Chem., 176 (2019), 61-67. doi: 10.1016/j.ejmech.2019.04.059
|
| [38] |
J. B. Vannier, G. Sarek, S. J. Boulton, RTEL1: functions of a disease-associated helicase, Trends Cell Biol., 24 (2014), 416-425. doi: 10.1016/j.tcb.2014.01.004
|
| [39] |
T. Wang, X. Li, S. L. Sun, EX527, a Sirt-1 inhibitor, induces apoptosis in glioma via activating the p53 signaling pathway, Anti-cancer Drugs, 31 (2020), 19-26. doi: 10.1097/CAD.0000000000000824
|
| [40] |
L. X. Xu, Z. H. Li, Y. F. Tao, R. H. Li, F. Fang, H. Zhao, et al., Histone acetyltransferase inhibitor Ⅱ induces apoptosis in glioma cell lines via the p53 signaling pathway, J. Exp. Clin. Cancer Res., 33 (2014), 1-15. doi: 10.1186/1756-9966-33-1
|
| [41] |
X. L. Zhang, X. T. Ji, B. Sun, L. L. Qian, X. L. Hu, H. X. Lou, et al., Anti-cancer effect of marchantin C via inducing lung cancer cellular senescence associated with less secretory phenotype, Biochim. Biophys. Acta Gen. Subj., 1863 (2019), 1443-1457. doi: 10.1016/j.bbagen.2019.05.006
|
| [42] |
J. Song, Q. Ma, M. Hu, D. Qian, B. Wang, N. He, The inhibition of miR-144-3p on cell proliferation and metastasis by targeting TOP2A in HCMV-positive glioblastoma cells, Molecules, 23 (2018), 3259. doi: 10.3390/molecules23123259
|
| [43] |
X. Li, E. Martinez-Ledesma, C. Zhang, F. Gao, S. Zheng, J. Ding, et al., TIE2-FGFR1 interaction induces adaptive PI3K inhibitor resistance by upregulating Aurora A/PlK1/CDK1 signaling in glioblastoma, Cancer Res., 79 (2019), 5088-5101. doi: 10.1158/0008-5472.CAN-19-0325
|
| [44] |
L. Xu, H. Liu, Z. Yan, Z. Sun, S. Luo, Q. Lu, Inhibition of the Hedgehog signaling pathway suppresses cell proliferation by regulating the Gli2/miR-124/AURKA axis in human glioma cells, Int. J. Oncol., 50 (2017), 1868-1878. doi: 10.3892/ijo.2017.3946
|
| [45] |
Y. Ding, S. Yu, Z. Bao, Y. Liu, T. Liang, CDC20 with malignant progression and poor prognosis of astrocytoma revealed by analysis on gene expression, J. Neurooncol., 133 (2017), 87-95. doi: 10.1007/s11060-017-2434-8
|
| [46] |
Y. Zhang, J. Li, K. Yi, J. Feng, Z. Cong, Z. Wang, et al., Elevated signature of a gene module coexpressed with CDC20 marks genomic instability in glioma, Proc. Natl. Acad. Sci., 116 (2019), 6975-6984. doi: 10.1073/pnas.1814060116
|
| [47] | Z. Song, Y. Pan, G. Ling, S. Wang, M. Huang, X. Jiang, et al., Escape of U251 glioma cells from temozolomide-induced senescence was modulated by CDK1/survivin signaling, Am. J. Transl. Res., 9 (2017), 2163-2180. |
| [48] |
S. Deguchi, K. Katsushima, A. Hatanaka, K. Shinjo, F. Ohka, T. Wakabayashi, et al., Oncogenic effects of evolutionarily conserved noncoding RNA ECONEXIN on gliomagenesis, Oncogene, 36 (2017), 4629-4640. doi: 10.1038/onc.2017.88
|
| [49] |
M. Shahid, M. Y. Lee, H. Piplani, A. M. Andres, B. Zhou, A. Yeon, et al., Centromere protein F (CENPF), a microtubule binding protein, modulates cancer metabolism by regulating pyruvate kinase M2 phosphorylation signaling, Cell Cycle, 17 (2018), 2802-2818. doi: 10.1080/15384101.2018.1557496
|
| [50] |
M. Shahid, M. Kim, M. Y. Lee, A. Yeon, S. You, H. L. Kim, et al., Downregulation of CENPF remodels prostate cancer cells and alters cellular metabolism, Proteomics, 19 (2019), 1900038. doi: 10.1002/pmic.201900038
|
| [51] |
X. Yang, B. S. Miao, C. Y. Wei, R. Z. Dong, P. T. Gao, X. Y. Zhang, et al., Lymphoid-specific helicase promotes the growth and invasion of hepatocellular carcinoma by transcriptional regulation of centromere protein F expression, Cancer Sci., 110 (2019), 2133-2144. doi: 10.1111/cas.14037
|
 mbe-18-03-107-Supplementary.pdf mbe-18-03-107-Supplementary.pdf |
 |

Figures(8) / Tables(4)

Moxuan Zhang, Quan Zhang, Jilin Bai, Zhiming Zhao, Jian Zhang. Transcriptome analysis revealed CENPF associated with glioma prognosis[J]. Mathematical Biosciences and Engineering, 2021, 18(3): 2077-2096. doi: 10.3934/mbe.2021107


 DownLoad: