Colon tumor endothelial cells (CTECs) plays substantial roles to induce immune invasion, angiogenesis and metastasis. Thus, identification of the CTECs-derived transcriptomes could be helpful for colon cancer diagnosis and potential therapy.
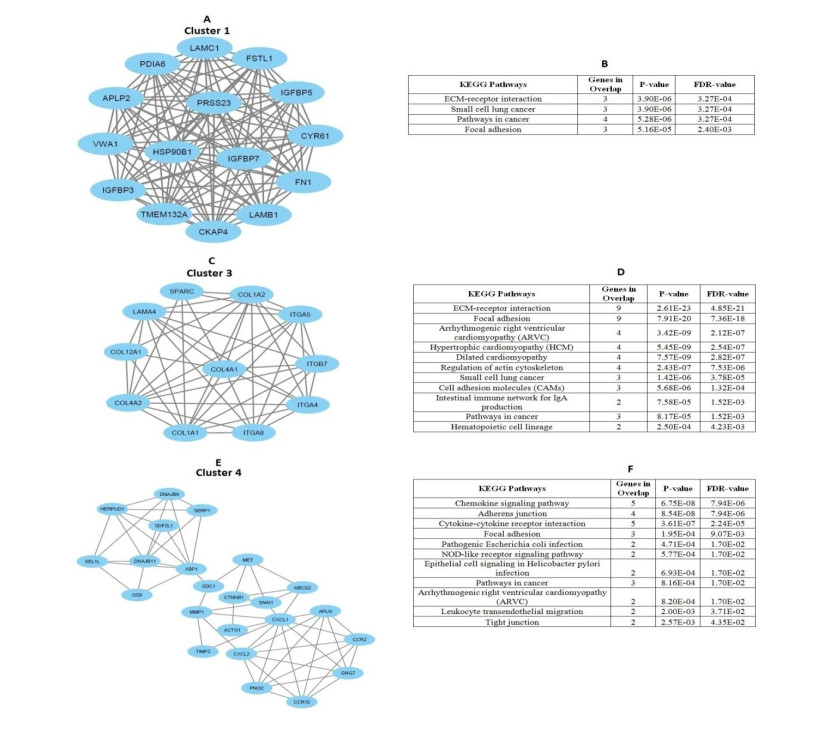
By analysis of CTECs-derived gene expression profiling dataset, we identified differentially expressed genes (DEGs) between CTECs and colon normal endothelial cells (CNECs). In addition, we identified the significant pathways and protein-protein interaction (PPI) network that was significantly associated with the DEGs. Furthermore, we identified hub genes whose expression was significantly associated with prognosis and immune cell infiltrations in colon cancer. Finally, we identified the significant correlations between the prognostic hub genes and immune-inhibitory markers in colon cancer.
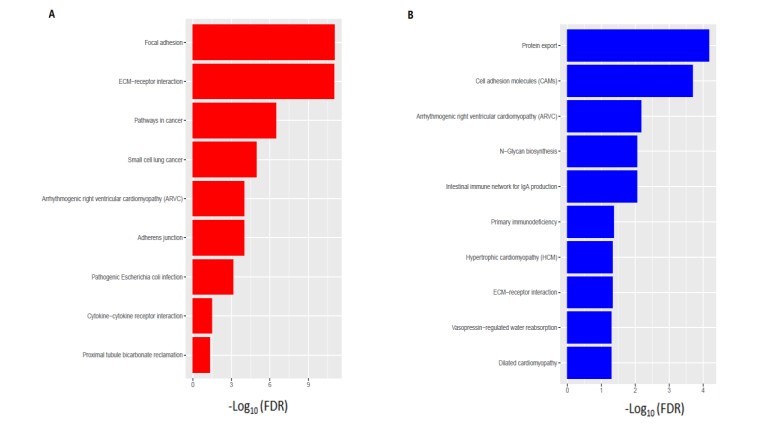
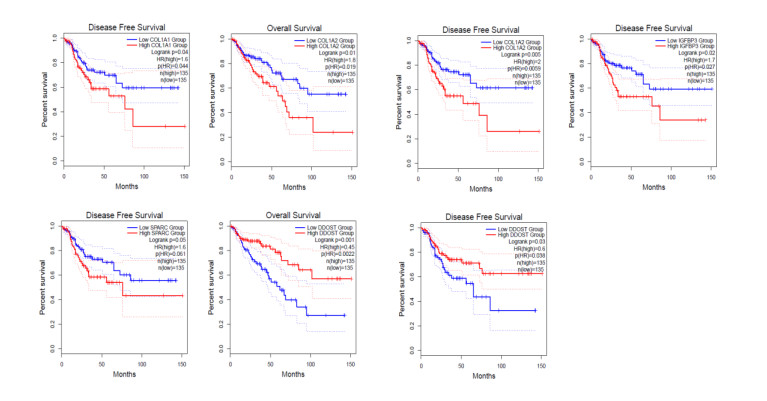
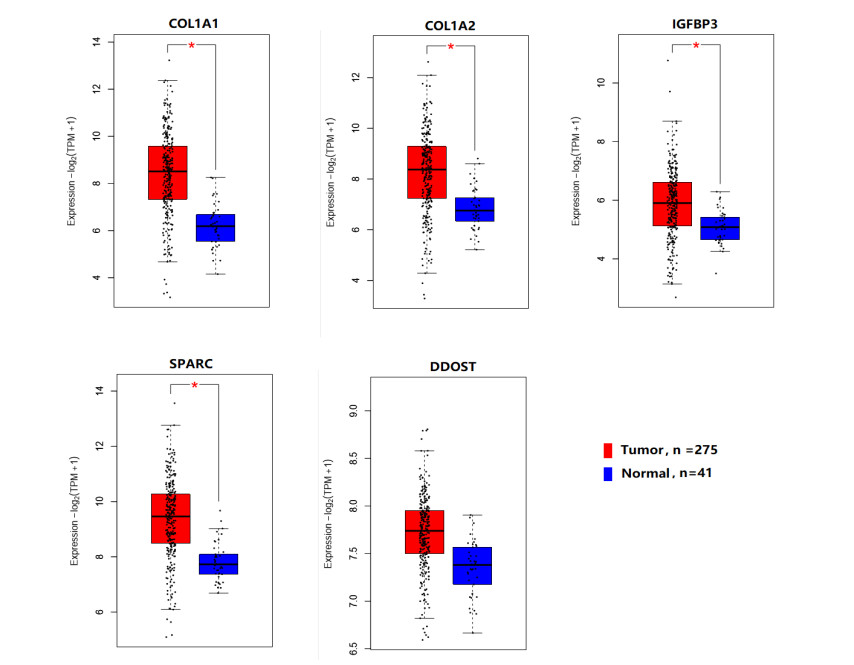
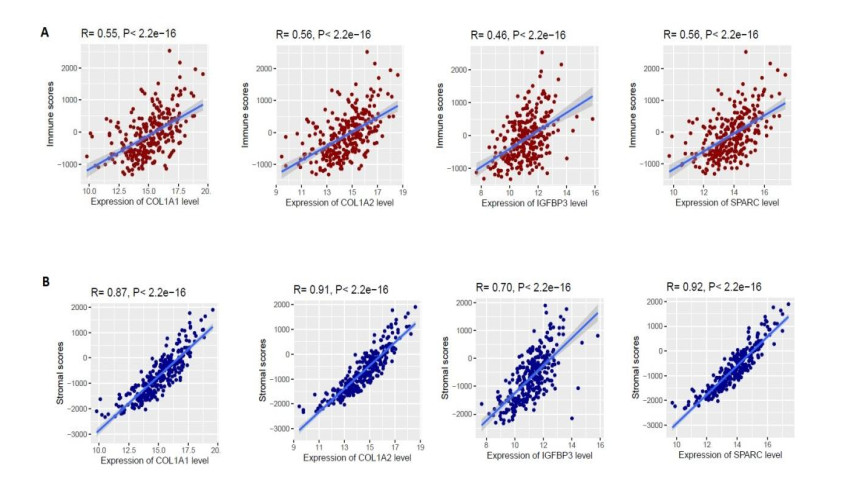
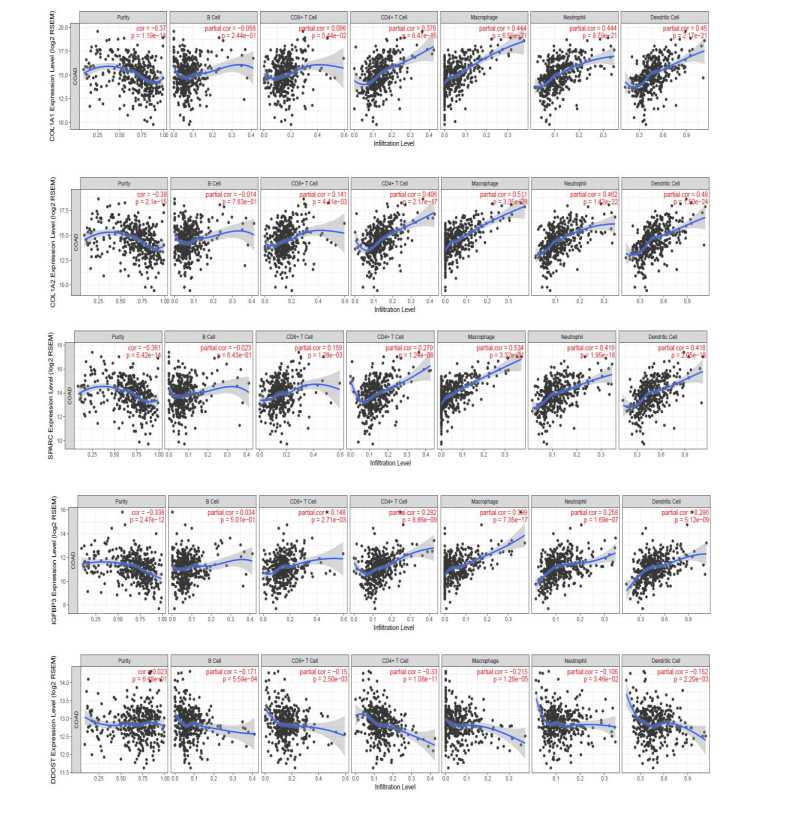
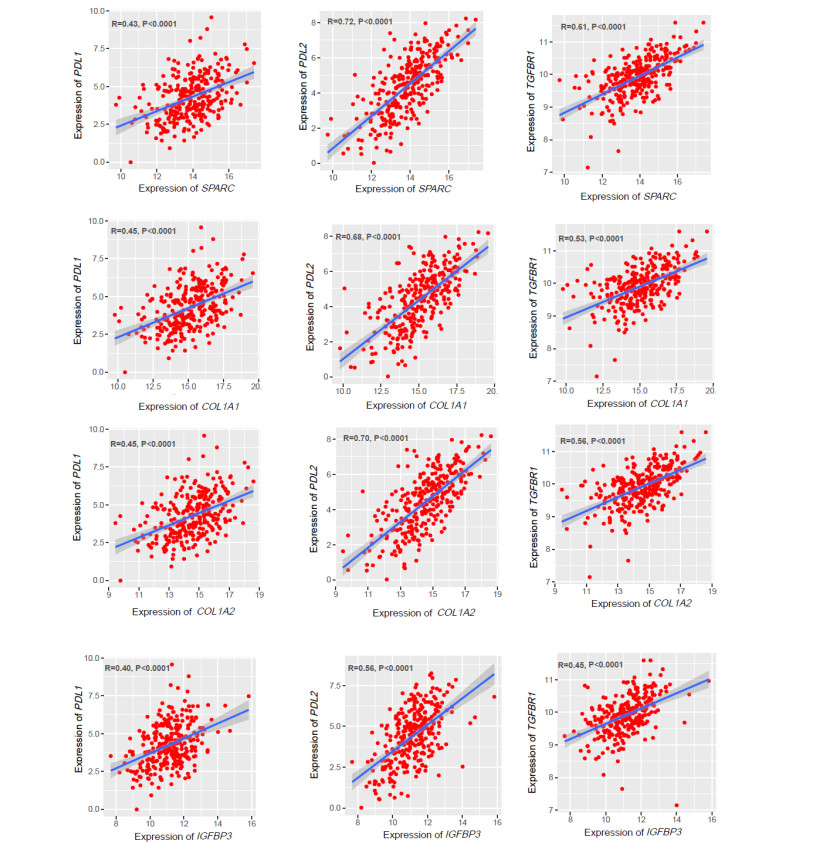
We identified 362 DEGs in CTECs relative to the CNECs, including117 up-regulated genes and 245 down-regulated genes in the CTECs. In addition, we identified significantly up-regulated pathways in CTECs that were mainly involved in cancer and immune regulation. Furthermore, we identified hub genes (such as SPARC, COL1A1, COL1A2 and IGFBP3) that are associated with prognosis and immune cells infiltrations in colon cancer. Interestingly, we found that prognosis-associated hub genes (SPARC, COL1A1, COL1A2 and IGFBP3) are positively correlated with immune-inhibitory markers of various immunosuppressive cells, including TAM, M2 macrophage, Tregs and T cell exhaustion. Finally, our findings revealed that prognosis-associated upregulated hub genes are positively correlated with immune checkpoint markers, including PD-L1 and PD-L2 and the immunosuppressive markers including TGFB1 and TGFBR1.
The identification of CTECs-specific transcriptomes may provide crucial insights into the colon tumor microenvironment that mediates the development of colon cancer.
Citation: Jie Wang, Md. Nazim Uddin, Rehana Akter, Yun Wu. Contribution of endothelial cell-derived transcriptomes to the colon cancer based on bioinformatics analysis[J]. Mathematical Biosciences and Engineering, 2021, 18(6): 7280-7300. doi: 10.3934/mbe.2021360
Colon tumor endothelial cells (CTECs) plays substantial roles to induce immune invasion, angiogenesis and metastasis. Thus, identification of the CTECs-derived transcriptomes could be helpful for colon cancer diagnosis and potential therapy.
By analysis of CTECs-derived gene expression profiling dataset, we identified differentially expressed genes (DEGs) between CTECs and colon normal endothelial cells (CNECs). In addition, we identified the significant pathways and protein-protein interaction (PPI) network that was significantly associated with the DEGs. Furthermore, we identified hub genes whose expression was significantly associated with prognosis and immune cell infiltrations in colon cancer. Finally, we identified the significant correlations between the prognostic hub genes and immune-inhibitory markers in colon cancer.
We identified 362 DEGs in CTECs relative to the CNECs, including117 up-regulated genes and 245 down-regulated genes in the CTECs. In addition, we identified significantly up-regulated pathways in CTECs that were mainly involved in cancer and immune regulation. Furthermore, we identified hub genes (such as SPARC, COL1A1, COL1A2 and IGFBP3) that are associated with prognosis and immune cells infiltrations in colon cancer. Interestingly, we found that prognosis-associated hub genes (SPARC, COL1A1, COL1A2 and IGFBP3) are positively correlated with immune-inhibitory markers of various immunosuppressive cells, including TAM, M2 macrophage, Tregs and T cell exhaustion. Finally, our findings revealed that prognosis-associated upregulated hub genes are positively correlated with immune checkpoint markers, including PD-L1 and PD-L2 and the immunosuppressive markers including TGFB1 and TGFBR1.
The identification of CTECs-specific transcriptomes may provide crucial insights into the colon tumor microenvironment that mediates the development of colon cancer.

| [1] |
K. C. Valkenburg, A. E. de Groot, K. J. Pienta, Targeting the tumour stroma to improve cancer therapy, Nat. Rev. Clin. Oncol., 15 (2018), 366-381. doi: 10.1038/s41571-018-0007-1

|
| [2] |
N. Maishi, D. A. Annan, H. Kikuchi, Y. Hida, K. Hida, Tumor endothelial heterogeneity in cancer progression, Cancers, 11 (2019), 1511. doi: 10.3390/cancers11101511
|
| [3] |
S. M. Weis, D. A. Cheresh, Tumor angiogenesis: molecular pathways and therapeutic targets, Nat. Med., 17 (2011), 1359-1370. doi: 10.1038/nm.2537
|
| [4] |
D. Hanahan, R. A. Weinberg, Hallmarks of cancer: the next generation, Cell, 144 (2011), 646-674. doi: 10.1016/j.cell.2011.02.013
|
| [5] |
N. Maishi, K. Hida, Tumor endothelial cells accelerate tumor metastasis, Cancer Sci., 108 (2017), 1921-1926. doi: 10.1111/cas.13336
|
| [6] |
F. Bray, J. Ferlay, I. Soerjomataram, R. L. Siegel, L. A. Torre, A. Jemal, Global cancer statistics 2018: GLOBOCAN estimates of incidence and mortality worldwide for 36 cancers in 185 countries, CA: Cancer J. Clin., 68 (2018), 394-424. doi: 10.3322/caac.21492
|
| [7] | M. N. Uddin, M. Li, X. Wang, Identification of transcriptional signatures of colon tumor stroma by a meta-analysis, J. Oncol., 2019 (2019), 8752862. |
| [8] | C. Isella, A. Terrasi, S. E. Bellomo, C. Petti, G. Galatola, A. Muratore, et al., Stromal contribution to the colorectal cancer transcriptome, Nat. Genet., 47 (2015), 312-319. |
| [9] |
M. N. Uddin, M. Li, X. Wang, Identification of transcriptional markers and microRNA-mRNA regulatory networks in colon cancer by integrative analysis of mRNA and microRNA expression profiles in colon tumor stroma, Cells, 8 (2019), 1054. doi: 10.3390/cells8091054
|
| [10] | A. Calon, E. Lonardo, A. Berenguer-Llergo, E. Espinet, X. Hernando-Momblona, M. Iglesias, et al., Stromal gene expression defines poor-prognosis subtypes in colorectal cancer, Nat. Genet., 47 (2015), 320-329. |
| [11] | L. Zuurbier, A. Rahman, M. Cordes, J. Scheick, T. J. Wong, F. Rustenburg, et al., Apelin: a putative novel predictive biomarker for bevacizumab response in colorectal cancer, Oncotarget, 8 (2017), 42949-42961. |
| [12] | Z. Tang, C. Li, B. Kang, G. Gao, C. Li, Z. Zhang, GEPIA: a web server for cancer and normal gene expression profiling and interactive analyses, Nucleic Acids Res., 45 (2017), W98-W102. |
| [13] | T. Li, J. Fan, B. Wang, N. Traugh, Q. Chen, J. S. Liu, et al., TIMER: a web server for comprehensive analysis of tumor-infiltrating immune cells, Cancer Res., 77 (2017), e108-e110. |
| [14] | J. Xia, E. E. Gill, R. E. Hancock, NetworkAnalyst for statistical, visual and network-based meta-analysis of gene expression data, Nat. Protoc., 10 (2015), 823-844. |
| [15] | A. Subramanian, P. Tamayo, V. K. Mootha, S. Mukherjee, B. L. Ebert, M. A. Gillette, et al., Gene set enrichment analysis: a knowledge-based approach for interpreting genome-wide expression profiles, P. Natl. Acad. Sci., 102 (2005), 15545-15550. |
| [16] | M. Kanehisa, M. Furumichi, M. Tanabe, Y. Sato, K. Morishima, KEGG: new perspectives on genomes, pathways, diseases and drugs, Nucleic Acids Res., 45 (2017), D353-D361. |
| [17] | D. Szklarczyk, A. L. Gable, D. Lyon, A. Junge, S. Wyder, J. Huerta-Cepas, et al., STRING v11: protein-protein association networks with increased coverage, supporting functional discovery in genome-wide experimental datasets, Nucleic Acids Res., 47 (2019), D607-D613. |
| [18] |
G. D. Bader, C. W. Hogue, An automated method for finding molecular complexes in large protein interaction networks, BMC Bioinf., 4 (2003), 1-27. doi: 10.1186/1471-2105-4-1
|
| [19] | K. Yoshihara, M. Shahmoradgoli, E. Martínez, R. Vegesna, H. Kim, W. Torres-Garcia, et al., Inferring tumour purity and stromal and immune cell admixture from expression data, Nat. Commun., 4 (2013), 1-11. |
| [20] | H. Wickham, ggplot2: elegant graphics for data analysis, Media, 35(2009), 10-1007. |
| [21] | J. H. Pan, H. Zhou, L. Cooper, J. L. Huang, S. B. Zhu, X. X. Zhao, et al., LAYN is a prognostic biomarker and correlated with immune infiltrates in gastric and colon cancers, Front. Immunol., 10 (2019), 6. |
| [22] | P. Danaher, S. Warren, L. Dennis, L. Amico, A. White, et al., Gene expression markers of tumor infiltrating leukocytes, J. Immuno. Ther. Cancer, 5 (2017), 1-15. |
| [23] | N. O. Siemers, J. L. Holloway, H. Chang, S. D. Chasalow, P. B. Ross-MacDonald, C. F. Voliva, et al., Genome-wide association analysis identifies genetic correlates of immune infiltrates in solid tumors, PloS One, 12 (2017), e0179726. |
| [24] |
S. Sousa, J. Määttä, The role of tumour-associated macrophages in bone metastasis, J. Bone Oncol., 5 (2016), 135-138. doi: 10.1016/j.jbo.2016.03.004
|
| [25] |
M. N. Uddin, R. Akter, M. Li, Z. Abdelrahman, Expression of SARS-COV-2 cell receptor gene ACE2 is associated with immunosuppression and metabolic reprogramming in lung adenocarcinoma based on bioinformatics analyses of gene expression profiles, Chem.-Biol. Interact., 335 (2021), 109370. doi: 10.1016/j.cbi.2021.109370
|
| [26] | D. Drev, F. Harpain, A. Beer, A. Stift, E. S. Gruber, M. Klimpfinger, et al., Impact of fibroblast-derived SPARC on invasiveness of colorectal cancer cells, Cancers, 11 (2019), 1421. |
| [27] |
S. Nallanthighal, J. P. Heiserman, D. J. Cheon, The role of the extracellular matrix in cancer stemness, Front. Cell Dev. Biol., 7 (2019), 86. doi: 10.3389/fcell.2019.00086
|
| [28] | Y. L. Hsu, Y. J. Chen, W. A. Chang, S. F. Jian, H. L. Fan, J. Y. Wang, et al., Interaction between tumor-associated dendritic cells and colon cancer cells contributes to tumor progression via CXCL1, Int. J. Mol. Sci., 19 (2018), 2427. |
| [29] | J. H. Rho, J. J. Ladd, C. I. Li, J. D. Potter, Y. Zhang, D. Shelley, et al., Protein and glycomic plasma markers for early detection of adenoma and colon cancer, Gut, 67 (2018), 473-484. |
| [30] |
K. Triff, K. Konganti, S. Gaddis, B. Zhou, I. Ivanov, R. S. Chapkin, Genome-wide analysis of the rat colon reveals proximal-distal differences in histone modifications and proto-oncogene expression, Physiol. Genomics, 45 (2013), 1229-1243. doi: 10.1152/physiolgenomics.00136.2013
|
| [31] | X. Cai, C. Liu, T. N. Zhang, Y. W. Zhu, X. Dong, P. Xue, Down-regulation of FN1 inhibits colorectal carcinogenesis by suppressing proliferation, migration and invasion, J. Cell. Biochem., 119 (2018), 4717-4728. |
| [32] | Z. Dong, W. Lin, S. A. Kujawa, S. Wu, C. Wang, Predicting microRNA target genes and identifying hub genes in ⅡA stage colon cancer patients using bioinformatics analysis, Biomed Res. Int., 2019 (2019), 6341967. |
| [33] | W. Yang, J. Ma, W. Zhou, Z. Li, X. Zhou, B. Cao, et al., Identification of hub genes and outcome in colon cancer based on bioinformatics analysis, Cancer Manage. Res., 11 (2019), 323-338. |
| [34] | J. Wen, X. Min, M. Shen, Q. Hua, Y. Han, L. Zhao, et al., ACLY facilitates colon cancer cell metastasis by CTNNB1, J. Exp. Clin. Cancer Res., 38 (2019), 1-12. |
| [35] | M. R. Akl, P. Nagpal, N. M. Ayoub, S. A. Prabhu, M. Gliksman, B. Tai, et al., Molecular and clinical profiles of syndecan-1 in solid and hematological cancer for prognosis and precision medicine, Oncotarget, 6 (2015), 28693-28715. |
| [36] | F. Azimi, R. A. Scolyer, P. Rumcheva, M. Moncrieff, R. Murali, S. W. McCarthy, et al., Tumor-infiltrating lymphocyte grade is an independent predictor of sentinel lymph node status and survival in patients with cutaneous melanoma, J. Clin. Oncol., 30 (2012), 2678-2683. |
| [37] |
S. Shalapour, M. Karin, Pas de Deux: control of anti-tumor immunity by cancer-associated inflammation, Immunity, 51 (2019), 15-26. doi: 10.1016/j.immuni.2019.06.021
|
| [38] |
A. Sawant, J. A. Hensel, D. Chanda, B. A. Harris, G. P. Siegal, A. Maheshwari, et al., Depletion of plasmacytoid dendritic cells inhibits tumor growth and prevents bone metastasis of breast cancer cells, J. Immunol., 189 (2012), 4258-4265. doi: 10.1186/1471-2105-12-1
|
| [39] | B. Li, C. N. Dewey, RSEM: accurate transcript quantification from RNA-Seq data with or without a reference genome, BMC Bioinf., 12 (2011), 1-16. |
| [40] |
A. Facciabene, G. T. Motz, G. Coukos, T-regulatory cells: key players in tumor immune escape and angiogenesis, Cancer Res., 72 (2012), 2162-2171. doi: 10.1158/0008-5472.CAN-11-3687
|
| [41] | Y. H. Huang, C. Zhu, Y. Kondo, A. C. Anderson, A. Gandhi, A. Russell, et al., CEACAM1 regulates TIM-3-mediated tolerance and exhaustion, Nature, 517 (2015), 386-390. |
| [42] | H. H. Lee, Y. N. Wang, W. Xia, C. H. Chen, K. M. Rau, L. Ye, et al., Removal of N-linked glycosylation enhances PD-L1 Detection and Predicts Anti-PD-1/PD-L1 therapeutic efficacy, Cancer Cell, 36 (2019), 168-178. |
| [43] | J. H. Yearley, C. Gibson, N. Yu, C. Moon, E. Murphy, J. Juco, et al., PD-L2 expression in human tumors: relevance to anti-PD-1 therapy in cancer, Clin. Cancer Res., 23 (2017), 3158-3167. |
| [44] |
J. Zavadil, E. P. Böttinger, TGF-beta and epithelial-to-mesenchymal transitions, Oncogene, 24 (2005), 5764-5774. doi: 10.1038/sj.onc.1208927
|
| [45] | D. Gu, S. Li, M. Du, C. Tang, H. Chu, N. Tong, et al., A genetic variant located in the miR-532-5p-binding site of TGFBR1 is associated with the colorectal cancer risk, J. Gastroenterol., 54 (2019), 141-148. |
| [46] |
F. Wu, L. Liu, H. Zhou, Endothelial cell activation in central nervous system inflammation, J. Leukocyte Biol., 101 (2017), 1119-1132. doi: 10.1189/jlb.3RU0816-352RR
|
| [47] | C. Scimone, P. Bramanti, A. Ruggeri, L. Donato, C. Alafaci, C. Crisafulli, et al., CCM3/SERPINI1 bidirectional promoter variants in patients with cerebral cavernous malformations: a molecular and functional study, BMC Med. Genet., 17 (2016), 1-7. |
| [48] | C. Scimone, F. Granata, M. Longo, E. Mormina, C. Turiaco, A. A. Caragliano, et al., Germline mutation enrichment in pathways controlling endothelial cell homeostasis in patients with brain arteriovenous malformation: implication for molecular diagnosis, Int. J. Mol. Sci., 21 (2020), 4321. |
| [49] | C. Rinaldi, P. Bramanti, C. Scimone, L. Donato, C. Alafaci, et al., Relevance of CCM gene polymorphisms for clinical management of sporadic cerebral cavernous malformations, J. Neurol. Sci., 380 (2017), 31-37. |
| [50] | C. Scimone, L. Donato, Z. Katsarou, S. Bostantjopoulou, R. Angelo, et al., Two novel krit1 and CCM2 mutations in patients affected by cerebral cavernous malformations: new information on CCM2 penetrance, Front. Neurol., 9 (2018), 953. |
| [51] | C. Scimone, P. Bramanti, A. Ruggeri, Z. Katsarou, L. Donato, A. Sidoti, et al., Detection of novel mutation in ccm3 causes familial cerebral cavernous malformations, J. Mol. Neurosci., 57 (2015), 400-403. |
 Supplementary Table S1.txt Supplementary Table S1.txt |
 |
| Supplementary Table S2.txt |
|
| Supplementary Table S3.txt |
|
Figures(7) / Tables(5)

Jie Wang, Md. Nazim Uddin, Rehana Akter, Yun Wu. Contribution of endothelial cell-derived transcriptomes to the colon cancer based on bioinformatics analysis[J]. Mathematical Biosciences and Engineering, 2021, 18(6): 7280-7300. doi: 10.3934/mbe.2021360


 DownLoad: